
Abstract
Tourism increasingly reflects living standards, with its economic impact steadily growing. This research employs a modified gravity model and social network analysis to assess tourism-driven economic linkages among 284 Chinese prefecture-level cities (2007–2019). It investigates the spatial network structure of urban tourism sectors and identifies key influencing factors. The findings indicate that tourism economic connections have been consistently strengthened, but such connections’ overall level remains low, with significant intercity disparities, reflecting the “Matthew effect” prevalent in core cities. The interconnected web of urban tourism economies demonstrates strong mutual influence and ripple effects. The network’s structure is strengthening, but its unity could be enhanced. Furthermore, the spatial network is characterized by a “diamond” configuration, with the Beijing-Tianjin-Hebei region, the Yangtze River Delta, the Pearl River Delta, the Wuhan area, and the Chengdu-Chongqing regions serving as pivotal axes connected by boundaries, demonstrating an evolution from points to lines and from lines to surfaces. The layout of urban tourism economies is really shaped by a few key things. Being close to other cities, having different attractions, and not being on the same level economically tends to bring cities together. On the flip side, if cities have very different industries, that can actually create some distance between them when it comes to tourism. This study puts forward specific strategies and suggestions.
Plain Language Summary
Tourism has become an important indicator of the standard of living, and the scale of the tourism economy has been continuously expanding as well. Based on tourism-related indicators from 284 prefecture-level cities in China between 2007 and 2019, this study employs a modified gravity model and social network analysis to measure the strength of tourism-related economic connections among the cities over 13 years. It analyzes the spatial network structure characteristics of urban tourism economies and discusses the influencing factors. The findings indicate that tourism economic connections have been consistently strengthened, but such connections’ overall level remains low, with significant intercity disparities, reflecting the “Matthew effect” prevalent in core cities. The spatial network of urban tourism economies exhibits significant correlation and spillover effects; although the network structure is gradually stabilizing, the overall network density requires further enhancement. Furthermore, the spatial network is characterized by a “diamond” configuration, with the Beijing-Tianjin-Hebei region, the Yangtze River Delta, the Pearl River Delta, the Wuhan area, and the Chengdu-Chongqing regions serving as pivotal axes connected by boundaries, demonstrating an evolution from points to lines and from lines to surfaces. Factors, such as geographical proximity, variations in tourism resource endowment, and differences in economic development levels, positively influence the formation of the urban tourism economic spatial network, while disparities in regional industrial structures exert a negative impact. This study proposes targeted countermeasures and recommendations. These include enhancing the economic strength of urban tourism, strengthening the spatial network connections within the tourism economy, and optimizing the spatial network structure in a rational manner.
Keywords
Introduction
Globally, tourism development generally manifests significant spatial imbalances and often solidifies into a “core-periphery” structure (Pearce & Butler, 1999). This phenomenon of “tourism polarization” not only constrains the economic potential of less-developed regions but also raises widespread concerns about sustainable development. This manifests as: the over-exploitation and concentration of resources in core hub areas, ecosystem degradation, and the severe inequitable distribution of economic benefits among regions.
From a geographical perspective, the tourism economy reveals a spatial structure that showcases the ebb and flow of tourism-related activities (Kim et al., 2021). With the development of high-speed transport and digital information networks, inter-city tourism economic linkages are becoming increasingly complex. Therefore, understanding how these tourism economic flows construct “spatial networks”—and how these network structures, in turn, exacerbate or mitigate this imbalance—has become a core issue of shared concern for global tourism geography and regional economics. Studying this structure is essential for optimizing resource allocation, formulating effective policies, and addressing developmental imbalances (Gan et al., 2021). Existing research on the effects of spatial structure on tourism economic development has garnered significant attention (Li et al., 2025). However, previous studies have rarely explored the dynamic evolution of spatial networks, overlooking key features shaped by the flows of resources, technology, and tourism revenue. Employing spatial network analysis helps to reveal the multifaceted capacities and evolutionary trends of the tourism economy, as well as to identify interactions related to regional proximity and sectoral relationships.
In this global context, China, as a prominent global tourist destination, provides a unique “natural laboratory” for examining the aforementioned (global) issues. Over the past two decades, China has experienced the world’s fastest and largest-scale construction of a high-speed railway network, coupled with the explosive growth of digital tourism platforms. This drastic “time-space compression” and “network restructuring” has produced a dual effect. On the one hand, it offers a unique and ideal sample for observing the dynamic evolution of spatial networks. On the other hand, the high degree of imbalance and drastic evolution it exhibits is, in itself, a typical microcosm of the global challenge of “tourism polarization.” Therefore, an in-depth analysis of this case not only lays the groundwork for China’s strategic planning but also, more importantly, provides “insightful Chinese models” for other nations’ industrial modernization and regional cooperation efforts, establishing it as a globally relevant benchmark with significant practical implications.
This paper investigates the following research questions: (1) What trends did China’s urban tourism economic connections exhibit during the study period? What trends and stratified traits define the spatial network? (2) From a holistic network perspective, What defines the attributes of the economic and spatial network in urban tourism? Are there significant spatial correlations and spillover effects? (3) From an individual network perspective, what are the main channels and subgroups of inter-city tourism economic connections? Which cities play hub, bridge, or intermediary roles in the network, and what spatial differences do they reflect? (4) What elements shape the structure and intensity of intercity tourism-driven economic connections? How do factors like distance, tourism potential, economic status, resource availability, and industrial composition influence trends and outcomes?
Literature Review
Currently, academic study on tourism economy spatial patterns primarily adheres to the logical framework of “comprehensive measurement - structural characteristics - spatial effects - influencing factors” (Y. Li & Zhang, 2022; Z. Wang et al., 2020; Y. Wang & Wu, 2022; Zhou et al., 2021). Studies indicate that the tourism economy can influence other regions through mechanisms such as resource endowment, industrial structure, transportation conditions, and ecological environment, thereby exhibiting significant spatial correlation characteristics and spillover effects (Tang, 2024). These studies typically examine spatial structures descriptively, focusing on horizontal expansion and static contexts, but lack a holistic view of the tourism economy’s spatial network architecture. In other words, existing research prioritizes the exploration of “attribute data” pertaining to the tourism economy, ignoring benefits from “connected data” when locating spatial links. Tourism economy networks overcome geographical constraints, dynamically shaping spatial structure. This perspective overcomes the constraints of studying the modes, patterns, results, and benefits of tourism economic activities, facilitating a deeper investigation into characteristics such as hierarchy, order, and scale within spatial processes.
Current studies on tourism’s economic spatial network center mainly on three areas. Initially, they explore spatial network analysis of tourism elements. Some scholars have conducted spatial network analyses on various components of tourism economic activities, including tourist flow (Shao et al., 2020), information flow (Chen et al., 2022a), transportation (S. Liu et al., 2023), and virtual networks (Cehan et al., 2021). The dynamic interplay between these components has fostered the development of interconnected urban tourism economies, yet as collaboration and exchange between cities intensify, the resulting spatial network has grown increasingly intricate. Consequently, analyzing a single tourism element is insufficient to capture the intricate interactive relationships among cities.
Second, scholars conduct analyses using various research scales, such as employing provinces as sample units to explore tourism economic spatial networks at national or regional levels (H. Li & Xie, 2022; Q. Liu et al., 2022) and utilizing cities as sample units to analyze tourism economic spatial networks at regional or provincial levels (Chen et al., 2022b; Gan et al., 2021). However, the coordinated development of national tourism economic spatial networks, from a city perspective, requires further investigation. Compared to provincial samples, smaller-scale samples (cities) are more sensitive to fluctuations in tourism economic development. The study’s results offer vital pathways for boosting tourism sector advancement. Hence, urban areas are key sampling units for analyzing spatial changes, growth trends, and effects within the nation’s tourism economy.
Third, influential factors and their operative mechanics were scrutinized. Researchers have examined various influencing factors or driving mechanisms, including regional transportation networks (Wang et al., 2022a), industrial structures (Luo & Wang, 2023), and government policies (G. Yang et al., 2022). However, the economic dynamics of tourism operate within an intricate web of interconnected factors, driven by diverse elements like regional prosperity (Ji & Wang, 2022), availability of tourist attractions (Zhang et al., 2020), industrial structure (Zhang & Ju, 2021), tourism development potential (Deng, 2022), and geographical location (Wang et al., 2022b). Research indicates that tourism’s economic geography arises from the confluence of these varied influences. Therefore, exploring the development of this network structure based on multidimensional factors and conducting empirical analyses of the influencing elements is crucial for understanding the interactions and collaborations within the tourism economy.
Materials and Methods
Research Methods
Modified Gravity Model
The economic gravity model, inspired by classical mechanics’ universal gravitation, has evolved through varied assumptions tailored to specific research contexts, expanding into a robust theoretical framework. Currently, tourism and investment flows are often gaged using the gravity model in academia (H. Li & Xie, 2022; Yin, 2020). The study employs an adapted gravity model to assess tourism’s economic relevance in 284 cities, with the following equations:


where Qij denotes the tourism economy correlation between cities i and j.
Urban tourism economies form spatial networks through interregional connections. Spatial correlation matrix development underpins social network theory’s implementation. Each urban center serves as a “node,” while the inter-city connectivity of their tourism sectors forms a “link” within the network. The network’s correlation strength indicates urban tourism economic ties. This study employs an adjusted gravity model to develop an urban tourism economy spatial linkage matrix, converting the binary spatial relation matrix. Given the spatial differences between cities, this paper takes the matrix mean value as the critical value of binary matrix division (Bai et al., 2020; Jiang et al., 2020). When the tourism economy’s linked value exceeds the average, it receives a score of 1, signifying a meaningful connection between the tourism sectors of the row and column cities. Conversely, if the value falls below the average, it scores 0, reflecting no discernible relationship between them.
Social Network Analysis
Social network analysis, as seen in Z. Li et al. (2017), assesses network structure, including urban tourism links. This research studies these patterns, examining both overall frameworks and individual node roles. A comprehensive breakdown of these findings can be found in Table 1.
Analysis and Measurement of Tourism Economy’s Spatial Network Indicators.

Note. In the formula, L = relational bibliography in the network; m = actors; K = unreachable pairs; N = symmetrically reachable points; R = redundant lines; Li = connections between node i and cities; dij = shortest path between i and j; gjk(i) = shortcuts through i between j and k; gjk = shortcuts between j and k.
Overall Network Characteristic Indexes
Density reflects the tourism economic network’s cohesion. Higher network density signifies a more compact tourism economic spatial network among cities. Increased network density signifies strengthened spatial economic ties among urban tourism centers. Network interconnectedness indicates spatial network resilience. Greater network relevance enhances spatial structure stability. Network hierarchy describes the extent to which the spatial network is asymmetrically accessible. Greater hierarchy begets more structured spatial networks. Network efficiency reveals the extent of the spare lines appearing in the spatial network. Reduced efficiency increases spatial network gaps, relational overflow, and structural stability.
Individual Network Characteristic Index
Degree centrality assesses a node’s location within the network’s structure. Higher degree centrality means a city is more connected and important in the economic network. Betweenness centrality quantifies a city’s control over network resource flows. Greater centrality indicates a city’s heightened capacity to mediate inter-urban economic links and amplify its intermediary role. Closeness centrality quantifies a node’s independence from network control by other nodes. Greater proximity centrality signifies reduced distance to, stronger ties with, and heightened autonomy within the spatial network.
Quadratic Assignment Procedure Regression Analysis
QAP analysis represents a nonparametric method relying on random permutations for its assessment. The QAP multiple regression analysis allows evaluation of the regression link between independent and dependent variable matrices, as well as the model’s R2 goodness-of-fit significance (Cao et al., 2023). QAP regression assesses China’s urban tourism economy determinants within its spatial network.
Data Source and Processing
Using data from 2007 to 2019, this study examines 284 Chinese prefectures. A revised gravity framework generated 284 × 284 tourism economy spatial correlation matrices. Data for the gravity model—covering tourism income, visitor numbers, and GNP—were drawn from official sources such as the China City Statistical Yearbook, China Tourism Statistical Yearbook, municipal yearbooks, and city-level socioeconomic reports (2008–2020). Some prefecture-level cities lack data for different years. Data gaps were filled using interpolation techniques, enhancing suitability for analysis and study.
Results
Analysis of Tourism Economic Connection Strength
This study quantifies urban tourism-driven economic linkages, deriving aggregate connection strengths for each city. Furthermore, by drawing on the relevant literature (Wu et al., 2015; Zong & Lv, 2020), tourism economic intercity connections are evaluated for intensity. In 40,382 economic connection groups involving 284 cities, the top 0.1%, 0.25%, 1%, and 2% of the four types of connection intensities were selected for comparative analysis. The ArcGIS10.2 software was used for visualization analysis, and four cross-sectional datasets from 2007, 2011, 2015, and 2019 were selected for analysis (Figure 2).
Intensity Differences in Tourism Economic Connections
Figure 1a shows the average and variation in tourism economic linkages across Chinese cities between 2007 and 2019. Mean tourism economic tie strength increased, whereas variability decreased. A sustained rise in mean tourism economic linkage intensity suggests growing interconnectedness among cities; the continuous decrease in the coefficient of variation indicates that the dispersion of the strength between cities is evolving; however, its value is always greater than 1. This shows that weak economic ties between cities cause tourism economic ties to strengthen; however, the overall differences are still large. Figure 1b reflects the development and changes between the strongest and the weakest link in the intensity of China’s urban tourism economic links during the study period. The strongest and weakest links show an “upward” trend, consistent with the variation pattern of the mean connection intensity. Furthermore, the difference between them ranges in multiples of 146.68 to 1207.21. Multiples converging near peak values suggest diminished disparity in urban tourism economics, though significant divergence persists.

Key urban tourism economic indicators. (a) The mean value and coefficient of variation from 2007 to 2019. (b) The tie strength, showing the maximum and minimum contact values from 2007 to 2019.
Different Levels of Tourism Economic Connections
This paper divides the 40,328 groups of tourism economic ties in 284 cities into four levels (Table 2). Table 2 shows that, in 2007, there were no cities in China with a tourism economic connectivity strength exceeding 1,000. The numbers of groups with tourism economic connection strengths in the [1,100] and [100,1000] ranges were 914 and 14, respectively. More than 97% of the cities had a tourism economic connection strength of less than 1. This indicates that nationwide tourism economic linkages were weak. In 2011 and 2015, the different grades of tourism economy contact strength improved. By 2019, national city-to-city tourism economic relations significantly strengthened. The share of cities with tourism economic ties below a strength of 1 decreased to 3.5%, suggesting a steady enhancement in the intensity of China’s urban tourism economic linkages. However, the diffusion rate of city groups, with urban tourism economic connection strengths exceeding 1,000, is relatively low. By 2019, only 61 pairs of city groups had tourism economic connection strengths exceeding 1,000. Among them, the Suzhou-Wuxi group had rates of 791, 2,680, and 5,889 at the first three time points, respectively. The “Matthew effect” significantly shapes the tourism economy’s network, with core cities experiencing progressively stronger links.
Classification System of the Intensity of China’s Urban Tourism Economic Connections.

Visualization of Tourism Economic Connections
ArcGIS visualization of 806 key economic linkages (from a dataset of 40,328) highlights the Beijing-Tianjin-Hebei and Yangtze River Delta regions as the primary hubs for urban tourism’s economic network (Figure 2). Wuhan, Chengdu-Chongqing, and the Pearl River Delta also function as important secondary nodes. The five cities form a “diamond” structure in the urban tourism economy. Tourism contact networks initially displayed point-like distributions around core cities (top 0.1%–0.25% in 2007, 2011, 2015), then networked within urban clusters (top 1%–2%). Earlier linkages concentrated on Beijing-Tianjin-Hebei and the Yangtze River Delta, with the eastern coast as a key support. By 2019, links expanded westward from the original five, especially along the Yangtze River Economic Belt, spurred by Shanghai and Suzhou. Key hubs like the Yangtze River Delta, Wuhan, and the Chengdu-Chongqing area served as pivotal nodes, while the Economic Belt itself acted as the central artery driving regional integration.
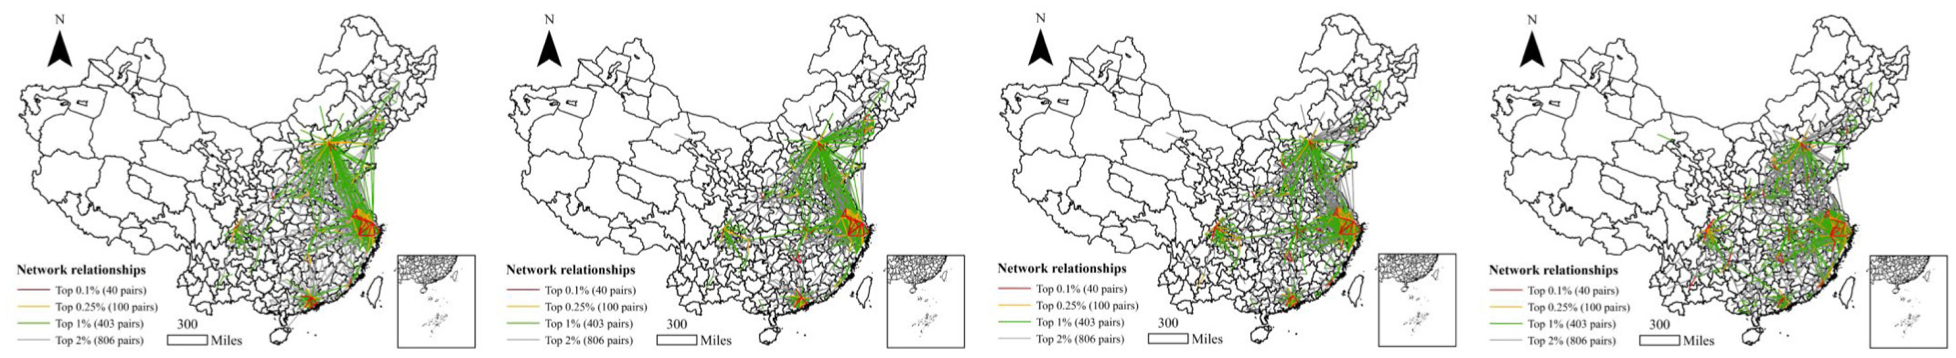
China’s urban tourism economic connection intensity experienced spatial shifts between 2007 and 2019.
Overall Network Characteristics and Evolution
UCINET was used to analyze urban tourism economic spatial network density and relevance from 2007 to 2019 based on a binary relationship matrix, characterizing the overall network.
Network Density
Table 3 shows increased tourism economic network density in the city over the study period. Between 2007 and 2019, network density surged from 0.01 to 0.20—a 13-fold rise—reflecting stronger spatial linkages in the urban tourism economy. Notably, although the network density showed a rising evolutionary trend, network density peaked at just 0.20. Urban tourism’s spatial network density remains substantially below its potential, necessitating improved integration.
China’s Urban Tourism Economic Spatial Network Exhibited Specific Characteristics from 2007 to 2019.

Network Relevance
This includes the network association, efficiency, and level. The degree of network association and density showed the same development trend; that is, it first decreased and then increased. The degree of network association continued to rise and approached 1 in 2019, indicating that the urban tourism economy’s spatial network robustness was continuously improving, and the tourism economy exhibited stronger spatial linkages and spillover effects across cities. The network efficiency and association showed opposite trends. The declining network efficiency suggested a reduction in redundant spatial connections. Intercity bidirectional spillovers grew, reinforcing network stability. The network level exhibited instability and a downward trajectory. The network level dropped from 0.71 in 2007 to 0.07 in 2019. The tourism economy’s organized hierarchy, featuring a rigid spatial connectivity, progressively eroded, and the hierarchical characteristics were not significant. The context progressively fostered a harmonious advancement in urban tourism and economic transformations.
Individual Network Characteristics and Evolution
Using UCINET, we computed degree, betweenness, and closeness centralities for all cities to assess their spatial network roles and positions. Visually mapping the network illustrated its spatial development. Based on the analysis results, four cross-sectional datasets from 2007, 2011, 2015, and 2019 were selected for comparative analysis (Figure 3).

(a) China’s urban tourism economy degree centrality for 2007, 2011, 2015, and 2019, (b) China’s urban tourism economy betweenness centrality in 2007, 2011, 2015, and 2019, and (c) China’s urban tourism economy proximity centrality analyzed in 2007, 2011, 2015, and 2019.
Degree Centrality
In 2019, the mean degree centrality for cities at the prefectural level was 85.67; 128 cities constituted 45.07% of the aggregate. The figure exceeds the mean, suggesting substantial spatial linkages among nearly half the urban centers. Moreover, these urban centers dominated the network’s core spatial zone. Figure 3a reveals that in 2007, key cities—Beijing, Shanghai, Chongqing, Wuhan, and Guangzhou—formed a diamond-shaped network, linked pairwise at its edges. In 2011 and 2015, utilizing the “diamond” model, the cities flanking the core “diamond” hub saw their centrality degrees rise and their node-to-node linkages strengthen, with the reach broadening notably, particularly in the Yangtze River Delta. In 2019, the degree centrality of cities within the scope of the “rhombus” structure improved overall, which is comprehensively represented by the evolution and development from point to line and line to plane.
Betweenness Centrality
In 2019, average betweenness centrality for prefecture-level cities was 0.35, with 59 cities exceeding this, highlighting their pivotal role in spatial networks and adeptness in tourism management and communication. Additionally, 160 cities’ betweenness centrality was less than 0.1, accounting for 56.33% of all cities. These cities had low control abilities in the spatial network and little correlation with other cities. In Figure 3b, the betweenness centrality of the city forms a “diamond” network structure, similar to the degree centrality. In 2007, a “diamond” frame structure was initially formed. In 2011 and 2015, the middle centrality of the cities around the “rhombus” node gradually improved, and the city scope continuously expanded. By 2019, the East’s urban powerhouses weren’t just Shanghai anymore. Metropolitan areas like Beijing-Tianjin-Hebei and the Yangtze Delta are enhancing their influence, showcasing a pattern of urban agglomeration.
Closeness Centrality
In 2019, prefecture-level cities averaged 50.59 in closeness centrality, with 161 cities surpassing this value. Over 56.69% participated actively in the tourism network, reflecting robust connectivity. Unlike degree and betweenness centrality, closeness centrality showed greater balance, highlighting enhanced intercity interaction and complementarity in tourism. In Figure 3c, the closeness centrality of the cities in 2007 showed a parallel development trend of dots and bands. Distinct spatial patterns emerged, with point clusters in cities like Zhengzhou, Chongqing, Wuhan, and Guangzhou, and zonal concentrations along the eastern coast, including regions like Beijing-Tianjin-Hebei, Shandong Peninsula, and Yangtze River Delta. Analyzing the spatial patterns from 2007, we observe that by 2011, 2015, and 2019, the cities closer to the heart of the area expanded, ultimately demonstrating a clear progression from dots to lines and finally to a full-fledged plane. Improved city centrality enhances intercity tourism economies nationwide. The high-value area of proximity to the center remains mainly in the eastern coastal areas.
Influential Aspects of China’s Urban Tourism Economic Network
Model Setting and Variable Description
This study investigates key factors influencing the configuration and evolution of urban tourism spatial networks. Based on prior research (N. Liu et al., 2020; J. Liu & Song, 2018Ma et al., 2020; Ma & Yun, 2017), the explanatory variables include city location, tourism resources, growth potential, economic development, and industrial diversity. These were used to construct a spatial network matrix, with the tourism economic spatial network matrix serving as the dependent variable. The model is structured as follows:

The matrix T captures the spatial connectivity of urban tourism economy, while GS reflects the geographical adjacency between cities. TR denotes the disparity in tourism resource allocation, DP measures variations in tourism growth potential, EI tracks differences in regional economic performance, and IS quantifies contrasts in industrial composition.
Specific explanatory variables were selected as follows:
Geographical Adjacent Features (GS)
Geographical proximity is an important factor that affects tourism economic connections. According to geographic distance decay, nearer locations are more likely to develop tourism economic ties. The study employs the city-to-city geographic adjacency matrix to represent this variable. If the cities are geographically adjacent to each other, the value is 1; otherwise, 0.
Differences in Tourism Resource Endowments (TR)
Tourism resource endowments are an important part of tourism activities. They affect tourism destination choices. The larger the disparity in resource allocation, the higher the likelihood it influences tourists’ selection of destinations, thereby affecting the tourism sector’s economy. This paper derived the urban tourism resource endowment difference matrix by weighting and summing AAAA and higher-rated scenic spots.
Differences in Tourism Development Potential (DP)
A city’s urban tourism potential reflects its overall competitiveness. A city’s competitiveness enhances its tourism services, impacting tourism activity and related economic ties. This paper selects the fixed capital investment difference matrix required for urban development to express this variable.
Differences in Levels of Economic Development (EI)
The extent of a city’s economic progress is a key determinant of its investment in tourist enhancement initiatives. Economic advancement enhances tourism support and a city’s tourist appeal. When the economic gap between cities widens, so does the disparity in their appeal to tourists. This dynamic naturally strengthens the interconnectedness of their tourism economies. This study used the difference matrix of the regional gross product to express this variable.
Differences in Regional Industrial Structures (IS)
The difference in urban industrial structures affects the circulation and exchange of tourism information, resources, and technology between cities. The smaller the difference in the industrial structures, the fewer obstacles there will be to interconnections between tourism industries, and the stronger the correlation between tourism economies. The study employs a matrix depicting the tertiary industry’s added value as a percentage of GDP to denote the variable.
Spatial Network Influencing Factors Analysis
The model employed QAP regression to assess factors shaping China’s urban tourism spatial economic network. The years 2007, 2011, 2015, and 2019, and 5,000 random replacements were selected for the QAP regression. The adjusted R2 values (.08–.17, p < .01) indicate that the five key factors explained 7.8% to 17% of the tourism economy network’s spatial correlations. See Table 4 for specifics. Regression analysis indicated substantial temporal consistency in factors influencing tourism’s spatial economic network, revealing notable developmental stability. Specific results follow.
Regression Results of the Influencing factors of China’s Urban Tourism Economic Spatial Network.
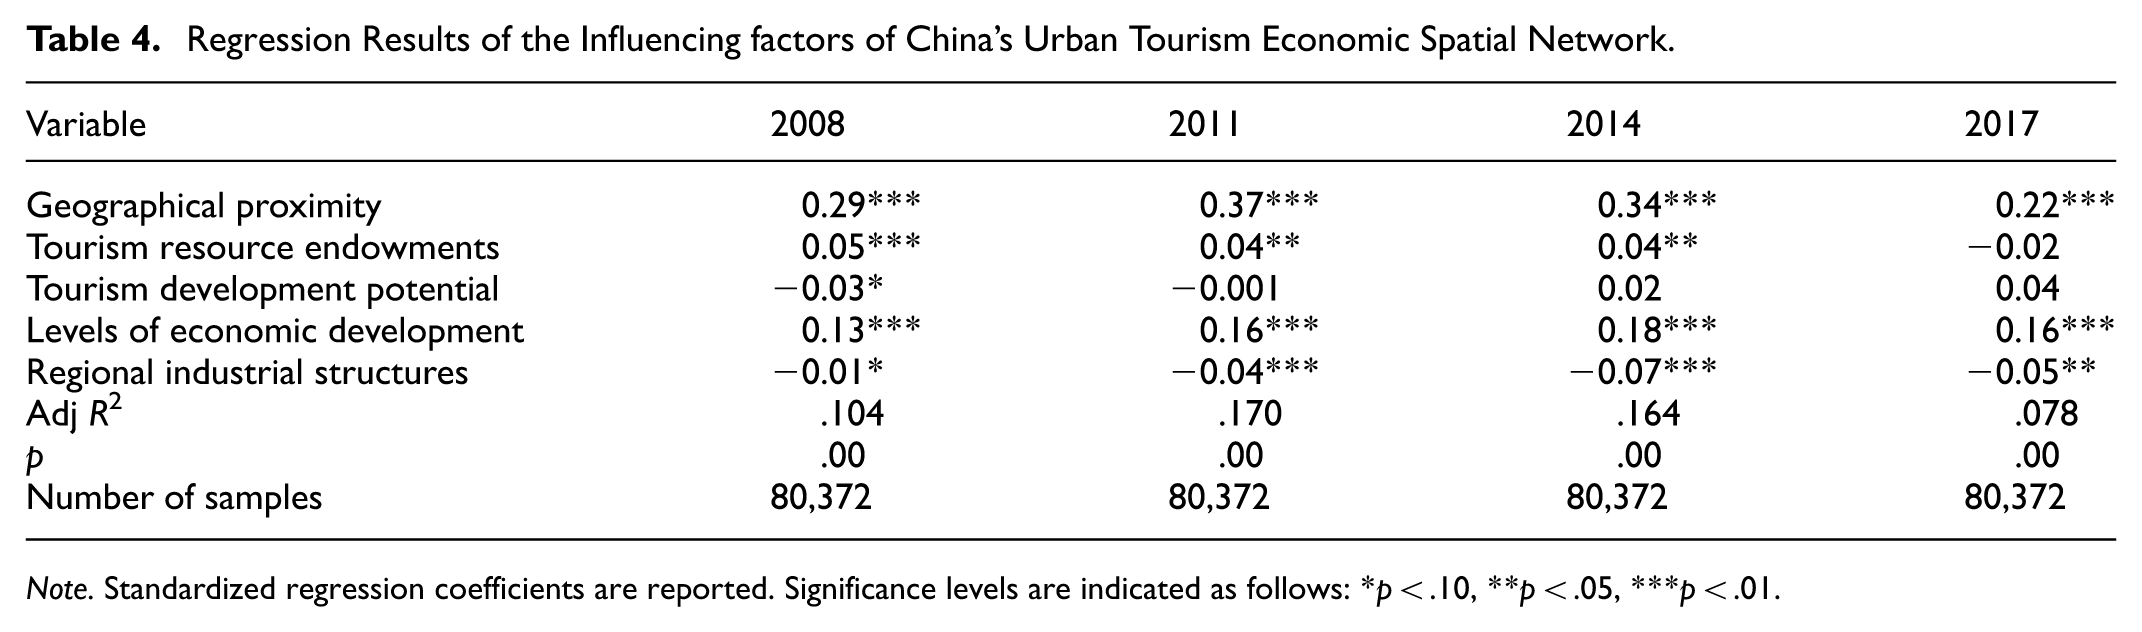
Note. Standardized regression coefficients are reported. Significance levels are indicated as follows: *p < .10, **p < .05, ***p < .01.
Proximity coefficients were positive and statistically significant (p < .01), with correlations (0.221–0.372) confirming geography’s key role in shaping urban tourism networks. Closer distances strengthened economic spillovers, boosting regional tourism integration through enhanced connectivity.
Positive, significant tourism resource endowment differences were evident, with Pearson correlation values between .038 and .048. Larger disparities in assets had stronger influence on travel choices, enhancing tourist appeal and shaping the industry’s economic network.
Uneven tourism potential, though not definitively, negatively impacts tourism economy spatial networks. Tourism potential, reflecting urban tourism service capacity, supports regional economic growth. Disparities hinder integrated service experiences.
Economic disparity positively affects tourism networks, as shown by coefficients passing significance tests. Cities with higher economic development support more tourism initiatives, enhancing their attractiveness and fostering interconnected regional tourism economies.
Regional industrial structure disparities showed a consistently negative coefficient, indicating that similar setups enhance tourism economic connectivity. This was evident in concurrent development phases and facilitated information, tech, knowledge, and capital flow, forming a spatial tourism economy network.
Discussion
This study not only illustrates the current structure of China’s urban tourism economic network but also reveals its complex dynamic evolutionary mechanisms. Diverging from previous studies that have largely focused on static patterns (W. Yang et al., 2025), the core contribution of this study lies in revealing the dual evolutionary logic of the network, which is driven by the competing forces of “polarization” and “flattening.”
First, one of the most significant findings of this study is the intensification of the “Matthew effect” and the solidification of a “diamond-shaped” spatial structure. This indicates that despite the overall strengthening of connections, network resources (e.g., tourist sources, investment, and information) are irreversibly concentrating in a few core hubs (such as the Beijing-Tianjin-Hebei region, the Yangtze River Delta, etc.). This finding confirms and extends the applicability of the classic “core-periphery” theory (Friedmann, 1966) in the domain of tourism economics. However, unlike the traditional “growth pole” theory (Perroux, 1950), which relies on a single core, the “diamond-shaped” polycentric (or multi-center) structure we identified may align more closely with the “networked growth pole” concept proposed by D. G. Wang et al. (2018). This concept posits that growth is no longer a simple “point-based” radiation, but is instead channeled along specific “axes” (such as the connecting lines of the diamond structure).
Secondly, this study reveals a key “paradox”: while the network is becoming more “polarized,” its “efficiency” and “hierarchy” are paradoxically declining. Traditional network analysis (e.g., Boccaletti et al., 2006) often views declining “efficiency” as a sign of network degradation. However, our findings challenge this perspective. We argue that this “loss” of efficiency may precisely be the trade-off for an increase in network “resilience.” The decline in network efficiency is correlated with an increase in “redundant connections” (as indicated by our model). While these redundant paths are inefficient for optimal transmission, they provide critical “alternative pathways” and “buffers” when the network suffers shocks (such as pandemics or policy changes; Liao et al., 2025). Simultaneously, the decline in hierarchy indicates that, even as the absolute dominance of core cities increases, a large number of small and medium-sized cities are becoming increasingly active by playing “intermediary” and “bridge” roles. This suggests that the network is transitioning from a pyramid-like, rigid hierarchy toward a flatter, more flexible collaborative network.
Furthermore, examining the node attributes and driving factors, this study uncovers the roots of “spatial disequilibrium.” Although the network is “flattening” overall, the node attributes reveal that the developmental imbalance (e.g., Eastern coastal regions vs. inland areas) remains stark (or glaring). This indicates that even in the context of generally improved network connectivity, the accessibility of development opportunities remains highly unequal. Our findings support the perspective of Graham and Marvin (2002) that, without strong institutional intervention, networkization tends to “solidify” (or “entrench”) rather than “dissolve” pre-existing spatial inequalities. In terms of driving factors, the positive roles of “geographical proximity” and “resource endowments” are consistent with the conclusions of numerous spatial economics studies (Feng et al., 2024; Fu & Zhang, 2025). However, a more significant finding of this study is the negative impact of regional industrial structure differences. This may reveal an “'exclusive' rather than 'complementary' proximity relationship.” Urban clusters with similar industrial structures exhibit tight internal connections, whereas regions with excessive structural disparities (e.g., industrial cities vs. tourism cities) struggle to establish effective economic ties, lacking a common industrial “language” and "chain of interest."
Conclusion
This study systematically investigated the evolutionary trajectory and structural dynamics of China’s urban tourism economic network. Our core findings reveal that the tourism economic network is in a complex state of transition, characterized by a central paradox: the network is simultaneously becoming “more integrated and flatter” while also growing “more polarized and unbalanced.”
On the one hand, the network shows clear signs of “maturation.” This is evidenced by enhanced overall linkage intensity, narrowing inter-city disparities, and significant structural shifts. The network is evolving from a rigid “core-periphery” hierarchy toward a flatter, more cooperative topology. This evolution, paradoxically, appears to foster greater structural stability, laying the groundwork for coordinated regional collaboration. On the other hand, this maturation process is deeply constrained by persistent spatial disequilibrium. A pronounced “Matthew effect” ensures that established, core metropolitan areas continue to consolidate their dominance, “monopolizing” network resources. This creates a clear divide between high-value hubs, predominantly along the eastern coast, and the sparsely connected peripheral regions. Despite a gradual “westward-gravitating” trend, the network’s overall development remains highly uneven.
Therefore, the primary contribution of this study lies in identifying and interpreting this fundamental tension. We argue that China’s urban tourism economic network is not merely “simply growing”; it is simultaneously evolving through both “integration” and “polarization.” This more nuanced understanding moves beyond simple measures of growth to reveal the complex and competing forces shaping China’s regional tourism economy. More importantly, it provides an “early warning” and a “benchmark model.” For other nations attempting to replicate China’s tourism development path, this study’s findings offer valuable lessons, helping them to foresee the potential spatial inequalities and sustainability challenges that may arise.
Policy Recommendations
Based on this study’s findings on the dual evolution of China’s urban tourism economic network, characterized by simultaneous “integration” and “polarization,” the following three recommendations are proposed to guide its development toward a more efficient, balanced, and resilient direction.
Solidifying the Network Foundation: Shifting Focus from “Strengthening Individual Nodes” to “reshaping Connections”
First, reduce “institutional barriers.” It is imperative to dismantle local protectionism, lower inter-regional market entry barriers, and minimize policy friction. This will facilitate the transition of tourism factors (such as talent, capital, and data) from unidirectional spillovers to bidirectional circulation, thereby activating the numerous potential “symmetrically-reachable paths” within the network.
Second, build “efficient connections.” Given that this study identifies the limitations of geographical distance (as noted in the Limitations section), policymakers should move beyond traditional infrastructure. We recommend building novel connections based on “time costs” and “information accessibility”—for example, by accelerating the standardization and construction of cross-regional “smart cultural tourism” data platforms—to bridge (or compensate for) geographical discontinuities.
Optimizing the Spatial Pattern: Moving from “Core Agglomeration” to “Axis-Driven” Development
First, channel the “Matthew effect.” Policy should not merely reinforce the core cities but must shift to utilizing and channeling them. Policy levers (such as taxation, land use policies, and project collaborations) should be used to guide the “Matthew effect” of core cities (e.g., Beijing-Tianjin-Hebei, Yangtze River Delta). Their “siphoning effect” must be transformed into “structural spillovers” onto the surrounding cities along the “diamond” axes.
Second, activate the “diamond axes.” The diamond structure is a key finding of this study. We recommend establishing specialized “'axis city' tourism cooperation alliances” centered around the four axes of the diamond (e.g., Beijing-Tianjin-Hebei–Wuhan, Wuhan–Chengdu-Chongqing). Such alliances must transcend existing administrative boundaries of urban agglomerations, focusing instead on resource sharing, joint marketing, and industrial chain integration along these axes. This will transform the “point-like” (or nodal) cores into “linear” (or corridor-based) growth corridors.
Targeted Governance: Differentiated Strategies Based on Driving Factors
First, be wary of the negative effects of “industrial differences.” This is a critical finding of our study. It suggests that cities with excessive disparities in their industrial structures struggle to form effective tourism economic linkages. Therefore, policy should not blindly pursue “industrial complementarity.” Instead, it should prioritize the deep integration of regions characterized by “industrial convergence” or similarity.
Second, utilize a “dual strategy” for proximity. For neighboring regions with different industrial structures, the focus should be on building complementary chains of interest. For neighboring regions with similar industrial structures, the low-cost advantages of geographical proximity should be leveraged. This can be achieved by establishing mechanisms such as “cross-municipal tourism enclave demonstration zones” to promote the shift from homogeneous competition to integrated collaboration.
Research Limitations and Future Concerns
This study has limits. The gravity model’s approach to measuring economic ties in urban tourism relies solely on geographical distance, overlooking the influence of comprehensive transport systems—including highways, rail networks, and air travel—on the dynamics of regional tourism economies. In the future, the above factors should be integrated into the influence model for testing. This paper adopts the mean value as the threshold value for binarization to construct the association matrix. Hence, the influence of the association weight should be considered in the future. Moreover, the tourism economy’s spatial framework is shaped by information flows, including transportation, communication, and tech infrastructure. The outcome stems from the interaction of various elements, necessitating a deeper investigation into additional potential explanatory variables to enhance the model.
Footnotes
Acknowledgements
Many thanks to those who helped us during the writing of this article.
Ethical Considerations
Not applicable. This study is based on the analysis of publicly available statistical data.
Consent to Participate
Not applicable.
Funding
The authors disclosed receipt of the following financial support for the research, authorship, and/or publication of this article: This study is supported by he National Social Science Fund General Project (24CGL096).
Declaration of Conflicting Interests
The authors declared no potential conflicts of interest with respect to the research, authorship, and/or publication of this article.
Data Availability Statement
The datasets generated during and/or analyzed during the current study are available from the corresponding author on reasonable request.