
Abstract
Rural out-migration is a development issue shaping rural-urban interaction in the global south. Population re-distribution from rural to urban areas has development consequences for both the source and the destination areas. At destination, this phenomenon contributes to rapid population growth, while at origin, it contributes to labour drain. To support integrated rural and urban development, it is imperative to predict rural out-migration flows. Following Agent Based Modelling (ABM) approach, we simulated rural out-migration flows in Uganda. Simulated out-migrant volumes show an increasing trend for the decades 2020 to 2040. Rural out-migration flow will peak in 2040 and then decline steadily for the decade 2040 to 2050. This simulated trend in out-migration will ultimately impact the pyramid structure of the rural population. We predict a decline (about 6%) in the proportion of the population in the younger age groups (below19 years) during the decades 2030 to 2050. Most rural out-migrants will be from the middle age structures (between 20 and 44 years). Furthermore, the population pyramid shows steady increase in older age (above 55 years) rural population in the next 30 years, since 2020. The simulated out-migrant volumes and changes in age structure of the rural population imply consequences on labour-intensive livelihoods in the out-migrants catchment areas.
Introduction
While Uganda is predominantly a rural society, the country is becoming increasingly urbanised with an average annual urban population growth rate of 6% since 2000 (Uganda Bureau of Statistics [UBOS], 2020). This growth rate is higher than that of the rural population which stands at 2.7% (UBOS, 2020). Spatially, the urban built-up land is increasing rapidly (Government of Uganda [GoU], 2019). Urban areas are quickly transforming from small trading centres to larger built-up areas with denser populations and sprawling settlements dispersed across the country (GoU, 2019). As a consequence, urban centres of more than 100,000 inhabitants have increased from 2 in 2002 to 23 in 2020 (UBOS, 2020). Rural to urban migration is one of the drivers for this rapid urban population growth (Tumwesigye et al., 2021a). Most urban centres provide better economic and social welfare services relative to the services in rural areas and therefore act as poles of population growth and distribution (Awumbila, 2015; Tumwesigye et al., 2021a).
Rural to urban migration remains a significant contributor to Uganda’s fast urbanisation (UBOS, 2020). The contribution effect from natural population growth is steadily declining due to the gradual decrease in total fertility rates amongst urban dwellers (Kasibante, 2015; World Bank, 2011). Rural populations, especially the youth are increasingly moving to cities because it is where they perceive there are opportunities for better and more prosperous lives (livelihoods) (Tumwesigye et al., 2021a).
This rural out-migration-urbanisation nexus in Uganda is often discussed as a homogeneous phenomenon, although it is not: for instance rural out-migrants come from households of different social and economic backgrounds (Tumwesigye et al., 2021b). Additionally, rural and urban areas, which often are origin and destination areas respectively, have differences in their social and economic attributes (UBOS, 2020), which are often subject to developmental change and transformation. Conceptually, the differences in social and economic status – over space and time scales – lead to different migration decisions including whether to stay or to move, who will move and where to (de Haas, 2021). The rural to urban migration phenomenon is not only taking place in Uganda but also in other developing countries. For instance, in most countries in South Asia and Sub-Saharan Africa (SSA), where the rural population is still disproportionately large, migration is dominated by movement from rural to urban areas (Brueckner & Lall, 2015). Most migrants seek employment and business opportunities in urban areas within their countries or within neighbouring regional economic hubs. In fact, 80% of SSA migrants in 2020 did not have an interest leaving their countries (International Organization for Migration [IOM], 2020). In Asia and the Pacific, 1.2 billion additional urban dwellers are projected by 2050, all moving from the rural areas (United Nations, 2018). Rural to urban migration is often motivated by perceived access to welfare opportunities, and prospective better social services at destinations (Tumwesigye et al., 2021a). Additionally, climate change related disasters, for instance longer droughts, storms and floods, are contributing to a rise in migration. Since 2010, an average of 2.5 million Africans is displaced each year due to climate induced disasters, and 28 million climate migrants are projected in SSA countries by 2050 (Calderon et al., 2022). Climate change is accelerating the pattern of rural to urban migration in the global south (World Bank, 2022). Often, the spatial imbalances related to social and economic development induce people movement (Hatton & Williamson, 1998) as rural out-migrants seek to maximize the anticipated life-welfare and livelihood opportunities at urban destinations (de Haas, 2021). Therefore, the social and economic environments at origin and destination are important in understanding a migration process (Mabogunje, 1970). We consider rural out-migration as a spatial process influenced by the social and economic attributes and their changes, of which the (potential) migrants are a constituent part.
Uganda is undergoing social economic transformation with associated increasing trends in people movement and urbanisation (UNDP & UN-Habitat, 2021): although the country’s social and economic growth may be slowed down by the impacts of Covid19 pandemic. Nevertheless, the country is progressively transitioning into an urban society and 60% of its population is predicted to live in towns by 2050 (World Bank, 2021). As the fifth most rapidly growing population globally (at 3.6%) (World Bank, 2021), Uganda’s population (re-) distribution will continue to match the population growth pattern and consequently increase the volumes of internal migrants (Africa Development Bank, 2019; United Nations Development Programme, 2009). Antecedently, rural to urban migration is a dominant form of internal migration in Uganda. For instance, 66% of the 1.4 million internal migrants enumerated during the national census of 2014 had permanently settled in urban areas (Uganda Bureau of Statistics [UBOS], 2016). Relative to rural areas, the urban centres offer better social services (education, health, access to clean water and electricity), more (potential) business and employment opportunities and higher wages; thus act as attraction poles for population concentration and (re-) distribution (Tumwesigye et al., 2021a).
Population re-distribution from rural to urban areas has development consequences for both the source and the destination areas. At the origin, for instance, it can lead to brain-drain and labour transfer thereby potentially negatively affecting agricultural production (Gollin, 2016) and the rural economy in general. It can also impact land use and lead to changes particularly into land use forms that are less labour-intensive (Tumwesigye et al., in press). Such could impact rural livelihoods, especially for the smallholder farmers, who are over 89% of rural households in Uganda (Ministry of Agriculture Animal Industry and Fisheries [MAAIF], 2020). At destination, it can lead to overcrowding, urban sprawl and slum development particularly where planning is lagging behind (Vermeiren et al., 2013; Weldegebriel, 2021).
Addressing the consequences of rural to urban migration requires evidence-based policy and practice that would steer the population distribution-urbanisation nexus towards sustainable forms (Awumbila, 2015). Relevant empirical evidence can be generated through answering key questions on rural-urban interaction, including questions such as ‘What are the future rural out-migration flows?’; ‘Can we predict internal rural-urban migration in developing countries where there are minimal migration records?’ (Carammia & Dumont, 2018; OECD, 2018; van Vliet et al., 2020). Often, migration forecasts focus on international migration volumes, because of the availability of relevant data that forms a basis to adapt most prediction approaches (Acostamadiedo et al., 2020; UN-DESA, 2020). Moreover, population mobility within most developing countries is not well documented. The lack of records on internal migration makes it difficult to study the previous trends and make realistic future predictions. As such, there are few migration prediction studies on internal migration in developing countries (Neumann & Hilderink, 2015). Internal migration is highlighted as a sustainable development and policy issue for inclusive rural to urban transition in many developing countries, including Uganda (IOM, 2020; Zeng et al., 2016).
To contribute towards effective planning, proper management of urban transition and the promotion of integrated rural-urban development in Uganda, it is important to anticipate rural to urban migration trends with insights on future migration volumes and potential areas of origin, as well as destination. Therefore, the overall objective of this study is to predict rural out-migration and its effect on the population structure in rural Uganda. We take the Ankole sub-region in western Uganda as a case study to answer the following study questions: Where will rural out-migrants come from? How will out-migration evolve and how will it impact the demographic composition in the study area?
Study Area
Consistent with migration studies conducted in developing countries, this research employs a case study approach. The study focuses on rural out-migration in the Ankole sub-region of western Uganda (see Figure 1). This sub-region was selected due to its significant urban population growth, rising from 17% in 2002 to an estimated 29% in 2020 (UBOS, 2020). This rapid urbanization is, in part, driven by rural to urban migration; for example, during the 2014 national census, Ankole reported an internal migration rate of 11.2% (see Figure 1; UBOS, 2016). The Ankole sub-region comprises 12 administrative districts, with a total population of 3.2 million people in 2020, and a population concentration of 223 people/km2 (UBOS, 2020). While predominantly rural, this sub-region is rapidly urbanising.

(a) The Uganda’s intercensal (2002–2014) internal migration flow and rural out-migration rate in 2014. (b) The spatial distribution of urban centres in Ankole sub-region in 2021 and surveys per district.
The urban landscape of the Ankole sub-region includes Mbarara city, which has a population of approximately 300,000 inhabitants, alongside four rapidly growing municipalities, each with at least 100,000 inhabitants, and 45 town councils with populations of at least 5,000 (see Figure 1). This sub-region is experiencing significant urbanization, with secondary towns expanding quickly in both population and geographic size (Ministry of Finance Planning Economic Development [MoFPED], 2018). Ankole’s towns serve as hubs for local government administration, healthcare facilities, educational institutions and economic infrastructure (MoFPED, 2018). Compared to the surrounding rural areas, the urban centres in the Ankole sub-region provide enhanced opportunities for economic participation in both formal and informal sectors, thereby acting as focal points for population concentration and redistribution (Tumwesigye et al., 2021a).
The rural regions of the Ankole sub-region are predominantly characterized by smallholder farming, with about 96% of households relying on subsistence agriculture and agri-businesses for their livelihoods (MAAIF, 2020). Crop cultivation, particularly bananas and coffee, is prevalent across all districts, except in Kiruhura district, which is primarily focused on livestock farming. Some households in Bushenyi and Buhweju districts are also engaged in estate tea cultivation. The high population density in rural areas, along with the cultural practice of partitioning family land for inheritance, has led to a decrease in farmland per capita, dropping from 0.21 hectares per person in 2010 to 0.15 hectares per person in 2020 in the Ankole sub-region (MAAIF, 2020). As a result, most households possess small plots of land that are insufficient to sustain their agricultural livelihoods (Food and Agriculture Organization of the United Nations, 2017). This situation has prompted out-migration, as some household members leave their rural homes to seek opportunities in urban centres, aiming to diversify their income sources and reduce financial risk (Tumwesigye et al., 2021b).
The only available record on internal movement of people in Uganda is from the 2014 National Population Household Census (NPHC) (UBOS, 2016; also Figure 1), which reports that the Central, Bunyoro and Ankole sub-regions had the highest flux of both in- and out-migrants for the period 2002 to 2014 (refer to the size of migration flow in Figure 1). For instance 11% of the enumerated internal migrants originated from the Ankole sub-region (UBOS, 2016). The migration, particularly of the youths from rural areas in Uganda is expected to persist in the future, owing to the social and economic disparities between rural and urban settings (IOM, 2020). However, hitherto, to our knowledge, there are at present no predictions on the rural out-migration flow rates of the Ankole sub-region. Based on its social and economic diversity and the rapid urbanisation taking place in the Ankole, we take the sub-region as a case and predict rural out-migratory flows in western Uganda.
Materials and Methods
Data: Rural Out-Migration Probabilities
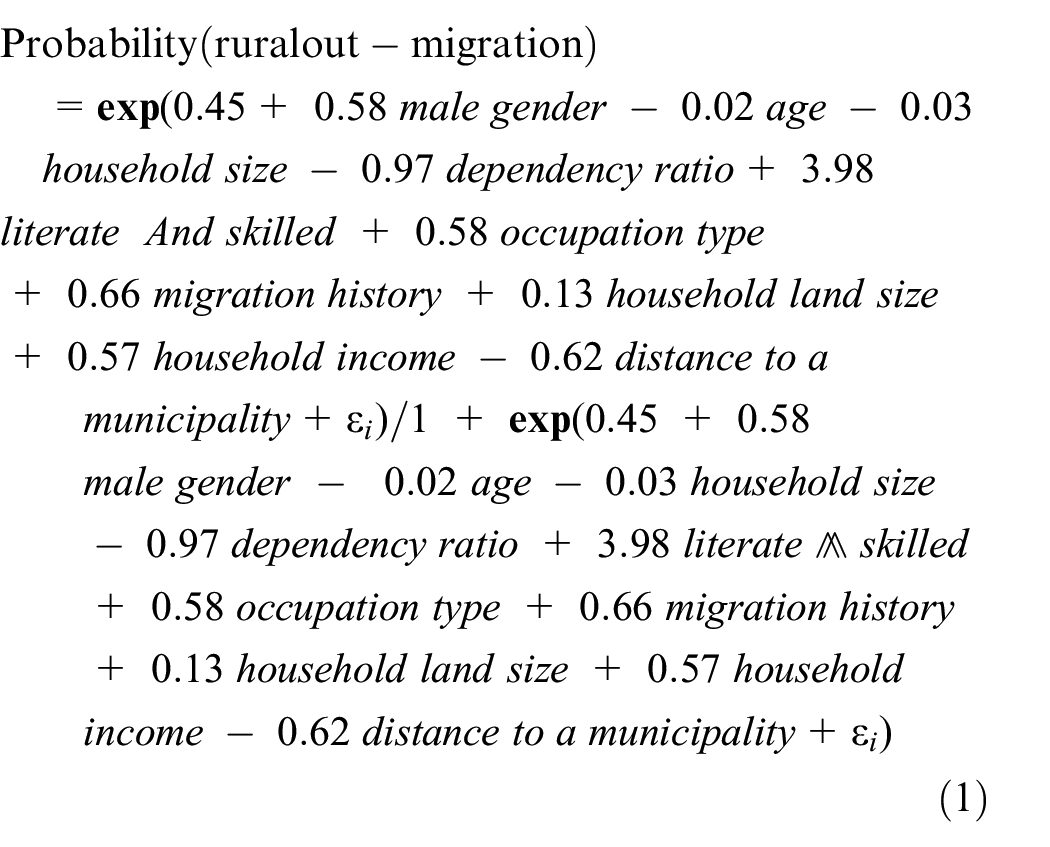
We used primary data on household- and community-level socioeconomic characteristics obtained from household surveys involving 1,015 households (7,612 individual household members) in the 12 districts of the Ankole sub-region. Uganda’s local government is structured in tiers as follows: district (first tier of local government administration, planning and implementation of government’s development programs), which is constituted by counties and municipal councils. The county and municipal council is constituted by sub-county and town councils (second tier of local administration). This is followed by parishes and parish councils (third tier). Parishes are composed of village and ward councils (fourth tier of local government). As such, a district is made up of (sub) counties, which are made up of parishes that are in-turn made up of villages. A sub-county is a collection of, on average, 5 Parishes. The household survey was conducted between February and August 2019. The surveys were conducted in at least 3 randomly sampled Parishes per Sub-county in the study area: a Sub-county is a collection of, on average five Parishes. We surveyed at least three households per Parish. The sample size per Sub-county was proportional to the corresponding number of households based on the recent census data (UBOS, 2016). The determination of total sample size for each Sub-county followed a modified Cochran formula on sampling (Bartlett et al., 2001). We used the survey data to assess the likelihood of out-migration through logistic regression modelling. We used household demographic, social and economic characteristics and the community level biophysical characteristics as predictors for the likelihood of rural out-migration. The fitted logistic regression function (n = 7,612) took the form (Tumwesigye et al., 2021b)
We validated the final fitted logistic model by generating a receiver operating characteristic curve (ROC) and Area Under the Curve (AUC). This was done by applying the fitted final logistic model to the validation sub-dataset (n = 1,520), and generating a receiver operating characteristic (ROC) curve and the area under the ROC curve (AUC) (Figure 3).
Relying on the robustness of the fitted logistic model in estimating the likelihood of out-migration, we used the generated logistic regression coefficients to quantify the probability level of rural out-migration in the study area. Additionally, we obtained the national and the regional statistics on total fertility, birth and mortality rates from the National Bureau of Statistics (UBOS) database. We used this data to calibrate the model for natural population growth and subsequently simulated rural out-migration volumes for the next 30 years (2020–2050).
Prediction Approach – Agent Based Modelling
This study premised its prediction of migration flow on a conceptual understanding that migration can be studied by not only focussing on the individual migrant but also on the migrant’s spatial environment and its social-economic characteristics (Mabogunje, 1970). We also based the prediction on the understanding that the social and economic background which shapes the migration decision may change over space and time. This implies that not only rural out-migration process is dynamic, but also the rural environment within which it takes placeThere are push factors influencing the agent’s decision to migrate that are beyond their control, thereby making migration decision complex. Therefore, we used an Agent Based Modelling (ABM) approach to cater for such dynamism and complexity. ABM typically allows the agents to interact with each other as well as with their environment (Klabunde & Willekens, 2016; Railsback & Grimm, 2012). A household member (the potential out-migrant in this study) is the agent and the household, location community (areas of origin) and the destination areas are constituent elements of the environment within which rural out-migration occurs. We considered that the migration decision for a certain individual is made at household level and is influenced by the household’s social and economic background (Tumwesigye et al., 2021b), even though each out-migrant acts independently. Therefore, the action of migration is ultimately an individual action. Even though, parameterization of our model considered heterogeneous agents depending on the social and economic characteristics of the households. We used these characteristics as predictors in a logistic regression to establish migration levels. The agent’s social and economic background changes overtime and therefore, our modelling approach allows agents to use adaptive behaviour, thereby adjusting their behaviour to the current states of themselves, of other agents and of their environment. A specification of the ABM followed is detailed in the next section. Simulation was done at a sub-county spatial scale and at a 10-year interval so as to align with the period for national census count.
Specification of the Model
Theoretical developments in the fields of migration research draw attention to the multi-causal, dynamism, multiple ecological levels (individuals, households, social networks, migration gateways, corridors, catchment areas), multi-directional and non-linear nature that encompass the migration decision and migration process (McAlpine et al., 2021). These dimensions to understanding migration process guided our model specification. We followed model specification approach advanced by Klabunde and Willekens (2016), who explored the decision-model choices for migration ABMs that span several dimensions – forming agents and expectations, evaluating options, the complexity of migration decision making, and the influencing factors. Our model specification followed 3 steps: creation of agents, simulation of population growth, calibration and simulation of rural out-migration. The model was constructed in Python (version 3.7). The general model framework, components and the schematic flow are illustrated in Figure 2. ABM is continuously recognized by the migration research community and also by public health research community as a complex systems approach that allows exploration of causal complexities inherent to human behaviour and population dynamics (McAlpine et al., 2021).

Components and schematic flow of the agent based model for simulation of rural out-migration in Ankole sub-region, western Uganda.
First, we set up model agents to represent the total population in the sub-region. The agent considered is an individual household member. We structured the agents into age/sex categories using 5-year age intervals (e.g. males/females of 0–4, 5–9, … 65+ years of age). To enable comparison to national statistics, we adhered to the same age categories used by UBOS to present the national age/sex population structure. We then captured/defined the demographic, social and economic attributes of each agent according to their own characteristics as well as the associated social economic characteristics of their natal households and their rural community. These attributes are related to their gender, age, education level, household income and occupation type of the household head.
Second, we simulated demographic changes and population growth using a yearly loop. At the start of every yearly loop, each agent in the model is aged by 1 year. Next, the total population was subjected to natural growth through a combined effect of birth rate and mortality rates. Based on the national database by UBOS 2020 National household survey report (UBOS, 2020), we considered 28 years as mean childbearing age, 5 children per rural woman as total fertility rate, 36.67 births per 1,000 population as crude birth rate, 41.96 deaths per 1,000 live births as child mortality rate, 6.2 death per 1,000 people as death rate and 63.7 years as life expectancy. Every female of child bearing age had a chance of having a child every 3.1 years, up to a total of 5 children. Sex ratio at birth assumes a similar sex ratio of the total population of Uganda at 102 males per 100 females.
Additionally, we catered for formation of new households as a result of marriage between two opposite sex adults (above 18 years). We assumed that at least one of the spouses came from outside the study area, and therefore was a new agent. This assumption also controlled/limited adults marrying from their own households. The in-coming spouse (new agent) would assume the social and economic characteristics of the partner. Every year, a number of households not exceeding 3% of the total households at the start of that year were added per sub-county. This change rate (3%) is the average annual Ankole sub-region’s rate of household change for the period 2014 to 2022 (UBOS, 2020). All in all, we used the national average population growth rate of 3.2% as the maximum threshold for annual population change. This meant that the sum of new agents added would not exceed 3.2% of the starting population for every year of prediction.
Third, we simulated rural out-migration volumes. The out-migration decision was based on the probability function obtained from logistic regression modelling (Equation 1) of household survey data on the demographic, social and economic characteristics of the agent, the agent’s household and their community. The generated logistic regression coefficient (Equation 1) was calculated for each agent to represent their probability to migrate for each simulated year. The rule for out-migration followed a probabilistic approach (Biondo et al., 2013), where rural out-migration was triggered once the output probability to migrate exceeded a threshold value. We set the threshold value at 0.45: the out-migration probability level when all the considered predictors of out-migration in the logistic regression function (Equation 1) are held constant. Therefore, an individual agent independently migrated with the chance of doing so proportional to the adequate age (above 18 years) and the probability level defined by Equation 1.
Typically, migration decision is influenced by the agent’s social economic characteristics, exogenous factors and their interaction effect. The choice of our predictors of rural out-migration was informed by literature on behavioural models of migration presented by Klabunde and Willekens (2016). The Predictors of rural out-migration in the simulation model included the agent’s gender, age, education level, occupation type, household size, household income, land size, migration experience within agent’s household, dependency ratio and distance to nearest municipality or city (refer to Table 1). While calibrating the model, we considered that agent’s social and economic status can improve and thus increase the probability to out-migrate in future. To accommodate for potential status changes in the out-migration predictors, we adjusted the share of individual agents with the potentially changing attributes: for example, the attribute education level, we changed the share of individual agents with each of the education category at every 10 years. The percentage shares were generated from the series of UBOS household survey data. We generated rural out-migration volumes for each sub-county in the Ankole sub-region and presented this on a population pyramid. We took an assumption that a household member moves away (migrates) alone, without any dependent children. We took this assumption so as not to contradict the government policy on Universal primary and secondary education, and its implementation where all children of school going age: 3 to 12 years for primary and 13 to 18 years for secondary must enrol and be schooling.
Description of Selected Parameters Used in Specification of the Model to Simulate Rural Out-Migration.

Results
Validation of the Models
Performance evaluation of the fitted logistic regression that we integrated into the agent based model for simulation of rural out-migration volumes resulted in a receiver operating characteristic curve with AUC of 0.88 (Figure 3). This AUC approached 1, indicating that the logistic regression was a well-fitted model with overall robust estimation power for rural out-migration.

ROC curve and AUC for the logistic regression model for estimating the likelihood of rural out-migration in the Ankole sub-region (n = 1,520).
The starting pool of agents consisted of 3.4 million people forming the total population in the Ankole sub-region in 2020 (Uganda Bureau of Statistics, 2021). This population consisted of 52% male and 48% female. The proportion share in each of the age categories and per gender are shown on Figure 4a. As depicted by the broad-based pyramid (Figure 4), people in the younger age categories (less than 18 years) make up a relatively large proportion (56%) of the population. Comparison of the pyramids (Figure 4): one on the left, which represents the population age structure of Ankole sub-region according to UBOS population figures in 2020 (Figure 4a) and the other on the right, which is from the modelled population at the start year (2020) of our simulation after model calibration (Figure 4b), does not show any discrepancy, thus validating our model calibration.

Population pyramid of Ankole’s population in 2020: constructed from (a) UBOS demographic data and (b) Agent-based calibrated model at the start of out-migration simulation.
Simulated Rural Out-Migration Volumes
Using an ABM approach, we simulated migration flows for the Ankole sub-region in Uganda based on various social and economic attributes. Currently (in 2022), about 1,200 individuals migrate away from rural areas in Ankole each year. Simulated out-migration volumes show an increasing trend for the decades 2020 to 2040. Rural out-migration flow peaks around 2040 at approximately 2,000 out-migrants, and then declines steadily for the next decade (2040–2050) towards 1,100 yearly out-migrants (Figure 5). This simulated trend in rural out-migration ultimately impacts the pyramid structure of Ankole’s rural population.

Simulated annual out-migrants per year from the rural Ankole sub-region for three decades (2020–2050).
Figure 6 shows three population pyramids produced from the 10-year interval simulation of rural out-migration in the Ankole sub-region. Generally, the population pyramids remain broad-based for the three decades. However, we do predict a decline (about 6%) in the proportion of the population in the younger age groups (<19 years) during the two decades 2030 to 2050 (Figure 6b and c). The indentation in the profile of the population pyramids for the middle age structures (between 20 and 54 years) (Figure 6) reflects demographic changes in the rural population due to out-migration. Most of the simulated out-migrants shall be between 20 and 49 years old, and shall constitute more males (about 1.5%) than females. Furthermore, the pyramids show development of an ageing rural population. The proportion of population of the older age groups (above 55) steadily increases (about 6.8%) in the next 30 years, since 2020. These age groups will increasingly have more females (59%) than males (41%). Generally, the structure and sides of the population pyramids starts to become more like a barrel with tailing-off of the population as it ages.

Population pyramids of the simulated rural Ankole population for the decades (a) 2020 to 2030; (b) 2020 to 2040; (c) 2020 to 2050 and the corresponding out-migrants catchment areas showing out-migration intensity at a sub-county spatial scale.
Spatially, the simulated rural out-migrants will mostly come from sub-counties (catchment areas) that are locate close to the major towns in Ankole sub-region and that have good road networks (Figure 6). These catchment areas for the out-migrants include the sub-counties hosting the fast growing four municipalities in Ankole sub-region: namely the Ibanda, Sheema, Bushenyi-Ishaka and Ntungamo municipalities (Figure 6). The volume of out-migrants from the very remote sub-counties (rural areas located far from the major towns) is simulated to remain relatively low for the decades 2020 to 2040. Thereafter the volume of out-migrants from most of these sub-counties will increase to at least 250 out-migrants for the decade 2040 to 2050.
Discussion
The simulated increasing volumes of out-migrants in the Ankole sub-region can be explained by the catalytic effect of the prevailing rural-urban divide and the inequality of provision of and access to basic social and welfare services. Relative to the rural areas, Ankole’s urban centres continue to offer better social and welfare services (education, health, access to clean water and electricity), (potential) business and employment opportunities and higher wages (Tumwesigye et al., 2021a). Therefore, they will continue to act as attraction poles for population concentration and distribution. Rural out-migrants are predicted to come from sub-counties that are located close and connected with a good road network to the regional city (Mbarara city) and the fast-growing municipality towns: namely Ibanda-Igorora in the north, Sheema and Ishaka-Bushenyi in the west and Ntungamo and Isingiro in the south. These municipalities are already targeted for fast track development into district level commercial hubs for trade and business, as well as centres for provision of welfare and social services. They are earmarked investments towards their infrastructural (including road networks) development plans in line to Uganda vision 2040 (National Planning Authority, 2020). They will therefore, continue growing and attracting rural out-migrants. The present rural-urban divide may continue to present the Ankole urban areas as preferred destinations for rural out-migrants even in the coming decades. Indeed, the population in Ankole is steadily transitioning into an urban society with secondary towns rapidly expanding in both population size and area coverage (MoFPED, 2018). Our modelling output indicates that Mbarara city, Sheema, Ntugamo and Ibanda Municipality towns will host most of the rural out-migrants.
The possible explanation of the decline in out-migrants volumes after the year 2045 could be that rural population by then may be largely composed of the elderly and the young, with small pool of potential out-migrants given the high volumes of out-migration flows predicted in the decades of 2020 to 2040. Another explanation could be that social and welfare services in the rural area that are related to access to education, health and employment opportunities could have improved by then, attributed to government’s implementation efforts of its 2040 vision including programs for rural development such as Operation Wealth Creation and Parish Development Model implementation, which are focussing on rural transformation through agro-industrialization and improved social service delivery.
The indentation in the profile of the population pyramids for the middle age (Figure 6) is due to out-migration flow from the rural areas. Rural out-migrants preferably end up in the secondary towns in the study area thereby contributing to the rapidly expanding urban structure in Ankole (Tumwesigye et al., 2021a; UBOS, 2020). The development of an ageing rural population in Ankole sub-region can be explained by the increasing life expectancy in Uganda, where regular life expectancy at 60 years of age in 2020 stood at an average of 16 years (Ministry of Gender Labour and Social Development [MGLSD], 2020). By 2050, the number of persons aged 60 years and above is projected to be about 5.2% and 6% of total Ankole sub-region and Ugandan population respectively, of which 90% will be in rural areas (MGLSD, 2020). Generally, the transitioning of Ankole’s rural population pyramid towards one with fairly straight sides, though still broad-based, shows a population with a falling birth rate and a rising life expectancy.
Out-migration and changes in age structure of the Ankole population present consequences on land-based livelihoods in the rural out-migrants catchment areas. Continued rural out-migration, particularly of the rural youth – a young and energetic workforce – could result in a shortage of agricultural labour and cause a decrease of employment and youth participation in the primary sector of Uganda’s economy, which can contribute to a decrease in agricultural production. The draining away of productive human resource from the rural areas could negatively affect farm productivity (Gollin, 2016), as the management of agricultural production increasingly depends on the ageing population. The youth have a relatively greater capacity to apply innovative farming and production practices (Food and Agriculture Organization of the United Nations, 2020); thus, their migration would make their households lose a vital and dynamic share of their workforce. This could affect the livelihood means of over 96% of the rural households in western Uganda that mainly depend on subsistence farming and land-based livelihoods (MAAIF, 2020).
Rural out-migration also has consequences on rural land use in the out-migrant catchment areas. Potentially, areas with a high population density would have increased demand on the use of land for food production, settlement and development into other land uses (Putri et al., 2018). Therefore, a declining population of a catchment area, for instance through out-migration is expected to result in reduced pressure on the land. However, for the Ankole sub-region, Tumwesigye et al. (in review) revealed that rural areas with relatively high levels of out-migrants underwent strong intensification of land use with conversion of natural land covers to plantation forests, agricultural land and built-up land for the period 2000 to 2021. Therefore, continued out-migration will sustain land use change intensification and the associated natural land cover loss in the rural out-migrant catchment areas. The implication is that these out-migrants catchment areas are likely to continue experiencing reduced provisioning of the economic, environmental and ecosystem services and goods from natural forests and wetlands. Loss of ecosystem services will consequently affect the natural resources-based rural livelihoods.
Our study findings elucidate the implications of demographic transition for rural development in Uganda. Population dynamics and sustainable rural development are strongly linked and present mutual reciprocative effect (United Nations Population Fund, 2011). Often, policy and practice has pointed to population growth and population pressure thereof as key drivers for sustainable social and economic development (Dyson, 2011), and as key issue for the achievement of sustainable development goals in most developing countries (IOM, 2020), Uganda inclusive. As one of today’s development challenges relate to population pressures, the study findings offer a good understanding of the relationship between demography and rural development in Uganda.
Conclusion
This study focused on predicting rural out-migration from rural locations (sub-counties) in the Ankole sub-region of Uganda, using data that is publicly available from UBOS as well as data collected through household surveys. We followed an agent-based modelling approach that enabled us to have an understanding of where (across rural sub-county), when (across time, as the country continues to urbanise) and for whom (across the rural demographic structure) in relation to future out-migration. Our agent-based model was useful to predict rural out-migration and can be replicated in other regions, provided there are right circumstances for surveying households, and there is availability of census data and demography statistics. Our study approach speaks to the often concerns of rural development policy makers and practitioners for the need to generate evidence on future migration patterns and trajectories, especially on internal rural to urban migration in the developing countries, while considering the complexity within which migration decision and rural out-migration take place.
The predicted continued rural out-migration and changes in the demographic structure, particularly of the rural youth, will most likely result in a shortage of agricultural labour. Such a shortage would exacerbate the already declining agricultural production and productivity (MAAIF, 2020), since the management of agricultural production will increasingly depend on the ageing population. Therefore, Uganda’s agricultural sector would lose its advantage as an engine for rural development and its potential function of supporting agro-based livelihoods for the 96% of the rural households that entirely depend on the sector as their means of livelihood (MAAIF, 2020). Continued decline in agricultural production and productivity may impact food availability and therefore contribute to food insecurity for both rural households that mainly rely on own food production and households in the urban areas that rely on food produced and distributed from the rural areas. Furthermore, the predicted rural out-migration will likely continue contributing to land use intensification with loss in natural land cover. The results of this study, particularly on the predicted rural out-migration volumes and their catchment areas provide important evidence to support effective planning and management of rural development amidst the rapid urban transition taking place in Uganda. The results also highlight the spatial scale – the out-migrant catchment areas, where targeted rural development policy decisions on sustainable land use planning and natural resources management could be implemented.
Footnotes
Acknowledgements
The project aims at strengthening the research and education capacity at the latter educational institution. The authors are therefore grateful to VLIR-UOS for the financial support. The authors are also thankful to all households that participated in the survey.
Authors Guarantee Declaration
All authors of this manuscript have contributed sufficiently to the work submitted, starting from framing of the study objectives, to framing of research question, to modelling, to model out-put interpretation, to reviewing of the manuscript, and the content of this manuscript has never been previously published and nor is currently submitted in any other Journal.
Funding
The authors disclosed receipt of the following financial support for the research, authorship and/or publication of this article: This study is conducted under a VLIR-UOS (Vlaamse Interuniversitaire Raad-Universitaire Ontwikkelings Samenwerking [Flemish Inter-universities Council-University Development Co-operation]) funded TEAM project between KU Leuven and Mbarara University of Science and Technology in Uganda.
Declaration of Conflicting Interests
The authors declared no potential conflicts of interest with respect to the research, authorship and/or publication of this article.
Data Availability Statement
Data sharing not applicable to this article as no datasets were generated or analysed during the current study.