
Abstract
In anticipatory socialization, individuals adopt norms and behaviors of reference groups before transitioning into them. We hypothesized that non-tattooed students who desired a tattoo (1,364 “wannabes”) would report attitudes and behaviors between those of students who already had tattoos (429 tattooed) and respondents who neither had a tattoo nor wanted one (816 resistant students) in Grades 7 to 12 in an entire school district in Colorado. Tattooed respondents reported the lowest school attitudes and educational aspirations, and the most weapons possession, substance use, and delinquent behaviors. Resistant students reported the most prosocial attitudes and behaviors. Consistent with anticipatory socialization toward a more antisocial, tattooed reference group, wannabes reported attitudes and behaviors between resistant and tattooed students. A majority of respondents want a tattoo, so we recommend that school health curricula address health and stigma issues associated with tattoos.
Anticipatory socialization refers to the process in which individuals become more like their reference groups even before actually joining them. While a peer group is one to which an individual actually belongs, a reference group is used by an individual to evaluate the relative worth of their appearance, thoughts, feelings, and behavior (Johnson, 1995, p. 28). Merton (1957) developed the concept of anticipatory socialization to explain one’s adaptation to new norms, that is, changes in expectations for behavior that are held by the reference group. Generally, anticipatory socialization has been described as a positive process in the maturation of youth such as adapting to middle or junior high school after elementary school (Waerdahl, 2005) or socialization to work in late adolescence (Hoffner, Levine, & Toohey, 2008; Levine & Hoffner, 2006).
However, anticipatory socialization can have a negative side. The term wannabe is slang for “want to be.” A wannabe has the ambition to become someone that they are not, “a person who tries to be like someone else or to fit in with a particular group of people” (Oxford Dictionaries, 2012). Dukes, Martinez, and Stein (1997) found that “wannabe” gang members were partway between gang members and confirmed non-members in delinquency, fear of harm, and being armed. In addition, the wannabes fell between the two other groups in self-esteem, perceived academic ability, psychosocial health, and bonds with institutions. These findings were consistent with the notion that the wannabes were transitioning into a set of deviant behaviors.
In this study, we conceptualize the desire for a tattoo as part of a process of anticipatory socialization. Despite numerous studies on tattoos in scholarly journals, no U.S. study examines the correlates of wanting a tattoo on outcome variables that are of importance in adolescent social development and bonding to societal institutions. Of note is a recent study by Ekinci et al. (2012) of Turkish youth. The authors found that respondents who said, “I feel close to tattooing/I want to have a tattoo in the future” used more alcohol and drugs, were more delinquent, and had less academic achievement and less psychosocial health than non-tattooed respondents, but they had more positive scores on these outcomes than tattooed respondents.
Getting a tattoo is a risk-taking activity that has potential medical, physical, and social implications (Vanston & Scott 2008). The prevailing literature has defined tattoos as deviant, a “set of complementary group practices coalescing around a shared set of outsider ideologies, activities and representational preferences” (Atkinson, 2004, p. 128). Tattoos and their correlation with deviant behavior among adolescents can be explained by deviant labels (Becker, 1973) and by a general lack of bonding with institutions in society (Gottfredson & Hirschi, 1990; Hirschi, 1969). In the application of deviant labels, society can separate itself from an adolescent, and the youth may, in turn, behave in a way that is consistent with the label (Becker, 1973). In bonding theory, when adolescents are not connected strongly to institutions such as family and school, this lack of attachment can lead to deviant behavior. In particular, the traditional outsider status of persons with tattoos reinforces this interpretation (Atkinson, 2004; MacCormack, 2006), and it provides an opportunity for us to assess the extent to which anticipatory socialization may be occurring among adolescent respondents who report a desire for a tattoo but do not have one yet.
Negative effects of having a tattoo include social stigma and discrimination (Goffman, 1963; Vanston & Scott, 2008). Intolerance of persons with visible tattoos remains prevalent in the workplace (Benton & DeRosa, 2002) and in the society at large (John Roberts, 2012); however, tattoos as art may be protected by the First Amendment (Porter, 2012). Many Americans who do not have tattoos regard persons with tattoos as more rebellious (57%), less attractive (42%), less sexy (36%), and less intelligent (31%; Sever, 2003). Women with tattoos have been stereotyped as heavy drinkers, promiscuous, and unattractive (Vanston & Scott, 2008).
Negative views of tattooed persons may be related to correlates of tattoos that include many harmful behaviors, such as increased drinking (Brooks, Woods, Knight, & Shrier, 2003; Deschesnes, Fines, & Demers, 2006; Guéguen, 2012, Koch, Roberts, Armstrong, & Owen, 2010), drug use (Adams, 2009; Deschesnes et al., 2006; Dukes & Stein, 2011; Koch et al., 2010; Roberts & Ryan, 2002;), school truancy (Deschesnes et al., 2006; Roberts & Ryan, 2002), earlier sexual activity (Nowosielski, Sipinski, Kuczerawy, Kozlowska-Rup, & Skrzyplec-Plinta, 2012), multiple sex partners (Koch et al., 2010), delinquency (Deschesnes et al., 2006; Dukes & Stein, 2011; Roberts & Ryan, 2002), gang membership (Deschesnes et al., 2006; Roberts & Ryan, 2002), weapon carrying (Dukes & Stein, 2011; Thurnherr, Michaud, Berchtold, Akré, & Suris, 2009), violent behavior (Vanston & Scott, 2008), arrest (Koch et al., 2010), and time spent in jail (Adams, 2009). Correlates also involve decreased psychosocial health (Nathanson, Paulhus, & Williams, 2006; Roberti & Storch, 2005), increased sensation seeking and risk taking (Swami, 2012), eating disorders (Preti et al., 2006), increased self-cutting (Stirn & Hinz, 2008), and even suicide (Vanston & Scott, 2008). Despite the negative correlates of tattoos, many tattooed adolescents tend to regard their tattoos as body art and as expressions of their identity. The tension between the research on negative correlates of tattoos and the positive meaning that is expressed by tattooed adolescents and young adults does not seem to be reflected in societal definitions, since tattoos still are defined as at least mildly deviant, a situation that led John Roberts (2012) to declare that society has sent a mixed message about tattoos and currently they are “suspended in cultural limbo” (John Roberts, 2012, p. 156).
Nonetheless, tattoos have become common and popular (Manuel & Sheehan, 2007) especially among young adults (Vanston & Scott, 2008). In national samples, 36% of respondents in their 20s and 30s were tattooed compared with 15% of respondents in their 40s and 50s (Laumann & Derick, 2006; Sever, 2003). Between 8% and 13% of adolescents aged 12 to 18 are estimated to have a tattoo (Carroll, Riffenburgh, Roberts, & Myhre, 2002; Silver, VanEseltine, & Silver, 2009). Along with the popularity of tattoos has come regulation that applies especially to young people. Laws have been enacted in more than 90% of the states that limit legal tattooing to adolescents more than 18 years unless parental consent has been given (AAA Tattoo Directory, 2010).
Hypotheses
Adolescent wannabes represent a unique opportunity to examine how tattoos relate to ongoing personal development, including possibly shifting into deviant behaviors. The study of wannabes is of potential importance because these adolescents would like to get a tattoo, but they have not yet acquired one. We expect wannabes to be more involved in deviance than adolescents who do not want a tattoo because, if anticipatory socialization is involved, wannabes will identify with tattooed persons (Ekinci et al., 2012; Silver et al., 2009), and if wannabes are less involved in deviance currently than respondents who already are tattooed, then this finding would be evidence for possible transitions to further involvement in deviant behavior based on their emulation of a deviant reference group (Adams, 2009; Benton & DeRosa, 2002).
The purpose of this article is to examine substantive differences among adolescent respondents who are tattooed (tattooed), those who do not have tattoos but want them (wannabes), and those who do not have tattoos, and do not want any (resistants). We hypothesize that a desire for tattoos before actually getting them is heralding a transition toward a wider range of more antisocial, deviant behaviors through a process of anticipatory socialization whereby adolescents mimic the behaviors of tattooed persons whom they perceive as their reference group. As such, desiring a tattoo may be a symptom of the negative aspect of anticipatory socialization, a behavior that generally is perceived as a normative, positive one. These individuals may be identifying with a deviant subculture and anticipating membership in it. In addition, we hypothesize that the adolescents who report that they do not want tattoos will demonstrate more socially positive attitudes and behaviors that are more reflective of the mainstream adult culture to which they are oriented (e.g., positive anticipatory socialization). Furthermore, we hypothesize that adolescents who already have tattoos will report the most deviant, antisocial behaviors. We hypothesize that the wannabes will fall between those who already have tattoos and those who do not want tattoos. Our analyses will take three important demographic variables into account.
Age
As adolescents get older, it makes sense that more of them have acquired tattoos (Brooks et al., 2003; Mayers, Judelson, Moriarity, & Rundell, 2002; Sever, 2003). To avoid capitalizing on differences among the three groups that could be confounded with maturation or age rather than associated with substantive attitudinal and behavioral variables, we report analyses within the junior high group and within the senior high school group in addition to the entire adolescent sample.
Gender
The same percentage of both genders report tattoos (Horne, Knox, Zusman, & Zusman, 2007). However, adolescent girls usually have more positive school attitudes and greater educational aspirations (Dukes & Stein, 2003). Boys carry weapons more often, use more substances (not problem substance use, Brooks et al., 2003), and are more delinquent (Dukes & Stein, 2003; Fagan, Van Horn, Hawkins, & Arthur, 2007). Therefore, gender differences are important to examine.
Socioeconomic Standing
Adolescents who come from families that have higher socioeconomic standing and who have been more successful at school report more positive school attitudes and greater educational aspirations (Harvey & Kerin, 1978; Strand & Winston, 2008). Prosocial values increase the tendency to engage in prosocial behaviors (Hardy, Carlo, & Roesch, 2010). Students with higher socioeconomic standing and greater school success also report less weapons possession, less substance use, and less delinquency (Brooks et al., 2003; Bryant, Schulenberg, O’Malley, Bachman, & Johnston, 2007). The educational attainment of parents often is used as an approximate measure of socioeconomic standing, and we use it this way in the current study (Nesbit, 2006). We expect greater parent education to be associated with fewer tattoos (Laumann & Derick, 2006), more positive school attitudes, greater educational aspirations (Harvey & Kerin, 1978), less weapons possession, less substance use, and less delinquency (Gottfredson & Hirschi, 1990; Hirschi, 1969).
To summarize, we hypothesize that wannabes will demonstrate attitudes and behaviors that are consistent with anticipatory socialization to a reference group that is characterized by greater deviant behaviors; therefore, they will fall between the resistant respondents and the tattooed respondents on attitudes toward school, educational aspirations, weapons possession, substance use, and delinquent behaviors. We further hypothesize that age, gender, and parent education will affect both tattoos and the outcome variables stated above.
Method
Participants
All students from the four middle schools and two high schools in a suburban school district in Colorado Springs, Colorado, were eligible to participate in the Youth Life Style Survey that was administered in April, 2007. A total of 2,704 students participated, and the response rate was 76%. Reasons for nonparticipation include absence from class during the testing session, moving or dropping out of school after the school census date (but before testing), refusals by parents prior to the time of the survey (see below), and refusals by students at the time of administration (also see below).
The population comprised 2,704 students, and we analyzed data on 2,609 cases for which complete data were available for all variables in the analyses. Twenty-one percent of the final sample were White, 17% were African American, 30% were Hispanic, 24% described themselves as mixed ethnicity, nearly 6% were Asian, and 2% were Native Americans; 49% of the sample was female. The mean age was 14.7 years, and the median age was 15. Twenty percent of the sample reported that their parents had less than a high school education, 27% of the parents were high school graduates, 24% of the parents had attended college or a trade school, and more than 29% were college graduates or had advanced degrees.
Instrument and Procedures
Anonymous responses to a 112-item questionnaire were recorded on a machine-scored form. Items selected for these analyses are described below and in Table 2. Respondents completed the survey in an average time of 25 min. School administrators informed parents about the survey in March 2007, and invited parents to view the instrument. Parents had the option to request that their children not participate in the survey. Copies of the questionnaire were posted in each school building. Refusals by parents were less than 5%. Written instructions were printed on the envelope for each classroom, and they requested that a student in each classroom collect completed surveys and seal them in the envelope for delivery to the central office of the school. School personnel sent the envelopes to the district office for transmittal to the researchers. On the instrument, written instructions promised anonymity to the student participants and invited them to decline to answer any items to which they objected or to which they felt their parents might object. The research was approved by several research oversight councils within the school district, and it was approved by the Institutional Review Board at the University of Colorado, Colorado Springs.
Measures
Except for demographic variables, all comparisons were made among multi-item latent variables. These variables were formed from the items that are described below, and they are summarized on Table 2.
Demographics
Age in years, gender (1 = male, 2 = female), and education level of the parent who went to school longer were measured and included in the models. Education level of parent who went to school longer was measured using the following response categories: 1 = grade school or less, 2 = some high school, 3 = high school graduate, 4 = some college or trade school, 5 = college graduate, 6 = graduate school. A preliminary analysis revealed that ethnicity was not associated with tattoos, so it was not used in the analyses below.
Tattoos
To classify the participants into one of three categories, the item about tattoos asked, “Do you have any tattoos?” Responses were recorded using a 5-point response scale: 1 = No, and I don’t want any; 2 = No, but I’d like to; 3 = Yes, but I wish I didn’t; 4 = Yes, and I’m satisfied; 5 = Yes, and I want more. We divided the population into resistant respondents who stated that they did not have any tattoos and did not want any (N = 816, 31.2%), respondents who wanted a tattoo but did not have any (wannabes, N = 1,364, 52.3%), and respondents who had tattoos (tattooed, N = 429, 16.4%).
Self-Esteem
Self-esteem was measured by the five positively worded items from the Rosenberg Self-Esteem Scale (1965; used with permission). One typical item stated, “I am satisfied with myself.” Responses were recorded using 5-point response scales that were anchored by strongly disagree (1) and strongly agree (5). Coefficient α = .84 for the five items.
School Attitudes
Three items were used to indicate a latent variable that represented the attitudes of respondents toward school. The first two items stated, “I enjoy going to school” and “I do not care how I do in school” (reverse-scored). Answers to these items were recorded on a Likert-type response scale identical to those for self-esteem. The third item was grade point average (GPA). It asked, “What was your average grade on your last report card?” Response categories were 5 = mostly As, 4 = mostly Bs, 3 = mostly Cs, 2 = mostly Ds, and 1 = mostly Fs. Coefficient alpha for the three items = .46.
Educational Aspirations
This latent variable was represented by three items: The first item asked, “How much education would you like to complete?” Responses were recorded using the following six categories: grade school or less (1), some high school (2), high school graduate (3), some college or trade school (4), college graduate (5), or graduate school (doctor, lawyer, PhD; 6). The second and third items came from the Self-Confidence of Academic Ability Scale (Brookover, Beady, Flood, Schweitzer, & Wisenbaker, 1979). The second item asked, “Do you think you could finish college?” The third item asked, “If you want to be a doctor or a teacher, you need more than four years of college. Do you think you could do that?” Both of these items used the following five response categories: no, for sure (1); no, probably not (2); maybe (3); yes, probably (4); and yes, for sure (5). Coefficient alpha for the three items = .73.
Weapons Possession
This latent variable was indicated by two sets of composite scores. The first composite score was the mean response to four items from Brener et al. (2004), all of which began with the stem, “During the last month, how often have you carried a gun for self-defense?” Individual items said, “At school, at school sponsored activities, while out with friends, or at other times.” Responses to these four items were recorded using the following five categories: never (1), once (2), twice (3), 3-4 times (4), 5 or more times (5). Coefficient alpha for the four items = .87. The second composite score was the mean response to four items from Brener et al. (2004), all of which began with the stem, “During the last month how often have you carried a knife, club, or similar weapon for self-defense?” Responses to these four items were recorded on response scales identical to the items on the carrying of a gun. Coefficient alpha for the four items = .90.
Substance Use
This latent variable was indicated by three sets of measured variables. All items began with a stem that said, “Indicate your use of the following”: The first item said, “Marijuana.” Responses were recorded using the following seven categories: never tried (1); tried once or twice in the past but quit (2); occasionally, but not during the last month (3); once or twice in the last month (4); 3 to 5 times in the last month (5); 6 to 15 times in the last month (6); and over 15 times in the last month (7). The second variable was a composite measure of alcohol use. It was indicated by the mean use of beer, wine, and liquor. The response scales for these three items were identical to the one for marijuana. The third variable was a composite measure of tobacco use. It was indicated by the mean use of cigarettes, and smokeless tobacco. Other types of drugs were acknowledged infrequently, so they were not included in the latent variable of Substance Use. Coefficient alpha for the six items = .86.
Delinquent Behaviors
This latent variable was indicated by three composite variables, or parcels, each of which was the mean score for the three items. Coefficient alpha for all nine items was .87. Items were combined into parcels at random. All nine items began with the stem that asked, “During the past 12 months how often have you?” Items in the first parcel included, Gotten into a serious physical fight, Taken something from a store without paying for it, and Damaged property for no reason. Items in the second parcel were, Started a fire to damage something, Gone into a house or building when you were not supposed to be there, and Sold an illegal drug. Items in the third parcel were, Gotten into trouble with the police (not including a traffic ticket), Gotten into trouble with school authorities, and Violated curfew. Responses for the nine items were recorded using the same five categories that were used to score responses to the items on weapon carrying (above).
Analysis
We performed latent variable analyses using the EQS structural equations modeling program (Bentler, 2006). Latent variables are hypothesized underlying constructs that explain the shared variance among indicator variables. We evaluated the goodness-of-fit of the models using the maximum-likelihood chi-square statistic, the comparative fit index (CFI), and two robust fit statistics, the Satorra–Bentler χ2 (S-B χ2), and the robust comparative fit index (RCFI). We used the S-B χ2 as an indicator of fit in addition to the maximum-likelihood fit statistics because the data were multivariately kurtose (Bentler, 2006). The CFI and RCFI range from 0 to 1, and they report the improvement in fit of the hypothesized model over a model of complete independence that has been adjusted for sample size. The root mean square error of approximation (RMSEA) is a measure of fit per degrees of freedom, controlling for sample size. RMSEA values of less than .06 indicate a relatively good fit between the hypothesized model and the observed data.
Confirmatory Factor Analyses
Confirmatory factor analyses were performed separately for each of the three groups, tattooed, wannabe, and resistant respondents. These analyses tested the plausibility of the hypothesized measurement model within each group, and they assessed correlations (covariances) among the latent and demographic variables.
Multisample Analyses
We used multisample techniques with successively constrained models to contrast the mean scores of individuals within the three separate groups. First, after assessing a baseline unrestrained model, multiple-group latent variable models tested the equivalence (invariance) of the measurement model among the groups (Byrne, Shavelson, & Muthén, 1989; Stein, Lee, & Jones, 2006). The factor loading of each measured variable on its latent factor was constrained to equality across the three groups. The LaGrange Multiplier test (LM test) reports any constraints that are untenable (Chou & Bentler, 1990). The plausibility of the equality constraints was determined with chi-square difference tests.
Once an invariant factor structure was confirmed, we also assessed whether there were significant group differences in the means of the latent constructs in the model as well as demographic differences. This analysis constrains the item means to equality, and the LM test reports any of these constraints that are not tenable. We observed a relation between grade in school and the tattooed, wannabe, and resistant groups (γ = .22, p < .001). In subsequent analyses, we wanted to ascertain the extent to which age differences were producing the results rather than substantive psychosocial and behavioral differences among the three groups, so we divided the cases into a junior high school group (Grades 7-9, N = 1,545) and a high school group (Grades 10-12; N = 1,064). Comparisons could not be done grade by grade due to inadequate sample sizes at those levels; however, sample sizes were ample for the sub-analyses by junior high and senior high school. The latent means of the two age groups were contrasted using the same model as the one that we used for the entire group.
Results
Confirmatory Factor Analyses
Table 1 presents the results of the confirmatory factor analysis, and all statistics are indicative of well-fitting models. In addition, all hypothesized factor loadings for the three groups were statistically significant (p ≤ .001). No model modifications were necessary in any group. Table 2 presents the factor loadings, means, and standard deviations of the measured variables for each group. Table 3 reports the correlations among all of the latent variables and with the demographic variables by group.
Fit Statistics for Confirmatory Factor Analyses for Tattooed, Wannabe, and Resistant Groups.

Note. ML = Maximum Likelihood; CFI = comparative fit index; RMSEA = root mean square error of approximation; S-B = Satorra–Bentler.
Means, Standard Deviations, and Factor Loadings for Each Group.
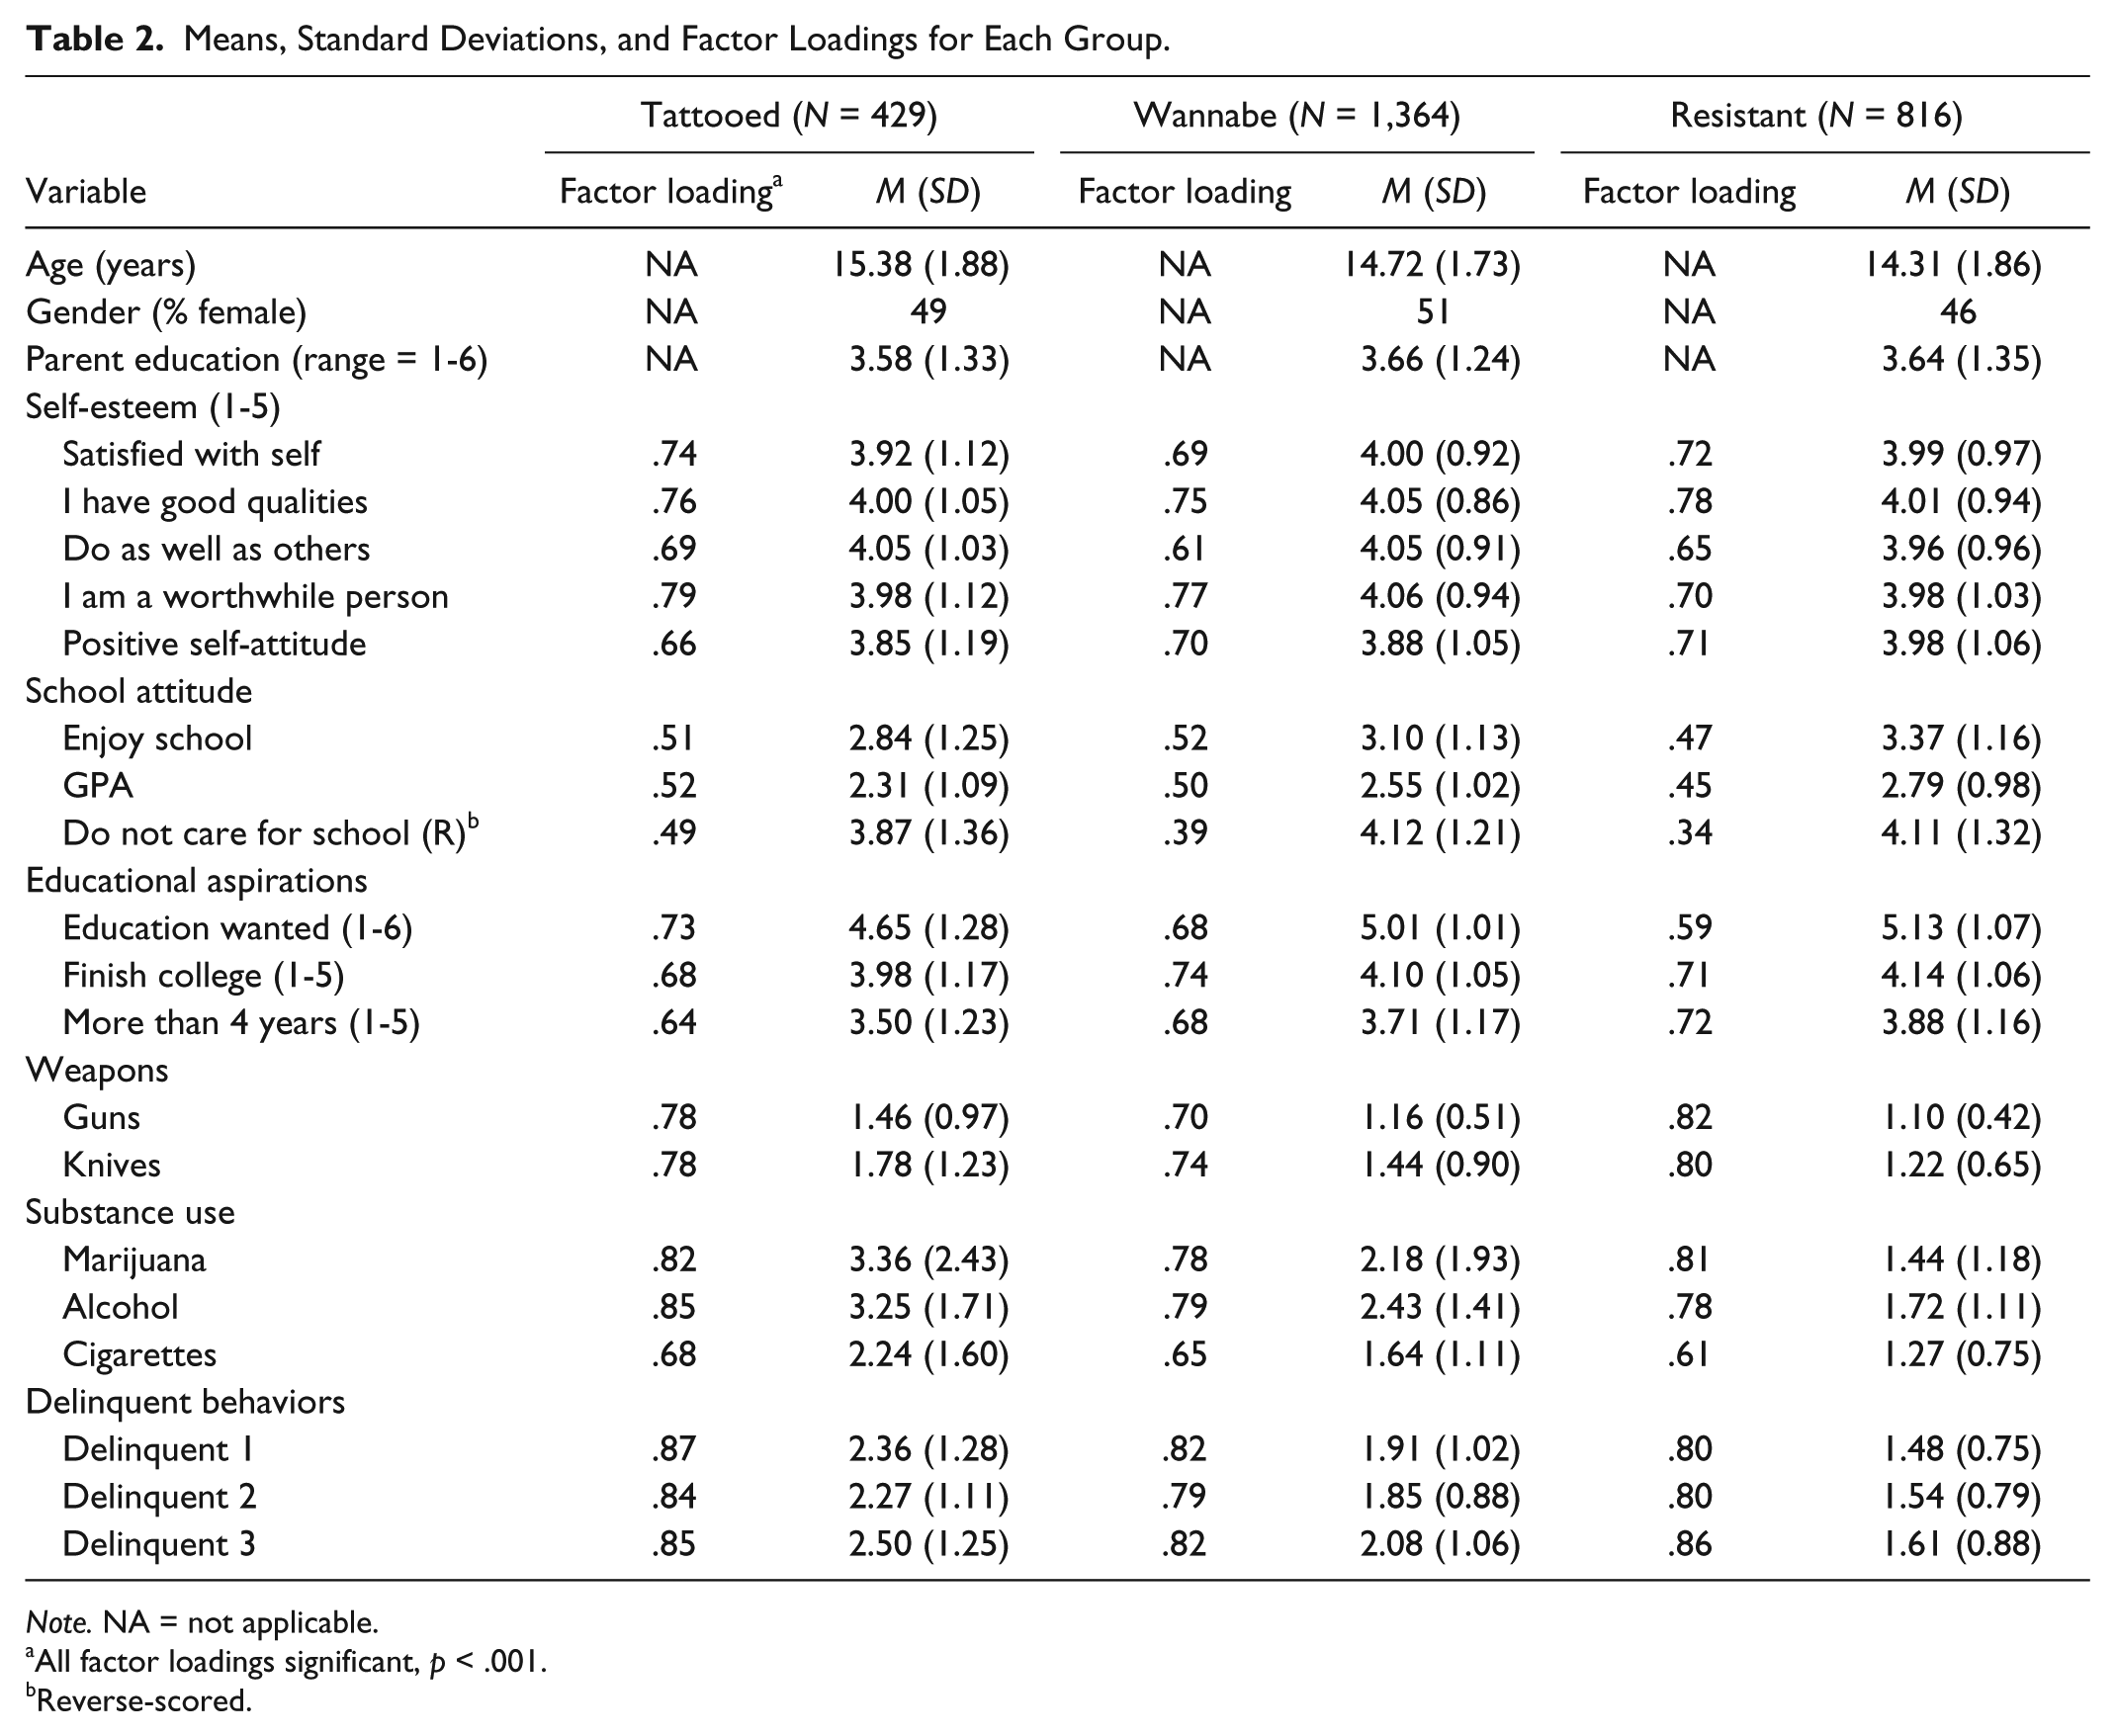
Note. NA = not applicable.
All factor loadings significant, p < .001.
Reverse-scored.
Correlations Among Latent Variables and Demographics by Tattooed, Wannabe, and Resistant Groups.

p < .05. **p < .01. ***p < .001.
Multisample Analyses
Prior to the comparison of latent means, we made sure that the factor structures for the three groups were similar. A three-group model without any constraints provided the baseline for further comparisons. This model had an outstanding fit, but it decreased slightly when we added factorial invariance constraints. Therefore, we dropped the constraint of the factor loading of the first delinquency indicator for wannabe and resistant respondents, and the fit indexes remained excellent. This elimination of 1 constraint out of 26 created a minimal degree of partial measurement invariance in the multisample model, and it did not preclude us from taking the next steps in the analyses, the comparisons of the latent means (Aiken, Stein, & Bentler, 1994; Byrne et al., 1989).
Latent Means Comparisons
Total sample
Table 4 reports the z-scores for the latent means comparisons. As hypothesized, the wannabes fell between the two other groups on all variables; however, we observed no significant differences among any of the groups on parent education or self-esteem. In addition, we found no significant differences in the proportion of females when we compared the tattooed respondents with resistant and the wannabe groups. Respondents in the Wannabe group were more likely than those in the resistant group to be female (p < .05). As expected, tattooed respondents were significantly older than both other groups (p < .001) although the wannabes were closer in age to tattooed respondents than were resistant respondents.
Etas, z-Scores, and Statistical Significance for Three-Group, Single-Item, and Latent Means Comparisons Among Tattooed (N = 429), Wannabe (N = 816), and Resistant Respondents (N = 1,364) by Whole Sample, Junior High, and High School Sub-Groups.

Positive score indicates higher scores for those with tattoos.
Positive score indicates higher scores for those who want tattoos.
p < .05. **p < .01. ***p < .001.
When we compared the tattooed group with the wannabes, the tattooed group had lower School Attitudes and Educational Aspirations (see Table 4, columns 1 and 2), and they reported more Weapons Possession, Substance Use, and Delinquent Behaviors. When we contrasted the wannabes with resistant respondents (see columns 2 and 3), wannabes were significantly older, reported lower Educational Aspirations, lower positive School Attitudes, and greater Weapons Possession, Substance Use, and Delinquency.
Educational Aspirations of wannabes were closer to resistant respondents (−2.69) versus tattooed respondents (−4.26). School Attitudes of wannabes and resistant respondents were essentially the same (−5.23, −5.63). Differences were greater on Weapons Possession (z = 6.66 vs. 5.10), and wannabes were closer to resistant respondents. Differences were substantially higher between the wannabes and resistants on Substance Use (z = 10.15 vs. 13.45), and Delinquency (7.59 vs. 11.90).
Sub-analysis by school setting
Since age could have had an effect on the relation between the three groups and the dependent variables, we compared latent means for junior high and high school separately. On Table 4, separate z-scores appear in parentheses. Despite attenuation of age ranges, results are remarkably the same as they were in the earlier analyses, and most of them are quite substantial, especially for the junior high school group. In some comparisons, the differences in age were non-significant. The only non-significant difference in the substantive variables was a lack of difference in Educational Aspirations and Weapons Possession for the contrast at the high school level between wannabes and resistants.
Discussion
We hypothesized that tattooed respondents would report the most antisocial behavior such as the lowest self-esteem, the least positive attitudes toward school, the lowest educational aspirations, the most weapons possession, the most substance use, and the greatest number of delinquent behaviors. We predicted that resistant adolescents who did not want tattoos would have scores on our outcome variables that were the most prosocial and mainstream, reflecting the values of the wider culture. Using the theory of anticipatory socialization, we predicted that the scores of Wannabes who did not have a tattoo but wanted one would fall between the other two groups.
Our research supported this hypothesized ordering of the three groups, and results support previous research that shows tattoos are correlated with a wide range of negative behavior. In addition, using anticipatory socialization theory, we sought to determine the extent to which wannabes were closer to tattooed than to resistant respondents, and here our results changed depending on which measure we used. Overall, the best interpretation of our findings is that wannabes lie midway between tattooed and resistant respondents. The gravitation toward greater identification with outsider and countercultural behaviors of wannabes versus resistants is unmistakable. It was even clearer at the junior high school stage. More anticipatory socialization may be occurring at that particular developmental time period.
Prosocial Attitudes and Achievement
Anticipatory socialization can explain the intermediate position of wannabes because their reference group is more likely to be tattooed and more antisocial, and these adolescents aspire to become part of a reference group that is characterized by a greater level of deviant behavior. Analogously, we expected that the resistant respondents would be emulating more mainstream reference groups whose values and behavior were oriented more toward conventional society.
As predicted, mean scores for enjoyment of school and GPA were the lowest for tattooed respondents, and they were highest for adolescents who were resistant to the idea of having a tattoo. Wannabes had scores that were in the middle. The distances between wannabes and the other two groups were very similar (Table 2), and on the item of not caring for school, resistant respondents and wannabes were virtually identical, and both groups cared for school more than tattooed respondents. The latent means differences on Positive School Attitudes put wannabes almost exactly between the tattooed and the resistant (Table 4). On educational aspirations, the pattern was the same as for enjoyment of school and GPA. Wannabes were slightly closer to resistant respondents than to the tattooed. The latent means comparison emphasized these same relative distances.
Behaviors
As predicted, for the carrying of both guns and knives, resistant adolescents had the lowest scores. Wannabes were in the middle, and tattooed respondents had the highest scores. For both measures of weapon carrying, wannabes were closer to resistant respondents than they were to tattooed respondents (Table 2), and this pattern was emphasized by the latent means comparisons on Weapons Possession. Again, for substance use, we observed the predicted order for the three groups. The latent means comparison showed that wannabes were closer to the tattooed than to resistant respondents. For delinquent behaviors, we observed the predicted order for the groups. In the latent means analysis of Delinquent Behaviors, the wannabes were closer to tattooed respondents than to resistant respondents.
Our findings that adolescents who have tattoos report more weapons possession, substance use and delinquent behaviors are consistent with prior findings. Together, these findings support the notion that through anticipatory socialization, resistants are moving toward a greater conformity of the adult world, and wannabes are experiencing anticipatory socialization toward a risk-taking subculture that is characterized by a greater number of deviant behaviors. Of interest here is our finding that wannabes are closer to resistant respondents on weapons possession, potentially the most violent of the deviant behaviors that we examined.
Self-Esteem
Although research by Nathanson et al. (2006) found personality characteristics, including self-esteem, influenced both tattoos and misconduct, we found no differences among the three groups on self-esteem. This finding was maintained in the more fine-grained sub-analyses that we conducted with the junior high and high school groups. Thus, self-esteem apparently was neither enhanced nor harmed by one’s tattooing status. This finding suggests that if adolescents are looking for fulfillment or enhancement from tattoos, for some of them, it may be an empty quest. An alternative explanation is that adolescents with more troubles attempt to maintain self-esteem through tattoos.
Age
As expected, tattooed respondents were older than wannabes (0.66 years), and wannabes were older than the resistant respondents (0.41 years; Table 2), and these differences showed that wannabes were somewhat closer to resistant respondents in age than they were to tattooed respondents. We are left with a hint that tattoos are at least partially related to the maturation process, similar to the use of tobacco and alcohol, and this aspect of our findings may be related to state laws that restrict the tattooing of younger persons in a process that is similar to restrictions on the sale and use of tobacco and alcohol.
While age had an important effect on the numbers and percentages of adolescents who were tattooed, wannabe, or resistant, it also might have had an effect on how tattoos were related to the dependent variables. Because of the possible interaction of age and the three groups, it was important to divide the sample into the junior and senior high school groups because the results could have been due in large part to the wide age range across the six grades of our respondents. As reported in Table 4, the z-scores are somewhat attenuated within the narrower age ranges of junior high and senior high, yet the results are remarkably the same, and most of them are quite substantial, especially for the junior high school group. Junior high students may be experiencing the most anticipatory socialization.
In some cases, the differences in age were non-significant lending even more support to the findings regarding the main effect of the tattooed, wannabe, and resistant groups. The only non-significant differences in the substantive variables were observed in educational aspirations and weapons possession for the contrast at the high school level between wannabes and resistants.
Parent Education
Since we observed no statistically significant differences among tattooed, wannabe, and resistant respondents on parental education, we cautiously interpret this lack of a finding as evidence that tattoos are enjoying much broader public acceptance or at the least, social class distinctions are disappearing in part because the middle class is central to current trends (John Roberts, 2012; Kosut, 2006). In the past, tattoos were more prevalent among members of the working class (Manuel & Sheehan, 2007).
Gender
Gender differences did not strongly discriminate members of the three groups, except that in the latent means analysis wannabes were more likely than those who did not want tattoos, to be female (p < .05). These findings are further evidence that wider acceptance of tattoos has a fairly new and strong theme of aspiration by women (Botz-Bornstein, 2013; Horne et al., 2007). Together, findings on demographic variables suggest that for some adolescents tattoos may be emerging as part of a general maturation process.
Future Research
Between one quarter and one third of young adults have at least one tattoo (Mayers et al., 2002; Sever, 2003). Among our respondents, 15.4% already have a tattoo, and 52.8% want one. These findings suggest that as our respondents become young adults a majority of them could have a tattoo; however, as they get older, some wannabes may decide that they do not want a tattoo. Additional prospective longitudinal studies of adolescents (similar to the one by Silver et al., 2009) who were wannabes but who did not get a tattoo could shed further light on the process of anticipatory socialization as it relates to deviance and to success as adults.
Will attitudes toward tattoos become more accepting (John Roberts, 2012; Laumann & Derick, 2006; Vanston & Scott, 2008)? Normatively, tattooed respondents may become the majority; however, some researchers maintain that we are likely to see a concerted effort to maintain the image of tattoos as rebellious, risk taking, and deviant (Adams, 2009; Deschesnes et al., 2006; Manuel & Sheehan, 2007). Because of our finding that a lack of bonding with school may not result in anticipatory socialization toward deviance for wannabes, a comparison of college students who have tattoos and those who do not on academic achievement, deviance, and success could shed light on the process of tattoos and social development as adolescents become young adults. A promising line of inquiry hypothesizes that tattoos are more negative for adolescents than for young adults. Tests of this hypothesis could reconcile conflicting literature that shows tattoos can be part of a process of prosocial and effectively regulated communication and a vehicle for self-consciousness (Atkinson, 2004; Huxley & Grogan, 2005; MacCormack, 2006; Silver et al., 2009) versus findings that tattoos are a correlate of deviant behavior (Nathanson et al., 2006) including substance use (Deschesnes et al., 2006) and violence (Thurnherr et al., 2009; Vanston & Scott, 2008).
Our research suggests that wannabes are a special group of adolescents that may be undergoing anticipatory socialization to a reference group that is characterized by a greater number of deviant behaviors. Because our research is correlational, we do not know if tattoos are the cause of deviant behavior. Therefore, it seems prudent to suggest only that negative side-effects of tattoos such as health risks and stigma become part of general health curricula in schools. As youth become more aware of the potential health risks of tattoos, especially amateur ones, they are less likely to be interested in them.
Limitations
We did not assess the number of tattoos or their location. Recent research has shown that tattoos on hands, neck, or face (Adams, 2009) or at least four tattoos (Koch et al., 2010) are especially indicative of deviant behavior. In addition, we did not assess whether the tattoos were done in a professional studio or whether they were done by an amateur, including the respondent. Differences such as these within the tattooed group can be important, and within our three broad groups, many of these differences were not investigated. We may have overlooked important differences, and we may have applied our group labels too broadly.
We did not investigate the effects of family members of friends having tattoos. We know from a recent study of college students from the same region (Dickson, Dukes, Smith, & Strapko, 2014) that having more tattoos increases positive disposition toward future tattoos (β = .33, p < .001), and so does family having tattoos (β = .16, p < .001) and friends having tattoos (β = .17, p < .01). We also know that family having tattoos (β = −.15, p < .01) and friends having tattoos (β = .25, p < .001) decrease the amount of stigma that respondents express toward tattooed persons. If friends and family of the respondent have tattoos, these persons are a major part of the reference group, and the anticipatory socialization is aimed toward the reference group. If the respondent has more tattoos and/or more visible tattoos, the effect of the anticipatory socialization is stronger, and we would predict greater deviant behavior.
While our 76% response rate was high, we do not know what effect non-response may have had on our results. The fact that our research uses data from a large population of students offers an advantage over a smaller sample; however, both methods would have issues with non-response.
Our respondents were heavily Hispanic and of mixed race and ethnicity, and their proportions in the data matched those of the school district. Therefore, our results may not match those from other studies that have samples characterized by racial and ethnic backgrounds that are different from our respondents. In an effort to assess the impact of race and ethnicity, we examined it as a predictor, a mediator, and a moderator of our six latent dependent variables, and the results were not important enough to be included in the “Results.”
We used a broad array of outcome variables, and as a result, our measures of specific variables may not have been ideal. For instance, we measured self-esteem using 5 of 10 possible items on the Rosenberg self-esteem measure (Rosenberg, 1965), and we used 2 of 10 items from Brookover et al. (1979) due to concerns about the length of our questionnaire and respondent burden. In addition, our measure of School Attitudes showed a low coefficient alpha. We would like to have better items available from the questionnaire, but we do not. Nevertheless, our research shows that for our adolescent respondents, the presence of tattoos is a correlate of a greater number of deviant behaviors, and the desire for a tattoo may signal identification with role models who exhibit these behaviors.
Footnotes
Declaration of Conflicting Interests
The author(s) declared no potential conflicts of interest with respect to the research, authorship, and/or publication of this article.
Funding
The author(s) disclosed receipt of the following financial support for the research and/or authorship of this article: Partial support for this research was provided by school districts in the Pikes Peak region of Colorado, and partial support was provided by a grant from the National Institute on Drug Abuse (DA01070-38).