
Abstract
The shift from cars with a combustion engine to electric cars is a key ingredient in the transition toward a carbon-neutral mobility system. However, this leads to a drastic increase in the demand for renewable electric energy. In this study, we investigate the size and shape of this additional electricity demand. We develop an agent-based model to calculate the overall demand and, more importantly, the distribution throughout the day with a fine temporal resolution in order to identify demand peaks. We also take into account the existing demand for electricity to gain a more complete picture of the load on the entire grid. We find that the demand peaks arising from charging a fully electric fleet are extensive and the most prominent demand peak occurs at the so-called charging rush hour in the early evening. These findings suggest that our current mobility system is in need of drastic changes to make sustainable mobility achievable.
Plain language summary
Moving from cars with gasoline engines to electric cars is an important part of the shift toward a transportation system that doesn’t harm the environment. However, this change results in a significant increase in the need for renewable electric power. In this study, we examine how much additional electricity is required and when it is needed. We create a computer model that calculates the overall demand for electricity, including the distribution of demand throughout the day with precise time intervals. This helps us identify the times when the demand for electricity is highest. We also consider the existing electricity demand to get a complete understanding of the strain on the entire power grid. Our research shows that the peak demand for electricity caused by charging a fleet of fully electric vehicles is substantial, and the most significant peak occurs during the busy charging period in the early evening, which we call the “charging rush hour.” These findings indicate that significant changes are necessary in our current transportation system to achieve sustainable and eco-friendly mobility.
Keywords
Introduction
One of the biggest contributors to global greenhouse gas (GHG) emissions is the traffic sector (Riahi et al., 2022). More importantly and in contrast to most other sectors, we observe an increase in emissions in recent years (IEA, 2022), despite great effort to reduce the carbon footprint of mobility (Riahi et al., 2022). Thus, finding a sustainable solution for our mobility system is one of the big challenges of this generation.
There are different approaches and ideas on how to change the mobility system to be more sustainable. Research suggests that there is no single solution to this problem, but rather that a complex solution, combining various policies and innovations, is required (Dugan et al., 2022; Thaller et al., 2021). However, most viable suggestions rely heavily on the use of electric cars (Arvizu et al., 2011; European Commission, 2021; Meyer, 2017; Ovaere & Proost, 2022).
Therefore, independent of how our future mobility system will look like exactly, it will include a shift from cars with internal combustion engines to electric cars, which will in turn create a huge demand for (renewable) energy. In addition to the obvious problem of how to meet this demand, which is extensively discussed in the literature (Arvizu et al., 2011; IEA, 2020), there is also a more subtle problem, which is investigated in this study: If the population of a region completely adopts electric cars, the electric grid faces demand peaks clearly exceeding the demand domestic consumption currently causes. Especially since this peak demand needs to be satisfied using renewable energy, such extensive demand spikes are a problem for the energy system and need to be avoided.
In this study we investigate this “charging rush hour” effect that occurs if a large fraction of the population of a region charge their electric cars simultaneously, for example, when returning from work. Recent studies by Kapustin and Grushevenko (2020) and Krause et al. (2020) give estimates on the overall electricity consumption of a fully electric fleet (Kapustin and Grushevenko, 2020; Krause et al., 2020). These are complemented by several related case studies (Choma & Ugaya, 2017; Perujo & Ciuffo, 2010; Van Roy et al., 2011). More specially, De Gennaro et al. (2014) find that, even in an urban environment, where people do not rely on cars that heavily, replacing 28% of private cars with electric cars, leads to an increase in domestic energy consumption of nearly 20% (De Gennaro et al., 2014).
However, knowledge about the distribution of this additional demand during the day is lacking. This information would be crucial to provide adequate charging infrastructure and to assess the necessity of controlled charging to avoid grid failure (Hussain et al., 2021; Muñoz et al., 2016). Furthermore, Ajanovic et al. (2021) conclude that the most important aspect of electric mobility regarding environmental performance is to ensure that the energy comes from renewable sources (Ajanovic et al., 2021). This complex connection between our mobility system and our energy system (also visible in the decrease in electricity demand during the COVID-19 pandemic (An et al., 2022)) leads to many challenges as well as possible synergies (Lakshmi et al., 2020; Vopava et al., 2020). In order to address those, detailed knowledge about the temporal distribution of the electricity demand would be required.
In order to close this research gap, this study aims to answer the following research questions:
Based on these research questions, we formulate hypotheses that can then be analyzed in the study:
In order to answer the research questions we need insight into the micro-scale of the energy-mobility system, that is, individual decisions to drive or charge a car that lead to a macroscopic peak in demand. Thus, a statistical analysis or forecast is not sufficient, neither is a macroscopic mobility model. In order to be able to understand the charging rush hour, a microscopic (agent-based) model is needed. It needs to simulate not only the driving behavior of people realistically, but also their charging behavior and requires a sub-hour time resolution and calibration to empirical data in order to achieve its goal. Since such a model is currently not available, we will develop it as part of this study and then use it to investigate the charging rush hour.
This investigation is a first step toward preparing for the inevitable increase in electricity demand that comes with the full adoption of electric cars. Once the details regarding the demand peak are known and possible vulnerable regions (e.g., rural regions) are identified, counter strategies and necessary precautions can be explored.
Our main interest is not the transition toward a fully electric fleet, which is already heavily investigated in terms of acceptance and needed incentives (Biresselioglu et al., 2018; Liu & Lai, 2020; Ogunkunbi et al., 2021, 2022; Wang et al., 2019). In this study, we are interested in the state of the system after the transition to a fully electric car fleet. Such a fleet could be feasible by the year 2040 (Auer et al., 2020; European Commission, 2021), which highlights the urgency of understanding all the implications and consequences of this transition. This paper aims to contribute toward that goal.
In the following sections we first develop the agent-based model that is required to answer our research questions (see Section “Model”). Then we give details about the empirical data that was needed to calibrate the model (see Section “Data”). We then use the model and subsequently present results that can be used to answer the research questions. Finally, the results are discussed and conclusions are drawn.
Methods
Model
In order to study the demand peaks generated by electric cars, we need to explore the actions and interactions of a large number of connected, but independent entities. For such systems, agent-based modeling is a suitable approach (Epstein, 1999). The model we develop is inspired by an idea explored by Jäger et al. (2019): In a digital twin of a city or region, each person is represented by a digital agent with realistic mobility behavior (Jäger et al., 2019). Based on this behavior it can be simulated when these agents charge their vehicles and thus the overall electricity demand can be found. This original idea had to be improved drastically to be able to address the research questions at hand, especially since we are interested in differences between urban, suburban and rural regions. In addition to belonging to one of these urbanization types, agents also have other properties that need to be extracted from empirical data (see Section “Data” for details).
The model consists of the two steps
agent generation and
agent mobility and charging
which are explained in more detail below.
Agent Generation
The number of agents that need to be generated is determined by the total sum of kilometers driven by car in the simulated region. Since the scope of this study is the year 2040, we do not use statistical values but rather an extrapolation. Steininger et al. (2024) based on the current development of car traffic and planned and existing policies (Dugan et al., 2022; Thaller et al., 2021). Once enough agents are generated, the actual simulation run can start.
Agent Mobility and Charging
During a simulation run, all agents perform all their routes. After the last route of the day, the charging process begins. Its length is primarily determined by the total distance traveled that day, the consumption rate of the car and the charging rate of the charging station used. Additionally, we also need to consider the charging loss, that is, the effect that not 100% of the energy that is used to charge a battery can be utilized. We approximate this charging loss with 15%, based on an experiment comparing the energy required for a full charging cycle to the net capacity of the battery (Allgemeiner Deutscher Automobil-Club e.V. (ADAC), 2022). This experimentally obtained value is also in line with other studies (Apostolaki-Iosifidou et al., 2017). The demand for electricity is then determined in 1-min resolution for each agent and accumulated in the end.
Model Parameters
The model features a list of parameters given in Table 1 that can be chosen to investigate different scenarios.
Model Parameters.

The driving distance
Data
The data used to calibrate the model is based on the survey “Österreich Unterwegs”Tomschy et al. (2016), which is provided by the Austrian Federal Ministry for Climate Action, Environment, Energy, Mobility, Innovation and Technology. Data was gathered in a survey that was conducted in Austria in the years 2013 and 2014. The roughly 38,000 people participating in the survey documented their mobility behavior including not only times and distances of each trip but also the reason for the trip and the used travel mode. Reporting was done on 2 days (random for each participant) leading to roughly 76,000 days of mobility data. For the model we need the following information about each trip as input data:
person identification (anonymized)
travel mode
length of trip
arrival time
For this study we choose to focus on a single region. The investigated federal state, Styria, has more than 1,250,000 inhabitants, of which roughly 290,000 are residing in Graz, the state capital. Graz is the only urban district in Styria and the second most populous city in Austria. Styria encompasses an area of 16,400 km2, resulting in a population density of 76.4 inhabitants per km2. This is below the Austrian average of 107.0 inhabitants per km2 (Bundesanstalt Statistik Österreich, 2022a, 2022d).
In Styria, the car density of 624.4 per 1,000 inhabitants is higher than the Austrian average of 571.8 cars per 1,000 inhabitants while there is a general trend of increasing car ownership (Bundesanstalt Statistik Österreich, 2022a, 2020c). The modal split on workdays (Monday to Friday) and on all days given in Table 2 reflects the high motorization rate in Styria (Tomschy et al., 2016).
Modal Split in Styria in Percent.

In Austria electricity is mainly generated from renewable sources with a share of 80.1%. Hydroelectric power stations provide 44.3% of the gross electricity generation while 16.4% are generated by storage power stations (Federal Ministry for Climate Action, Environment, Energy, Mobility, Innovation and Technology (BMK), 2022; Figure 1).

The investigated region of Styria, Austria, features a single urban center and large rural areas.
Choosing this region allows to clearly separate urban, suburban and rural areas, compare them to each other and further identify and develop specific approaches for regions where most problems arise by the increasing electricity demand. Thus, we filter the data in such a way that only information about the people living (and charging their vehicles) in Styria is used. Due to the ambitious scope of this study, the number of agents needed is bigger than the number of survey participants. By using the data in a straightforward way, we would risk modeling artefacts in the results. This effect is mitigated by randomizing the data slightly, specifically by changing the end time of each trip for each agent randomly by ±
The model parameters given in Table 1 are as follows: We use a distance (
In addition to data about the mobility behavior we also need data about the demand for electricity in order to identify the actual demand peaks. This data is available in 15-min precision for Austria Energie-Control Austria für die Regulierung der Elektrizitäts- und Erdgaswirtschaft (2022). To avoid resolution mismatch, a Savgol smoothing algorithm is utilized (Press and Teukolsky, 1990). Using a factor for the Styrian fraction of the energy demand (Energie-Control Austria für die Regulierung der Elektrizitäts- und Erdgaswirtschaft, 2021) we can investigate the region at hand. For a complete comparison we use both the day with the lowest demand and the day with the highest demand in the used data set.
The data regarding energy demand is publicly available. For the data regarding mobility behavior, only aggregated values are publicly available (Tomschy et al., 2016), while using the raw data for research purposes needs permission by the Austrian Federal Ministry for Climate Action, Environment, Energy, Mobility, Innovation and Technology. The Python code used for the computer model is publicly available via https://doi.org/10.5281/zenodo.8068875.
Results
The main result of the simulation described in Section “Methods” is the demand for electricity generated by charging electric cars, which is shown in Figure 2. The most prominent feature of the demand curve is the peak of more than 1 GW around 6 pm.

The demand for electricity created by charging electric cars peaks at 1.06 GW (corresponding to ≈ 850 W per person) around 6 pm (18 in the 24 hr format used on the x-axis). The inlay shows a detailed view of this peak.
To put this peak into perspective, Figure 3 shows the same demand added to the already existing demand for electricity of the investigated region for a day with high energy demand (upper panel) and a day with low energy demand (lower panel). It is clearly visible that, even though the charging of electric cars is only responsible for 14.6% to 22.0% of the overall demand, the resulting peak demand increases significantly: For the day with high demand it increases from ≈1.5 GW to ≈2.3 GW when including electric cars (≈53% increase) and for the day with low demand it increases from ≈1.0 GW to ≈1.8 GW (≈80% increase).

A comparison between charging demand and regular demand shows a significant increase in peak demand by up to 80% (24 hr format used on the x-axis).
Figure 4 compares the demand curves of different region types. We distinguish between urban areas, suburban areas and rural areas according to the distinction used in the survey (Tomschy et al., 2016). For better comparison, all demand curves are normalized to the demand generated by 100,000 people. Here we can make an interesting observation: While the daily overall demand is quite different for the different region types (24, 35, and 36 GWh for urban, suburban and rural, respectively) corresponding to their different mobility behavior (Tomschy et al., 2016), the resulting demand peak is nearly identical. Reasons for this counter-intuitive phenomenon will be explored in the Section “Discussion.”
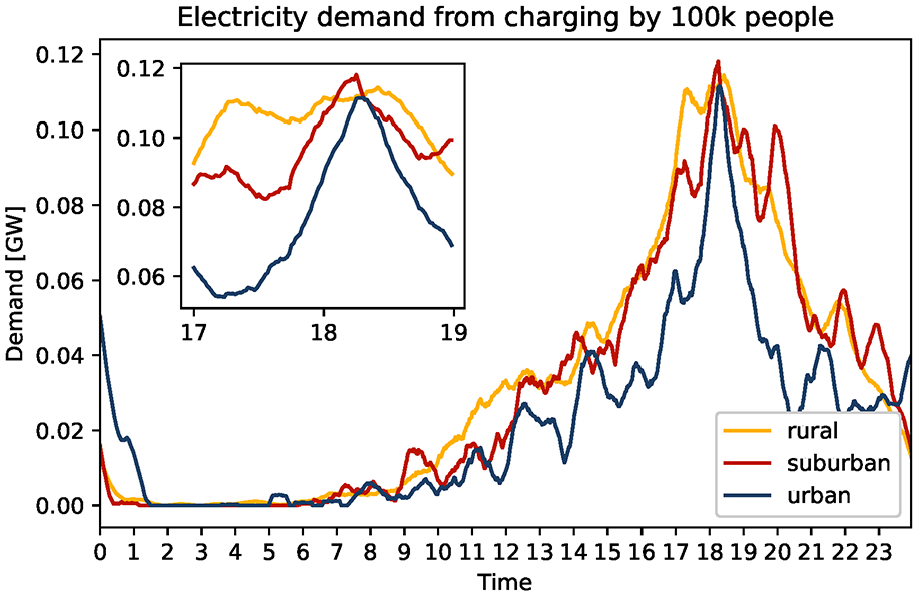
Demand curves for urban, suburban and rural regions all show a similar demand peak at 6 pm (18 in the 24 h format used on the x-axis). The inlay shows a detailed view of these peaks.
For the results presented above we assumed a charging rate of 50 kW. However, since the system is sensitive to this variable and the future development of the average charging speed is unknown, we performed a sensitivity analysis with regard to this parameter. We investigated charging rates from 10 to 150 kW. Figure 5 shows the resulting peak demand for different charging rates. While for lower charging rates (<<50 kW) there is a steep increase in peak demand, it begins to saturate above charging rates of 70 kW at roughly 1.09 GW.

The size of the demand peak saturates above a charging rate of 70 kW at roughly 1.09 GW.
Implications of these findings will be discussed in the following section.
Discussion
The presented results suggest that a complete transition to electric vehicles, given today’s mobility behavior which relies heavily on private car use, leads to a significant increase in the demand for renewable energy. Additionally, peak demand can become a problem for the electric grid: We identified a charging rush hour between 5 and 7 pm that leads to considerable demand peaks. The size of those peaks can be up to 80% of the current grid load, which is surprising, since charging is only responsible for roughly 20% of the overall electricity demand. This means that in addition to providing more renewable energy, it is also paramount to enhance the electric grid to be able to handle such demand spikes or find counter-strategies to smooth the arising demand.
Regarding differences between urban, suburban and rural charging demand, we find that even though urban areas require less electricity per person, the demand peaks are nearly equal in height (see Figure 4). This effect is caused by the larger distances traveled in rural areas, which is the main difference between urban, suburban and rural mobility behavior. While this property influences charging time and the overall demand for electricity, it has only a minor influence on the maximum size of the demand peak, which is mainly determined by how many people charge their cars during the charging rush hour. This number is very similar for urban and rural regions because two effects cancel out: While in urban areas the modal split shows less car use, the commuting distances are shorter and more homogeneous (Tomschy et al., 2016), thus leading to a sharper peak (see inlay of Figure 4).
The charging rate of the charging technology used seems to play only a minor role for the size of the demand peak. While the peak decreases for small charging rates (<50 kW), it saturates above 70 kW (see Figure 5). This has to do with two effects cancelling out: Higher charging rates lead on the one hand to an increase of demand per car being charged, but on the other hand decrease the overlap between the charging cycles of two cars due to the shorter charging times. Thus, even though we cannot predict which charging technology will become dominant in the future, we have a clear insight into the expected demand peaks, especially if we assume that future charging rates will be above 50 kW on average.
The presented model uses simplifications and assumptions that need to be addressed. One significant assumption is that people charge their car daily and always after the last trip of the day. While this is not perfectly realistic (e.g., some people use opportunities to charge their car at work or elsewhere during the day), it is still a useful approximation of reality. While today’s public charging infrastructure accommodates a certain fraction of e-car users, we cannot assume that this fraction is still significant if 100% of the private car fleet is electric. Since we are especially interested in investigating the risk of a charging rush hour on the grid, the assumption that people charge at home after their last trip is justified.
The model parameters chosen for this study (see Table 1) are based on reasonable assumptions, but of course they can be chosen differently. We performed a sensitivity analysis with respect to the average charging rate to rule out that higher charging rates drastically change the obtained results. The other two parameters, namely the total distance driven and the average consumption rate, have a similar effect on the resulting demand and only increase charging times linearly. Thus, if any of those two parameters is increased by 10%, electricity consumption increases by 10%. However, the effect on the size of the demand spike is bound by this 10% increase, since only charging overlap can be increased, but not the individual charging rates.
Conclusion
In conclusion, the newly developed computer model was able to answer the posed research questions as follows:
We identified a large demand peak in the early evening (see Figure 2).
The biggest demand peak is shortly after 6 pm and its size is up to 80% of what the grid would need to handle without charging electric cars (see Figure 3).
We did not find significant differences in the size or time of the demand peak in urban, suburban or rural areas (see Figure 4).
With respect to our hypotheses, these results mean that H1 and H2 hold, while we found evidence that H3 is false.
In addition to closing this research gap, this study also advances the field by enabling further research: In this study we investigated the charging demand in a certain region once the transition to e-mobility is complete. However, the presented model can be generalized and used for different scenarios. If one is interested in a region with different mobility behavior, other mobility data can be used to feed the model. The model parameters shown in Table 1 also enable us to change technological aspects about the system. Finally, one can also lower the percentage of electric cars from 100% to an arbitrary value, in order to simulate the transition phase (from today to 2040), which is not investigated in this study.
In addition to calculating the size and time of the demand peaks generated by charging electric cars, the presented model can be used for a different purpose. By expanding the model it would be possible to evaluate counter-strategies and quantify how much they decrease or flatten the demand curve.
Possible scenarios include:
limit the allowed charging rate
charge at work
charge at night
charge with random delay
teleworking and flexible working hours
smart grid solutions
Finding such successful strategies to deal with the impending demand peaks will be the next important step in the transition toward a more sustainable mobility system.
Footnotes
Acknowledgements
The authors would like to thank the University of Graz for covering all article process charges with regard to open access publishing.
Declaration of Conflicting Interests
The author(s) declared no potential conflicts of interest with respect to the research, authorship, and/or publication of this article.
Funding
The author(s) disclosed receipt of the following financial support for the research, authorship, and/or publication of this article: This work was funded by the Provincial Government of Styria.
Ethical Approval
An ethics statement is not applicable for this study.
Data Availability Statement
The data regarding energy demand is publicly available. For the data regarding mobility behavior, only aggregated values are publicly available (Tomschy et al., 2016), while using the raw data for research purposes needs permission by the Austrian Federal Ministry for Climate Action, Environment, Energy, Mobility, Innovation and Technology. The Python code used for the computer model is publicly available via https://doi.org/10.5281/zenodo.8068875.