
Abstract
This study assesses household resilience to flood disasters in Nepal, focusing on a comparative, index-based approach to evaluate non-migrant households (NMHs) and migrant households (MHs). The main research gap addressed by this study is the lack of comparative analysis of household resilience in disaster research, particularly between migrant and non-migrant households, an area that has received limited attention in prior studies. The study examines resilience across five dimensions social, physical, economic, institutional, and environmental based on data from 432 household surveys (158 MHs and 274 NMHs), 15 key informant interviews (KIIs), and 30 in-depth interviews (IDIs). The findings reveal that NMHs consistently demonstrate higher resilience across all dimensions due to stronger social networks, better infrastructure, and more effective governance systems. Statistical analysis confirms significant differences in resilience levels between the two household types. The study highlights the importance of targeted interventions to enhance MHs’ resilience and foster equitable and sustainable flood resilience through effective disaster risk reduction strategies. It emphasizes the need for policies that prioritize strengthening the social, physical, and institutional resilience of MHs while addressing the unique challenges faced by both household types.
Plain language summary
Why was the study done? Flooding is a major issue in Sunsari District, Nepal, leading to loss of life and damage to homes and livelihoods. Families who migrate after floods may face different challenges than those who stay. This study was conducted to compare how well migrant and non-migrant families can cope with floods and to identify areas where migrant households need additional support. What did the researchers do? Researchers surveyed both migrant and non-migrant households to measure their ability to recover from floods across five important areas: social connections, physical resources, financial stability, government support, and environmental resilience. The goal was to compare their overall resilience and highlight which areas need the most attention for migrant families. What did the researchers find? The study found that non-migrant households consistently had higher resilience scores in all five areas, with strong community support, better infrastructure, and more effective government services. In contrast, migrant households faced more challenges, particularly in social and physical resilience. The results showed a clear need for specific interventions to help migrant households strengthen their ability to recover from floods. What do the findings mean? These findings suggest that policies should focus on improving the social, physical, and institutional support systems for migrant households. Addressing these challenges will help reduce the gap between migrant and non-migrant households when it comes to coping with and recovering from floods. It is important to consider the unique needs of migrant families in disaster preparedness and resilience planning to make sure all households can adapt effectively.
Keywords
Introduction
In recent years, the frequency and severity of disasters have intensified, primarily due to global climatic and environmental changes (Kaya et al., 2024; Shabir & Nain, 2024). In 2019, natural disasters alone posed a risk to 4.1 billion people globally, with storms and floods leading to significant economic losses of 59.3 billion and 36.8 billion USD, respectively (CRED, 2020; Statista, 2022). Data from the International Disaster Database indicates that floods and storms could impact between 2.9 million and 1.9 billion individuals worldwide (CRED, 2020). Moreover, the 2018 IPCC special report highlights the likelihood that climate change will prolong, intensify, and increase the frequency of extreme weather events, thereby placing millions more at risk (IPCC, 2018).
These developments are prompting populations worldwide to migrate to safer areas in search of better livelihoods (Adger et al., 2021; IFRC, 2021; IPCC, 2012). It is predicted that by the year 2050, a significant portion of the global population, approximately 250 million to 1 billion people, will be forced to relocate permanently due to the impacts of disasters (IOM, 2018; Smirnov et al., 2023) and human migration is widely recognized as an adaptation strategy employed to address various environmental disasters across both developed and developing nations (Behrman & Kent, 2018; Petrova, 2021; Shakya et al., 2022).
Migration often becomes a critical survival strategy in such contexts, with temporary and permanent migration patterns shaped by various socio-economic and ecological drivers (Black et al., 2022; Petrova, 2021). Migration is increasingly recognized as an adaptation strategy to mitigate the adverse impacts of environmental disasters (Adger et al., 2021; Shakya et al., 2022). Communities are facing increased challenges in building resilience to disasters due to migration triggered by crises and socio-economic marginalization. Disaster risk reduction (DRR) programs aim to enhance community resilience by fostering adaptive capacities (Cutter, 2016). The Sendai Framework (2015–2030) underscores the importance of investing in DRR strategies to strengthen resilience and emphasizes establishing clear baselines for measuring progress (UNISDR, 2015). Similarly, the SDG framework stresses the importance of building resilience and improving adaptive capacity to climate-related hazards by promoting the implementation of local-level DRR strategies (Srisawasdi & Cortes, 2024). Measuring a community’s level of resilience has drawn more attention from researchers and practitioners in recent decades as a means of formulating plans and implementing DRR policies and programs that are intended to increase community disaster resilience (Cutter et al., 2014; Siebeneck et al., 2015).
This study addresses a critical research gap by focusing on the comparative resilience of migrant households (MHs) and non-migrant households (NMHs) to flood disasters, an area that has received limited attention. Existing research predominantly explores broader migration trends without examining their nuanced effects of migration on resilience dimensions across social, economic, institutional, physical, and environmental aspects. Limited attention to such comparative resilience studies hinders effective disaster management and misses opportunities to enhance community resilience.
However, its implications for household resilience remain underexplored, particularly in flood-prone regions like Nepal. Nepal ranks among the top 20 multi-hazard-prone countries, with significant vulnerability to climate change (4th), earthquakes (11th), and floods (30th), facing annual flood risks affecting 23.74% of its population and ranking 11th in disaster vulnerability globally, with steep terrain, fragile geology, and intense monsoons causing frequent and severe floods, particularly in the Terai plains (Guragain & Doneys, 2022). Floods in Nepal, worsened by climate change, are driven by multiple factors, including heavy monsoon rains, glacial lake outburst floods (GLOFs), landslides, and the rapid melting of snow and glaciers in the Himalayas. These events disrupt river systems, causing water to overflow, particularly in the Koshi, Gandaki, and Karnali River basins. Between 1971 and 2020, floods led to two deaths and affected over 300 families daily, with an increase in severity and frequency, particularly in districts like Jhapa, Sarlahi, and Bardiya, though the rate of increase has slowed despite population growth (Sharma et al., 2023). Such disasters have intensified the challenges faced by local communities, necessitating comprehensive strategies to build resilience. This study explores the underexamined impact of temporary migration on household resilience to floods, conducting a comparative analysis of MHs and NMHs in the Sunsari District. It aims to provide actionable insights to strengthen MHs’ resilience while supporting equitable disaster risk reduction (DRR) practices. Specifically, it evaluates resilience dimensions and identifies challenges to inform targeted interventions. Studies highlight the importance of resilience in the context of the increasing frequency and intensity of flooding events and climate change in recent years (Acharya et al., 2023; Poudela et al., 2024; Zeng et al., 2024), and this paper is important as it addresses the gap in comparative household resilience studies, offering insights for improving disaster risk reduction in flood-prone regions.
The research is guided by two key questions: How do resilience dimensions differ between MHs and NMHs in flood-prone areas of Sunsari District, Nepal? And what are the key challenges and opportunities for enhancing resilience in MHs? The corresponding objectives are to assess resilience dimensions and propose targeted strategies for enhancing MHs’ resilience. A mixed-methods approach integrates household surveys, key informant interviews (KIIs), and in-depth interviews (IDIs) to generate comprehensive data. An index-based approach is employed to assess resilience across multiple dimensions, while statistical analysis evaluates differences in resilience, enabling the development of targeted recommendations to enhance community resilience against flood disasters.
Literature Review
Disasters arise when extreme events collide with vulnerable societies, highlighting the critical need for resilience to anticipate, adapt, and recover from their impacts, as vulnerabilities rooted in poverty, inequality, and systemic barriers exacerbate the unequal burden of suffering (Guragain & Doneys, 2022). The concept of resilience, originating from ecological studies and subsequently applied to human societies, has evolved over time with multiple interpretations across disciplines. Initially coined by Holling (1973) in ecology, resilience was later adapted by Timmerman (1981) to describe human societies’ capacity to absorb and recover from hazardous events. Subsequent definitions by various scholars reflect diverse perspectives: from Buckle et al. (2001) emphasizing organizational and community capacities to withstand and recover from emergencies to Cutter et al. (2008) underscoring social systems’ adaptive processes post-disaster. Psychological research, exemplified by Paton et al. (2001), focuses on personal and communal attributes facilitating adaptation and growth following adversity. Geographical studies, as advocated by Cutter et al. (2008), explore resilience as a product of preceding conditions that can be altered over time. Resilience is also examined through socio-technical lenses, highlighting communities’ improvisational and problem-solving abilities (Boin et al., 2010). Additionally, resilience in organizational science denotes both adaptive capacity and learning capabilities (Weick, 1998), while political science and economics frame it within governance, resource allocation, and response to disasters (Comfort et al., 2010; Rose, 2004). These diverse interpretations underscore resilience’s multifaceted nature, contributing to ongoing debates and challenges in defining the concept across disciplines (Mayunga, 2007).
The academic discourse on resilience assessment has produced numerous models and frameworks to evaluate the resilience of households, communities, regions, and systems against various hazards. However, a consensus on a standardized approach for measuring and monitoring hazard resilience remains elusive (Cutter & Emrich, 2006). Notable among these frameworks is the Disaster Resilience of a Place (DROP) Model introduced by Cutter et al. (2008), which adopts a community-level perspective adaptable to a spectrum of hazards. Tobin and Whiteford (2002) delineate three distinct models, mitigation, recovery, and structural cognitive aimed at fostering resilience in communities confronting volcano hazards, with an emphasis on dynamic system dynamics. Norris et al. (2008) present between stress resistance and resilience over time, underscoring the criticality of robust and rapid resource allocation to mitigate stressors effectively. Kulig et al. (2008)advance a process-oriented conceptualization of community resilience, emphasizing the linkage between community experiences and subsequent problem-solving endeavors. In a similar vein, Bruneau et al. (2003) present an encompassing framework for seismic resilience, synthesizing measures of robustness and rapidity across technical, organizational, social, and economic dimensions. Stewart et al. (2009) advocate for partnership-based frameworks to bolster resilience, integrating considerations of supply chain critical infrastructure and economic and social dimensions. United States Agency for International Development (USAID, 2007) proffers a framework for assessing coastal community resilience, underscoring the imperative of stakeholder collaboration in addressing resilience deficits. The Community-Based Disaster Risk Management (CBDRM) framework by the Asian Disaster Preparedness Center (ADPC, 2004) pivots toward empowering communities to comprehend and mitigate localized disaster risks effectively. Furthermore, Teo et al. (2015) proposed a comprehensive framework for community resilience that includes ecological, economic, infrastructural, institutional, and socio-cultural dimensions. This emphasizes the multifaceted nature of resilience assessment and the importance of considering various factors to enhance community resilience. Thus, a holistic evaluation encompasses environmental, social, governance, infrastructure, and economic resilience dimensions.
Migration has been a prevalent aspect of human history, shaping the formation of societies and the evolution of settlements to pursue improved livelihoods and opportunities (Blaikie et al., 2014; Dun & Gemenne, 2008). While voluntary migration has historically driven societal changes, involuntary movements have been prompted by abrupt environmental shifts such as disasters or prolonged factors like climate change and political turmoil (Blaikie et al., 2014; Dun & Gemenne, 2008). The discussion surrounding migration, influenced by various social, economic, developmental, political, and environmental factors, has been complex and multifaceted (Hagen-Zanker, 2008; Naser, 2012). Similarly, the understanding of disasters has evolved over time, transitioning from perceiving them as unforeseen natural occurrences to acknowledging the intertwined roles of social, economic, and developmental dynamics (Dun & Gemenne, 2008; Noy & Yonson, 2018). Within this context, migration has often been viewed as a response strategy following disasters (Hollema et al., 2008; Mohapatra et al., 2012). Although some literature has underscored demographic shifts and haphazard urban growth as contributors to disasters, comprehensive examinations exploring migration’s potential role as a catalyst for disasters and probing the interconnections between these phenomena remain scarce (Donner & Rodriguez, 2008; Gaillard et al., 2005). Despite being an enduring global phenomenon, the frequency of both internal and external migration has notably escalated in recent decades.
The nexus between migration and disasters comprises diverse and sometimes contradictory scholarly perspectives. Some studies support the notion of disaster-induced migration, commonly termed as “environmental migration,” while others argue for a multi-causal approach, suggesting that disasters may be just one of many factors influencing migration decisions (Gautam, 2017; Walsham, 2010). For instance, Dun and Gemenne (2008) distinguish between two groups of scholars: alarmists, who emphasize environmental disasters as migration drivers, and skeptics, who stress the complexity of migration processes and the role of gradual, unseen changes in shaping migration decisions. While some research demonstrates migration as a response to climate change-induced environmental degradation, others highlight individual resilience and coping capacities as determinants of migration choices (Mallick & Siddiqui, 2015; Naser, 2012).
Additionally, studies exploring the reverse linkage between migration and disasters are sparse, with most focusing on environmental migration and migration as a coping mechanism for disasters (Massey et al., 2010; Mohapatra et al., 2012). Nonetheless, a few investigations suggest migration as a driver of disasters, such as urban flooding and landslides resulting from population growth and haphazard urban expansion (Pervin et al., 2020; Petley et al., 2007; Pradhan-Salike & Raj Pokharel, 2017). Moreover, the role of remittances in influencing migration, urbanization, and disaster dynamics warrants further scrutiny, particularly in contexts like Nepal, where remittance income significantly impacts land investment and urban expansion (CBS, 2023; Ministry of Labor Employment and Social Security [MOLESS], 2020). Institutional arrangements and policy frameworks play crucial roles in shaping the migration-disaster nexus, with inadequate mechanisms for managing both voluntary and involuntary migrations exacerbating vulnerabilities and exacerbating disaster risks (Shrestha, 2013). With the hypothesis that migrant households (MHs) have lower resilience to flood disasters compared to non-migrant households (NMHs) across social, physical, economic, institutional, and environmental dimensions, this study provides an in-depth analysis of the interaction between migration and disasters within institutional and policy frameworks. .
Methodology
Study Area and Sampling Design
To assess the comparative study of migrant and non-migrant households, this research was conducted in Sunsari District, Nepal, which is located in the southeastern plains and is highly flood-prone, classified as “Very High” in terms of flood hazard (MoFE, 2021), with frequent flooding. Its vulnerability is compounded by population density, ecological conditions, infrastructure, and socio-economic factors like the human development index and poverty rate (MOE, 2010). Severe flooding and riverbank erosion have repeatedly displaced communities and damaged infrastructure since 1971.
Sunsari District spans 1,257 km2, with elevations ranging from 152 to 1,420 m, bordered by Dhankuta, Morang, Bhojpur and Saptari Districts, and also by India. As of the 2021 census (CBS, 2021), it has a population of 926,962, a density of 737 people per square kilometer, and a growth rate of 1.86%. There are 212,407 households, with 36.57% classified as migrated. High population density and average annual rainfall of 1,905.6 mm, primarily during monsoon season, increase flood vulnerability. Agriculture dominates the local economy, with key crops being rice, maize, wheat, sugarcane, and oilseed. However, frequent floods harm productivity and drive migration. This research assesses resilience among migrant and non-migrant households in the district’s most flood-affected areas.
A mixed-method research design, integrating qualitative and quantitative approaches, was employed to ensure robust data triangulation and validation while capturing diverse perspectives and systematically quantifying the resilience levels of households through survey-based data. This approach aligns with the methodologies outlined in the literature, which emphasize the effectiveness of surveys in collecting structured, comparable, and contextually rich data (Li, 2015; Shin et al., 2024; Srisawasdi et al., 2021; Teddlie & Tashakkori, 2009). Household selection was conducted using simple random sampling, while nonprobability sampling was applied to identify clusters. The sample focused on both migrant and non-migrant households within these flood-prone communities, aligning with the study’s primary objectives of examining migration and flood resilience (Figure 1a,b).

Study area: Sunsari District, Nepal (Linkha et al., 2022).
Household Selection, Data Collection, and Questionnaire Design
Sunsari District, known for its high flood risk, comprises a total of 212,407 households (CBS, 2021). To select a representative sample for the quantitative aspect of this study, Yamane’s formula [n = N/(1 + N(e)2)] (Yamane, 1967) was applied, using a 5% margin of error and a 95% confidence interval. This approach, combined with the socio-economic and cultural similarities across villages, aligns with the sampling guidelines suggested by Lwanga and Lemeshow (1991) The calculated sample size was 432 households, including an initial selection of 400 households with an additional 32 to account for non-responses or incomplete questionnaires, ensuring robust representation. In Sunsari, 37% of households have at least one migrant member, closely aligning with the national figure of 39% (CBS, 2021). Of the 432 households sampled, 158 were migrant households and 274 non-migrant households, proportionally allocated to reflect migration patterns and population distribution in Sunsari District.
Household heads from both migrant and non-migrant households were surveyed to enable a comparative analysis of flood resilience across social, physical, economic, institutional, and environmental dimensions. The study employed a concurrent mixed-methods approach. Quantitative data were collected through a household survey, which was pretested and then conducted between February and May 2024, using structured questionnaires with multiple-choice and Likert scale questions. This survey covered 432 households, generating data on disaster-related experiences. Qualitative data were gathered through 15 key informant interviews (KIIs) with community leaders, local disaster risk reduction committees, and NGOs, using semi-structured checklists. Additionally, in-depth interviews (IDIs) with 30 households (11 migrant and 19 non-migrant) were conducted to explore underlying contexts and reasons, providing narrative insights to complement the survey findings. Purposive sampling was employed for qualitative data collection to select participants with specific knowledge and experience related to disaster resilience, ensuring that IDI respondents from the surveyed households provided deeper, context-specific insights complementing the quantitative data. Data collection was supported by eight research assistants, with the first author conducting all KIIs and IDIs after obtaining prior consent from participants. The existing literature highlights the effectiveness of analyzing quantitative data using descriptive and inferential statistics (Braun & Clarke, 2006; Rana & Routray, 2018), while qualitative data were thematically analyzed, as emphasized by Guragain and Doneys (2022).
Data Analysis Techniques
Resilience Assessment Frameworks
As discussed in the literature review section, various frameworks have been developed to assess resilience at the household, community, and system levels in the face of hazards; however, no universal model currently exists for measuring and monitoring resilience (Cutter & Emrich, 2006). The integrated framework for resilience, developed by Teo et al. (2015), addresses the limitations of existing models by incorporating ecological, economic, infrastructural, institutional, and socio-cultural dimensions. This comprehensive framework is particularly relevant to this study as it accounts for the complex and multidisciplinary nature of household resilience. The integrated framework includes thematic areas, subcategories of key areas, and resilience indicators and these five thematic areas collectively contribute to the overall resilience of a community. Social resilience is influenced by the community’s demographics, social capital, and cultural norms, measured by trust in community support, participation in disaster response, and educational attainment. Physical resilience focuses on infrastructure’s ability to withstand disasters, emphasizing mobility and access to essential resources like water, healthcare, and communication. Economic resilience relates to livelihood diversity and financial stability, evaluated through income consistency, multiple income sources, and access to insurance. The institutional component highlights effective governance and resource allocation in disaster risk reduction, with indicators assessing community policies, satisfaction with government services, and budget support for resilience initiatives. Finally, environmental resilience examines factors in the natural and built environments that affect recovery, using indicators such as flood-resistant agricultural practices and efficient debris removal systems.
Resilience Assessment and Indices
This study utilized a subjective assessment of household resilience indicators, capturing the perspectives of households rather than relying solely on objective data, which is often limited in less developed communities. This approach allows residents to evaluate the multidimensional impacts of disasters, and their recovery efforts based on personal perceptions of their circumstances and capabilities (Jones & Tanner, 2017). Although sociocultural biases may influence perceptions, research indicates these biases do not significantly affect resilience ratings (Veenhoven, 2012). Moreover, self-reported disaster outcomes have been shown to maintain consistency over time (Norris & Kaniasty, 1992).
To evaluate resilience levels in response to flood disasters, the study employed a composite index (CI) methodology, effectively consolidating diverse data into a more comprehensible format. This index integrates various indicators measuring social, physical, economic, institutional, and environmental resilience components. By applying weights to each indicator class, the index was calculated, modifying original datasets as needed (Bashier Abbas & Routray, 2014; Gain et al., 2015; Rana & Routray, 2018). The integrated framework for evaluating resilience in disaster management emphasizes assessing social, physical, economic, institutional, and environmental attributes to build resilient households and communities, and this study developed an index-based approach to evaluate these five components in analyzing household resilience to flood disasters.
Indices are widely applied in disaster management, poverty analysis, social capital assessment, quality of life studies, and resilience evaluation (Birkmann, 2006; Cutter et al., 2010; Mayunga, 2007; Simpson, 2008). They are crucial for measuring both baseline resilience indicators and factors that exacerbate disaster impacts and reduce recovery capacities (Cutter et al., 2008). These indices are particularly effective as they condense complex data into a single value, making it easier to understand (Birkmann, 2006; Cutter et al., 2008; Simpson, 2008). By condensing complex data into a single value, indices provide a comprehensive view that cannot be captured by individual indicators (Nardo & Saisana, 2008). Additionally, they serve as valuable tools for policymaking and public communication, offering essential insights for performance evaluation (Birkmann, 2006; Cutter et al., 2008).
Indicator Selection, Weights, and Composite Index
Resilience to natural disasters is recognized as a complex and multifaceted concept encompassing social, economic, institutional, infrastructural, ecological, and communal dimensions (Bruneau et al., 2003; Cutter et al., 2008; Norris et al., 2008). This study integrates these dimensions into an index with defined subcomponents for detailed analysis and comparison. Given the inherent challenges of directly measuring resilience, a comparative methodology was employed, utilizing variables as proxies for resilience (Cutter et al., 2008). The selection of these variables was based on two key criteria: their established relevance to resilience in existing literature and the availability of reliable data from field surveys and national sources. While various frameworks exist in the literature to ensure the quality of these variables, no universally accepted indicators or frameworks for quantifying disaster resilience currently exist (Cutter et al., 2010).
To facilitate a comprehensive interpretation of the Social Resilience Index (SRI), Physical Resilience Index (PRI), Economic Resilience Index (ERI), Institutional Resilience Index (IRI), and Environmental Resilience Index (EnRI), the quartile method was utilized. This method categorized households into four resilience classes: very low, low, moderate, and high, enabling the assessment of resilience between NMHs and MHs. A t-test was employed to compare the resilience levels between these two types of households for each component. Levene’s test for homogeneity of variances showed no significant difference (Levene Statistic = 0.220, p = .639), confirming the validity of the t-test. The indices were developed by integrating indicators listed in Appendix 1 (Table A1) drawing on similar empirical studies where comparable resilience indices were created.
The primary dataset utilized a subjective weighting method to assign values to different classes of phenomena for each indicator, calculated based on Equation 1. Indicators were selected after a thorough literature review of resilience aspects, with detailed interpretations provided in Appendix 1 (Table A1). This subjective weighting approach was informed by prior studies on disaster resilience, from which the indicators were sourced and adjusted for local conditions. The study included five indicators for the social, physical, and institutional components, four for the economic component, and three for the environmental component. Each component was deemed equally important to reflect the uniform impact of flood hazards in Sunsari District. An average was computed across all factors to assess the composite resilience index (CRI) for both non-migrant and migrant households, following data calculation methods from previous flood resilience research using the original Equation 1 for analysis.

In this formulation, CI stands for the composite index, where W1 through Wn represent the weights assigned to each transformed indicator value, and n is the total number of indicators used for each component’s composite index calculation. Using this methodology, the study calculated the SRI, PRI, ERI, IRI, and EnRI for each surveyed household. Likewise, the CRI for both NMHs and MHs was computed using Equation 2.


According to the WAI methodology’s general principle, the initial indicator values were converted to a scale of 0 to 1 based on the resilience level to compute the indices. Values closer to 0 correspond to low resilience, while those closer to 1 indicate high resilience. Each variable was then classified into different categories based on its characteristics. For example, responses were grouped into two (yes or no), three, four, five, or six categories as required. These categories were structured, drawing on extensive literature, to capture the maximum possible variation. In binary classifications, values of 0 and 1 were assigned. For indicators with three categories, the values were 0.33, 0.66, and 1; for four categories, the values were 0.25, 0.50, 0.75, and 1; for five categories, the values were 0.2, 0.4, 0.6, 0.8, and 1; and for six categories, the values were 0, 0.83, 0.67, 0.5, 0.33, and 1. As a result, the composite index for each component ranged between 0 and 1. Appendix 1 (Table A1) outlines the indicators used for the various dimensions, their classifications, values, and the empirical studies that applied these indicators.
Results
Demographic Profile of the Respondents
Table 1 provides an overview of the demographic characteristics of the sample respondents. The respondent group (N = 432) demonstrates a wide range of demographic characteristics. The majority fall within the 31 to 40 (26.9%) and 41 to 50 (28.7%) age categories, with smaller proportions aged 21 to 30 (9.7%), 51 to 60 (22.2%), 61 to 70 (11.4%), and 71 or older (1.1%). Educationally, 28% of participants are illiterate, while 19% can read and write. Of those with formal schooling, 19% have completed primary education (1–7 grade), 22% have secondary education (8–10 grade), 9% have finished high school (11–12 grade), and 1% hold a graduate degree or higher. In terms of household size, 46.8% have fewer than five members, 47.2% consist of 6 to 9 members, and 6% have 10 or more. Agriculture is the dominant source of income for 46.8% of households, followed by remittances (35.2%), daily wages (10.2%), business (5.6%), and salaried employment (2.3%). Regarding monthly income, 66.7% earn less than 25,000 NPR, while 22.5% fall within the 25,000 to 50,000 NPR range. A smaller share of households earns between 50,000 and 75,000 NPR (7.5%), 75,000 to 100,000 NPR (3.7%), and over 100,000 NPR (1.4%).
Demographic Profile of Respondents (Percentage).

Moreover, the profile of IDI respondents highlights notable differences between MHs and NMHs. In terms of age, both groups are primarily in the 41 to 50 range, with MHs having a higher proportion in the 51 to 60 range and NMHs in the 31 to 40 range. Household sizes for both groups are mostly 6 to 9 members, though NMHs have more households with fewer than 5 members. Occupation-wise, MHs are primarily engaged in agriculture (60%) and wage labor (25%), while NMHs are predominantly housewives/household workers (65%) and involved in agriculture (30%). Education levels reveal higher illiteracy rates among NMHs (40%) compared to MHs (30%), with more MHs having primary education (20%) than NMHs (10%).
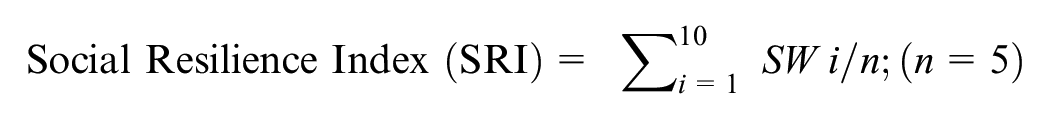
Flood Resilience at Household Level
Table 2 provides the distribution of households by number and percentage across different levels of resilience for each component, derived from statistical analysis. The social resilience index (SRI) for households ranged from 0.28 to 0.72, with an average value of 0.48 (see Table 2). NMHs demonstrated significantly greater resilience compared to MHs, with a t-value of 2.657 and a p-value of .000. The findings indicated that 0.9% of NMHs and 28.7% of MHs fall into the very low resilience category, while 27.8% of NMHs and 51.9% of MHs are classified as having low resilience. The data showed that 59.3% NMHs and 18.5% MHs have a moderate category whereas high were observed at 12% of NMHs and 0.9% of MHs in the high resilience category. The results highlighted the need for efforts to improve social resilience among households, particularly among MHs, to better prepare and respond to natural disasters and other crises.
Household Level Resilience of Non-Migrated and Migrated Households.
Similarly, the physical resilience index (PRI) for households ranged from 0.20 to 0.60, with a mean value of 0.40 in the area. NMHs exhibited significantly higher resilience compared to MHs (t = 3.666, p-value = .000). Specifically, 2.80% of NMHs and 13.90% of MHs fell into the very low resilience category, while 32.4% of NMHs and 63.9% of MHs were categorized as low resilience. Moderate resilience levels were found in 37% of NMHs and 14.8% of MHs, with 27.8% of NMHs and only 7.4% of MHs classified as high resilience. The result in the same table indicated the economic resilience index (IRI) for households ranged from 0.15 to 0.80, with an average of 0.38 in the study area. NMHs demonstrated significantly higher economic resilience compared to MHs (t = 8.052, p-value = .000). The data revealed that 21.3% of NMHs and 65.7% of MHs fell into the very low resilience category, while 46.3% of NMHs and 20.4% of MHs were classified as having low resilience. Moderate levels of the category were observed with equal percentages (12%) of both types of HHs. But in the high category, 20.4% of NMHs and only 1.9% of MHs were in a high category of resilience.
The institutional resilience index (IRI) for households ranged from 0.24 to 0.68, with an average of 0.37 in the study area. NMHs exhibited significantly greater institutional resilience compared to MHs (t = 5.753, p-value = .000). The findings indicated that 14.80% of NMHs and 47.20% of MHs fell into the very low resilience category, while 75% of NMHs and 50.90% of MHs were categorized as having low resilience. The data showed that only a small percentage of both NMHs and MHs have moderate or high institutional resilience. Moderate levels of resilience were found at 9.3% of NMHs and 1.9% of MHs whereas, in the high resilience category, 0.90% of NMHs and none of the MHs were in the high category of resilience. The result highlighted the need for efforts to improve institutional resilience among households, particularly among MHs, to better prepare and respond to natural disasters and other crises.
The environmental resilience between NMHs and MHs that a higher percentage of MHs (29.6%) fall under the very low resilience category compared to NMHs (11.1%). Additionally, a larger proportion of MHs (46.3%) were under the low resilience category, compared to NMHs (41.7%). In contrast, a higher percentage of NMHs (27.8%) fell under the moderate resilience category compared to MHs (16.7%), while a higher percentage of MHs (7.4%) were under the high resilience category compared to NMHs (19.4%). The results suggested that MHs generally had lower levels of environmental resilience compared to NMHs. That was reflected in the higher percentage of MHs in the very low and low resilience categories.
Flood Resilience Index
The combined radar chart in Figure 2 displays the household-based CRI, comparing the resilience levels of NMH and MH across five dimensions: Social, Physical, Economic, Institutional, and Environmental resilience. NMH consistently scores higher in all categories, highlighting significant disparities, particularly in social and physical resilience. This chart emphasizes the need for targeted interventions to bolster the resilience of migrant households and serves as an effective visual summary of how different household types respond to challenges, identifying key areas for improvement in disaster preparedness and community support.

The combined chart of flood resilience of NMHs and MHs.
Social Resilience Index (SRI)
Figure 2 further illustrates the results of the WAI, showing that the degree of Migrated Households (MHs) was lower than Non-Migrated Households (NMHs) in every indicator of social resilience. NMHs scored higher across all social indicators, with notable disparities in trust for equal support in disaster situations (NMHs: 0.84; MHs: 0.47), participation in flood risk management programs (NMHs: 0.74; MHs: 0.36), and trust in local government programs to address the needs of vulnerable populations such as the elderly, pregnant women, children, and disabled individuals (NMHs: 0.63; MHs: 0.32). These gaps highlight the comparatively lower resilience of MHs in the social domain.
While the SRI provides a useful quantitative measure of social resilience, the significance of the differences between MHs and NMHs was assessed through frequency analysis and chi-square tests across five indicators. In terms of household trust in community support during floods (SR1), NMHs demonstrated a higher frequency (17.6%) of very high trust compared to MHs (4.6%), indicating that NMHs possess a stronger sense of community support. Conversely, MHs exhibited a higher frequency (33.3%) of low trust, compared to 7.4% in NMHs, suggesting feelings of isolation among MHs. A local government officer elaborated on this issue, noting that “Migrated households often struggle to participate in community-level flood management initiatives because they lack stable connections within the community. Many of these households are hesitant to engage, expressing doubts about the effectiveness of local government programs, especially in addressing the needs of children and elderly family members.” In terms of household participation in flood risk management programs (SR2), NMHs showed higher rates of participation (39.8%) compared to MHs, who had a significant frequency (54.6%) of passive engagement. This indicates that MHs might be more reliant on external sources for resilience rather than active involvement in risk reduction activities. This hesitancy in participation among MHs correlates with their expressed skepticism regarding the local government’s efficacy.
This sentiment was echoed in a qualitative interview with a 42-year-old male respondent from a migrated household, who expressed his mistrust: “After the floods, my family felt abandoned. We saw little help coming from the local authorities, especially for vulnerable groups like elderly and children. It’s hard to trust them now, so we tend to rely more on ourselves than any official support.” Furthermore, the accessibility of education after a disaster proved challenging for MHs, who reported a higher frequency (47.3%) of very poor accessibility compared to NMHs (13.9%). These disparities may have long-term consequences, potentially hampering MHs’ recovery prospects and limiting future opportunities. Similarly, accessibility to support programs for vulnerable groups such as children and elderly individuals remained a significant concern. NMHs reported poor accessibility at a frequency of 68.5%, whereas MHs indicated a very poor level of access at 49.1%. This lack of access highlights the specific vulnerabilities MHs face in the aftermath of floods.
Finally, although both MHs and NMHs demonstrated a general trust in local government programs to meet the needs of vulnerable populations, notable differences persisted. MHs exhibited a higher frequency (24.1%) of very low trust, compared to 8.3% in NMHs, reflecting a greater skepticism toward official programs. This lack of trust aligns with the broader trend observed in MHs’ responses, underscoring their relative social vulnerability compared to NMHs. Overall, the survey results revealed that MHs were less socially resilient to the impacts of flooding compared to NMHs. Key differences emerged in levels of trust within the community, participation in risk management, and accessibility to education and support services. These findings highlight the necessity of targeted interventions, with an emphasis on building trust and social cohesion, to enhance the resilience of MHs in flood-prone areas.
Physical Resilience Index (PRI)
The WAI results in Figure 2 indicate that the degree of physical resilience among MHs is lower than that of NMHs across all indicators. NMHs consistently scored higher in access to essential physical resources, reflecting greater physical resilience. Specifically, NMHs have better access to clean and safe drinking water (0.52 vs. 0.26) and reliable communication means (0.68 vs. 0.32) compared to MHs. Access to physical infrastructure for preparedness measures, as supported by local authorities, was slightly better for NMHs (0.39) than MHs (0.35). While both groups had similar levels of access to medical facilities (0.49 vs. 0.21), NMHs had a significant advantage in electricity supply accessibility (0.56 vs. 0.28). Overall, NMHs displayed higher physical resilience (0.55) compared to MHs (0.26).
These results suggest that MHs face greater vulnerability to shocks and stresses, as evidenced by their limited access to basic services and infrastructure. This disparity is particularly notable among MHs, which are less likely to have access to clean drinking water, preparedness infrastructure, and reliable communication channels. Such inequalities could have severe implications for household resilience and well-being, especially in the context of natural disasters. In terms of access to clean and safe drinking water (PR1), MHs were disproportionately represented in the very poor category (49.1%), compared to 21.3% of NMHs. Conversely, NMHs had a higher proportion in the moderate and good categories. The chi-square analysis (χ2 = 26.783, p = .000) indicated a statistically significant association between households and access to clean water. An engineer involved in post-flood reconstruction highlighted the vulnerability of many households, stating: “Many non-migrant households live in older structures that are not built to withstand floods. Migrated families often return to homes that are less safe, making it crucial to upgrade these areas for future resilience, especially in the face of natural disasters.” This statement underscores the urgency of improving infrastructure to boost household resilience.
Regarding access to medical facilities (PR2), households categorized as “poor” showed similar percentages among both NMHs (52.8%) and MHs (43.5%). In the moderate category, MHs had a slightly higher proportion, yet the chi-square test (χ2 = 3.308, p = .191) revealed no significant relationship between both types of households and access to medical care. The accessibility of physical infrastructure for preparedness measures (PR3) demonstrated that households with less reliable infrastructure were primarily found among both NMHs (47.2%) and MHs (39.8%). In contrast, NMHs had a higher frequency in the moderate category. The chi-square test (χ2 = 5.441, p = .066) suggested no statistically significant association between NMHs and MHs in infrastructure access. A female respondent from a migrated household reflected on these challenges, describing her struggles to rebuild: “After the flood, we tried to reinforce our home, but the resources were scarce. We had to make do with what we could find. It’s hard to feel safe when you know the next flood could come at any time, affecting our physical well-being.” Her experience highlights the persistent insecurities that many MHs face regarding infrastructure adequacy.
Electrical supply accessibility (PR4) showed stark differences between NMHs and MHs. MHs had a higher frequency in the poor category (51.8%), while NMHs were more represented in the moderate category (39.8%). This difference was statistically significant (χ2 = 15.081, p = .002), indicating a clear association between NMHs and MHs and access to electricity. Lastly, the availability of reliable communication means (telephone, mobile, internet) (PR5) varied significantly between NMHs and MHs, with the highest percentage of households falling into the moderate category for both groups (30.6% for NMHs and 38.8% for MHs). The association between reliable communication access and household types was statistically significant (χ2 = 27.638, p = .000), emphasizing communication as a critical factor for physical resilience. Overall, these findings indicate that NMHs possess superior physical resilience, largely due to better access to basic services and infrastructure. The pronounced disparities between MHs and NMHs underline the necessity for targeted infrastructure development and support, particularly for vulnerable groups. Addressing these gaps is essential to enhance the physical well-being and resilience of MHs in flood-prone regions. Finally, although both MHs and NMHs demonstrated a general trust in local government programs to meet the needs of vulnerable populations, notable differences persisted. MHs exhibited a higher frequency (24.1%) of very low trust, compared to 8.3% in NMHs, reflecting a greater skepticism toward official programs. Overall, the survey results indicated that MHs were less physically resilient to flooding than NMHs. Key disparities were found in access to essential services like clean water, reliable communication, and electricity. These findings underscore the need for targeted infrastructure improvements to bolster the physical resilience of MHs in vulnerable areas.
Economic Resilience Index (ERI)
The ERI was used to assess and compare the economic resilience of NMHs and MHs based on four indicators. The first indicator, households having income stability (ER1), indicated that NMHs scored higher (0.76) than MHs (0.29), highlighting greater income stability among NMHs. This finding aligns with evidence from a local business owner who noted that “Migrated households often have a financial cushion from remittances, which allows them to recover faster and invest in resilient livelihoods. In contrast, non-migrant households are stuck in cycles of debt and struggle to rebuild their lives after disasters.” This reinforces the quantitative data, where 32.4% of NMHs had stable incomes compared to only 11.1% of MHs. The difference in income stability was statistically significant (χ2 = 24.293, p-value = .000). The second indicator, multiple sources of livelihood options (ER2), revealed similar scores for both NMHs and MHs, with NMHs scoring 0.34 and MHs 0.27. A majority (54.6%) of NMHs and 45.4% of MHs had three sources of income. However, a chi-square test indicated no statistically significant difference between NMHs and MHs regarding livelihood diversification (χ2 = 1.887, p-value = .389). Insurance coverage (ER3) presented notable differences, with NMHs scoring 0.29 compared to MHs at 0.15, reflecting that NMHs were more likely to possess insurance. About 28.7% of NMHs had some insurance compared to 14.8% of MHs, a statistically significant distinction (χ2 = 6.119, p-value = .013). A respondent from a non-migrant household remarked on the financial challenges faced: “After the flood, I lost everything. Unlike those who could get help from family abroad, we had no safety net. Rebuilding our livelihood has been a slow and painful process, making economic resilience feel out of reach.” This qualitative account illustrates the vulnerability of households without the financial buffers that remittances provide.
Access to credit (ER4) also showcased disparities; NMHs had a significantly higher score of 0.70, compared to 0.32 for MHs. For example, 11.1% of NMHs reported very good credit access, while only 0.9% of MHs had similar access. The statistical analysis confirmed a significant difference (χ2 = 88.520, p-value = .000), indicating greater financial hurdles for MHs. These findings were echoed in earlier research that underscored the difficulties of obtaining credit in rural Nepal due to stringent collateral requirements (Panthi et al., 2015).
Overall, the composite ERI score was higher for NMHs (0.52) compared to MHs (0.26), signifying that NMHs are generally more economically resilient. The quantitative data was further supported by qualitative insights, which highlighted the importance of remittances and access to credit as key determinants of resilience. Households without these advantages face longer recovery periods, as emphasized by both local business owners and community members. In conclusion, the findings demonstrate that economic resilience in Nepal is influenced by income stability, access to credit, insurance coverage, and livelihood diversification. Addressing these factors through targeted interventions, such as enhanced access to credit and diversified income strategies, is essential to strengthening household resilience.
Institutional Resilience Index (IRI)
The IRI was utilized to assess the level of institutional resilience to floods for both NMHs and MHs, using five key indicators. The results indicated that NMHs generally demonstrated a higher level of institutional resilience compared to MHs. For instance, NMHs had higher scores in the existence of a DRR committee at the local level (0.45 vs. 0.24), satisfaction with services provided by the local government for DRR (0.51 vs. 0.20), and the effectiveness of government collaboration between agencies (0.53 vs. 0.27). These differences suggest that NMHs had somewhat stronger connections to local DRR structures and government support, contributing to better institutional resilience compared to MHs. Nevertheless, both groups showed comparable scores in NGO/INGO effectiveness for DRR programing (0.63 vs. 0.35), although both groups faced challenges due to the inadequate allocation of budget and resources by the local government for DRR (0.37 for NMHs and 0.19 for MHs). This points to a systemic issue impacting institutional resilience in both groups.
When data were categorized by percentage frequency and analyzed using chi-square tests, the disparities between NMHs and MHs in institutional resilience became clearer. For example, the presence of a DRR committee was less prevalent among both groups, with 71.3% of NMHs and 38% of MHs reporting poor institutional resilience in this regard. A significant statistical difference (p = .000) was found, highlighting the gap between NMHs and MHs. These findings indicate a crucial area for development in strengthening local DRR committees. The level of satisfaction with local government services for DRR also revealed low satisfaction levels across both groups, with only 1.9% of NMHs and 0.9% of MHs expressing strong satisfaction. A significant difference (p = .000) emerged, with NMHs showing relatively better but still low levels of satisfaction compared to MHs. This underscores the perception of limited efficacy in local government DRR efforts. Government collaboration mechanisms were assessed by examining how well different agencies such as health, education, and security coordinated during flood events. Both groups reported low collaboration effectiveness, with 50.9% of NMHs and 58.4% of MHs indicating poor institutional resilience. The chi-square analysis confirmed a statistically significant difference (p = .003), suggesting that although NMHs scored slightly better, there remains considerable room for improvement in inter-agency coordination.
Support from NGOs/INGOs in DRR was another key indicator, revealing a moderate level of institutional resilience among households. A higher percentage of MHs (60.2%) compared to NMHs (43.5%) reported moderate effectiveness, highlighting that NGOs/INGOs support tended to favor migrant households. The statistical analysis further supported this distinction (p = .022), suggesting that MHs may have benefited more from NGO/INGO interventions. This could be due to MHs’ better networking capabilities, allowing them to access resources more effectively. The final indicator related to the adequacy of budget and resources for DRR showed that both NMHs and MHs suffered from very poor institutional resilience in this domain, with 57.4% of NMHs and 64.8% of MHs indicating dissatisfaction. Unlike the other indicators, the chi-square test revealed no significant difference between the groups (p = .246), suggesting that both faced similar challenges due to insufficient government funding for DRR.
The quantitative results highlight that institutional resilience is linked to local governance structures, financial resources, and collaboration mechanisms. Although NMHs exhibited higher resilience in certain indicators, both groups encountered systemic challenges in resource allocation and institutional effectiveness, hindering flood preparedness and recovery. Qualitative data further illuminate these issues, with respondents noting biases in resource distribution. According to an NGO representative working for disaster-related activities, “Policies often favor non-migrant households, as they can be more easily contacted through their networks.” This suggests that the presence of NMHs in local governance may inadvertently disadvantage MHs, who might receive less immediate support due to these established connections. Additionally, a 28-year-old female respondent from a MHs emphasized that social capital facilitated access to local authorities, underscoring the role of personal relationships in navigating institutional frameworks. Overall, enhancing institutional resilience in Nepal requires strengthening local government capacity, improving budget allocations for DRR, and ensuring equitable access to resources for all households. The findings advocate for a dual focus on policy reform and local capacity-building to address the interconnected challenges facing both MHs and NMHs.
Environmental Resilience Index (EnRI)
The composite index result of environmental resilience (in Figure 2) indicated that NMHs generally had a higher environmental resilience to floods than MHs. NMHs scored a higher level of environmental resilience than MHs across all three indicators: 0.50 for flood-resistant agriculture compared to 0.23 for MHs, 0.58 for accessibility of sufficient fertilizer at the local level compared to 0.30 for MHs, and 0.48 for the removal of sand, debris, and garbage after a flood compared to 0.24 for MHs. The overall EnRI revealed NMHs with a score of 0.52, indicating a moderate level of environmental resilience, while MHs scored lower at 0.26. The data suggested that NMHs were better equipped to deal with environmental challenges, particularly floods, thanks to better access to resources such as flood-resistant agriculture, fertilizer, and debris removal mechanisms.
Further categorization of the data based on frequency showed that only 1.9% and 3.7% of NMHs reported having very good flood-resistant agriculture, whereas none of the MHs were in these categories. The majority of NMHs (59.3%) and 38% of MHs reported poor resilience, while 19.4% of NMHs and 53.7% of MHs had very poor responses. Statistical analysis showed a significant difference (p = .000) between the two groups. For the accessibility of sufficient fertilizer, no households rated their resilience as very good, while 50.9% of NMHs and 36.1% of MHs reported poor resilience. Most households fell into the moderate category, with 34.3% of NMHs and 38% of MHs in this group. Lastly, for the removal mechanism of sand, debris, and garbage after floods, none reported very good or good resilience, with 37% of NMHs and 25% of MHs falling in the poor resilience category.
According to a high school teacher who teaches environmental subjects, “non-migrant households often depend heavily on local resources, making them more vulnerable to environmental changes. Migrated families might have different strategies or knowledge about sustainable living that can benefit the community and improve environmental resilience.” This highlights the differing perspectives on resource dependence and adaptability. In addition, a 39-year-old male respondent from a non-migrant household expressed concerns, stating, “We rely on our crops, but with changing rainfall patterns and climate issues, it’s becoming harder to grow food. If we don’t adapt our farming practices, like using hybrid crops that are more resilient, we won’t survive the next disaster, which affects our livelihoods and resilience.” This underscores the urgent need for adaptive strategies to enhance food security and resilience in the face of environmental changes. Overall, while NMHs demonstrated greater environmental resilience, it is crucial to recognize the specific challenges faced by MHs and implement targeted interventions to enhance their resilience to environmental changes.
Household-Level Composite Resilience Index (CRI)
The CRI measures the resilience of the environmental resilience between NMHs and MHs across various components including social, physical, economic, institutional, and environmental resilience. The index provides a composite score for each domain and an overall composite resilience index score. The result as shown in Figure 3 revealed that it was observed that NMHs generally have higher resilience scores across all components and the CRI than MHs. In terms of social resilience, NMHs scored 0.54, which is higher than MHs’ score of 0.43. This indicates that NMHs have better social support systems, stronger community ties, participation in community activities, education opportunities, and access to more resources to cope with social stressors. In physical resilience, NMHs scored 0.44, which is higher than MHs’ score of 0.37. This indicates that NMHs have better access to healthcare, better physical infrastructure, and a greater ability to withstand natural disasters.

Total Composite Resilience Index (CRI) of NMHs and MHs.
MHs, on the other hand, are more vulnerable to physical shocks and have lower physical resilience scores. The result indicated MHs had a barrier to accessing minimum physical services like drinking water, availability of medical facilities, physical infrastructure in the surroundings, availability of electricity, and reliable means of communication. In terms of economic resilience, NMHs scored 0.45, which is higher than MHs’ score of 0.33. This suggests that NMHs have better access to financial resources, more stable employment, and better economic opportunities. MHs, on the other hand, face greater economic challenges and have lower economic resilience scores in Having income stability, having multiple sources of livelihood options, having any kind of insurance, and having access to cooperatives for saving and credits. In institutional resilience, NMHs scored 0.40, which is slightly higher than MHs’ score of 0.35. It was observed that NMHs have better access to public services, more trust in public institutions, and a greater ability to participate in decision-making processes. This indicates that NMHs are better able to navigate the institutional environment and access resources and services.
In terms of environmental resilience, NMHs scored 0.42, which is higher than MHs’ score of 0.36. This indicates that NMHs have better access to natural resources, a greater ability to adapt to environmental changes, and better preparedness for climate-related disasters. MHs, on the other hand, had less access to environmentally resilient activities like flood-resistant agriculture, accessibility of enough fertilizer, etc. The CRI is the overall score that combines all five components of resilience. The index shows that NMHs have a higher CRI score of 0.45 compared to MHs with a score of 0.37. In conclusion, the CRI shows that NMHs generally have higher levels of resilience compared to MHs across all components of resilience.
According to the total household resilience results presented in Table 3, 0.9% of NMHs are classified as having very low resilience, 32.4% as low, 47.2% as moderate, and 19.5% as high resilience. In comparison, 39% of MHs fall into the very low resilience category, 48.1% into the low category, 12% into the moderate category, and 0.9% into the high category. These findings indicate that MHs exhibit a higher proportion in the low and very low resilience categories and a lower proportion in the moderate and high resilience categories compared to NMHs. Statistically, the overall CRI for households ranged from 0.28 to 0.56, with a mean of 0.40 in the study area. The t-test revealed a significant difference, showing that NMHs have a higher resilience index compared to MHs (t = 0.003, p-value = .000).
Percentage of Total Household Resilience of NMHs and MHs.

The WAI calculation reveals a notable difference in the resilience between NMHs and MHs, with the most significant disparities observed in the economic and social components compared to others. Specifically, the social component ranks highest in terms of resilience for both groups, with NMHs having a WAI of 0.65 and MHs a WAI of 0.33. Furthermore, for NMHs, the physical component ranks second with a WAI of 0.55 and 0.26 whereas economic and environmental are in same ranking in third at a WAI of 0.52 and 0.26. Similarly, institutional component is the fourth ranking for NMHs at WAI (0.50 and 0.25). Overall, the composite resilience index for households indicates that MHs require increased focus on capacity building, awareness training, livelihood enhancement, active participation in community preparedness, and inclusion in planning processes. Moreover, participation in community activities, reducing the burden of work, access to the basic physical, access to basic services like education, health services, drinking water, means of communication, stable livelihood options, access to credits, insurance, etc. would help to make more and equal resilient household to the flood disasters. Resilience is a critical aspect of disaster management, and understanding the dimensions of resilience is essential for DRR. Our analysis revealed significant differences in resilience levels between the environmental resilience between NMHs and MHs. The composite resilience index shows that NMHs have a higher level of resilience than MHs, with a score of 0.45 compared to 0.37 for MHs. We also find that NMHs have higher levels of social, physical, economic, institutional, and environmental resilience compared to MHs.
Discussion and Recommendations
This study revealed the resilience capacities of both migrant (MHs) and non-migrant households (NMHs) affected by flood disasters in Sunsari, Nepal. The findings demonstrate that NMHs exhibit greater resilience across multiple dimensions compared to MHs. This supports the hypothesis that MHs have lower resilience, driven by factors such as weaker social ties, dependence on unstable remittance incomes, and limited institutional support. NMHs demonstrated higher social resilience due to their greater trust in community support, active participation in DRR activities, better access to education, and increased confidence in local government initiatives for individuals with special needs. The resilience gap between NMHs and MHs in flood-prone areas of Nepal is influenced by several intertwined factors. These factors collectively contributed to the higher social relation and mutual assistance seen among NMHs, which was consistent with some of the previous studies (Kabir et al., 2021; Mallick et al., 2023; Mallick & Vogt, 2014). NMHs often benefit from robust social networks that provide critical support during crises. For instance, a study in Nepal, found that strong social capital significantly enhances flood resilience, enabling households to better prepare for and recover from flood events (Gyawali et al., 2020). In contrast, MHs may lack such immediate community support, increasing their vulnerability. As one interviewee explained, “We used to rely on neighbors during floods, but since my husband migrated, I feel alone in managing these challenges” (IDI, female respondent, MH).
Moreover, NMHs had better access to essential services such as drinking water, communication means, electricity supply, and robust physical infrastructure protection measures. Their confidence in local health facilities further strengthened their ability to cope with and recover from flood impacts. These elements underscored the higher physical resilience of NMHs compared to MHs. Economically, NMHs typically have more stable income sources and access to local opportunities, while MHs often depend on remittances, which can be inconsistent. This economic instability hampers MHs’ ability to effectively respond to and recover from floods. This finding aligns with research indicating that remittance dependency can create delays in coping mechanisms during disasters (Entzinger & Scholten, 2022). A respondent from an MH commented, “We wait for money from abroad to repair the house after floods, but sometimes it takes months, leaving us exposed” (IDI, male respondent, MH). Moreover, NMHs had better access to credit, insurance facilities, and more stable incomes, enhancing their economic resilience. In contrast, MHs, while demonstrating the ability to find new income sources due to migration, often face significant economic instability. This pattern was evident in the adaptive strategies adopted by MHs, including using savings, involving children in livelihood activities, selling assets, and adjusting meal quality. However, NMHs maintained greater financial stability, consistent with Saha’s (2017) findings that MHs impacted by floods often experience better economic conditions.
Institutional resilience is another area where NMHs had better resilience than MHs. NMHs usually have better connections to local governance and disaster preparedness programs, facilitating quicker access to aid and resources. MHs, however, may face challenges in accessing formal assistance due to their transient status. A study highlights that access to formal assistance through government or other institutions is crucial for managing shocks, yet MHs often have limited access to these resources (Zeng et al., 2024). This challenge was echoed by a respondent, who noted, “We don’t receive as much help from authorities because they consider us temporary residents” (KII, local official). The result revealed that NMHs reported higher satisfaction with government services and functional DRR committees in their localities. They benefited from better collaboration mechanisms between government agencies and more adequate budget allocations for disaster management. This higher institutional trust and support were crucial for enhancing NMHs’ overall resilience. Environmentally, NMHs adopted more flood-resistant agricultural practices, manage waste effectively, and had better access to fertilizers, contributing to their greater environmental resilience. This adaptive capacity allows them to better withstand and recover from the environmental impacts of floods.
Significant determinants of flood-induced migration are primarily driven by livelihood-related stress (Ahmed et al., 2023). In addition to the immediate destruction of shelter and property, flood-affected individuals frequently face challenges in sustaining their livelihoods, such as damaged homes, lack of employment opportunities, insufficient essential services, and food shortages, which often compel them to migrate (Mustafa et al., 2023). These findings resonate with the other studies (Carrico & Donato, 2019; Harris & Todaro, 1970) which highlighted the critical role of economic stability and basic survival needs in migration decisions. Flood-induced migrations typically occur close to the areas affected, aligning with the findings of Call et al. (2017). NMHs exhibit a strong attachment to their places of origin due to social and emotional connections, education, employment, and attachment to their homes, which contrasts with the migration patterns observed in migrant households (MHs). This connection is underscored by the ongoing employment opportunities and the difficulties associated with moving families and elderly members. These findings align with recent research by Mallick et al. (2023) and Rabbani et al. (2022), which emphasizes the complex interplay between place attachment, economic prospects, and the social and environmental factors that shape the decision to either migrate or remain.
Migration, driven by the pursuit of better opportunities or the desire to escape adverse conditions, can improve households’ perceived ability to cope and adapt in multiple areas of well-being, such as food security, housing, agricultural practices, livestock management, health, and employment opportunities (Kartiki, 2011; Penning-Rowsell et al., 2013). Structural factors, including national policies, economic conditions, and socio-cultural contexts, significantly influence flood resilience (Ali et al., 2023). Government policies prioritizing infrastructure and relief access enhance resilience, especially for non-migrant households, while the lack of support for migrant households, coupled with economic instability and disrupted remittance flows, weakens their resilience, and both migrant and non-migrant households struggle with recovery when community networks and social capital are weak or fragmented (Panday et al., 2021).The study suggested two primary implications. Firstly, it addressed the diverse needs of vulnerable populations affected by labor migration, emphasizing equitable access to resources locally. Secondly, it highlighted the need to enhance the resilience and adaptive capacity of both migrant and non-migrant households through infrastructure development, disaster preparedness, and sustainable living practices.
However, future research should explore additional factors that could improve coping strategies for MHs such as the extent of losses and damages, savings, access to assistance, and housing alternatives. Additionally, social protection programs need to be tailored to meet the specific needs of both migrant and non-migrant households, taking into account their distinct vulnerabilities and coping strategies. Encouraging cooperation among government agencies, NGOs, and local communities is also essential for developing comprehensive migration policies that safeguarded migrants’ rights, supported their integration, and considered their welfare. The novelty of this research lies in its emphasis on household-based resilience to flood disasters, with recommendations to foster sustainable development opportunities in areas of origin to mitigate the need for forced migration.
Conclusion
NMHs consistently demonstrate higher resilience across social, physical, economic, institutional, and environmental dimensions compared to MHs. This study highlighted the potential benefits of migration in enhancing adaptability and resilience during flood disasters. However, it also revealed the negative impacts on resource access, household well-being, and income diversification. These results underscore the need for support systems specifically designed to address the unique needs of both migrant and non-migrant households. Effective risk-reduction strategies and adaptive mechanisms should be promoted to help manage changing environmental conditions for both groups.
This research highlighted the importance of fostering disaster-resilient communities to reduce the dependency on migration as a coping mechanism. It emphasizes that investing in disaster risk reduction, climate adaptation, and sustainable development is essential for allowing communities to prosper in their current settings. Consequently, the study suggests that migration induced by flood disasters should not be considered the optimal strategy for achieving equitable and sustainable results. These conclusions offer significant insights for policymakers and practitioners dedicated to enhancing household resilience against flood disasters.
The strengths lie in the study’s comprehensive and multidimensional approach to assessing household resilience to flood disasters, integrating both quantitative and qualitative data. The use of a robust framework further enhances its relevance for informing disaster risk reduction policies in flood-prone regions, particularly in developing countries. However, limitations include the focus on a single geographic area, which may limit the generalizability of the findings to other regions with differing socio-economic contexts. The reliance on self-reported data introduces potential bias, and the cross-sectional design restricts the understanding of long-term impacts. Furthermore, cultural and psychological factors influencing resilience were not fully explored, highlighting areas for future research.
Future interventions should focus on addressing the specific challenges faced by MHs, such as improving their access to essential services, strengthening their social networks, and enhancing their trust in local governance. By addressing these issues, it will be possible to build a more resilient community capable of withstanding and recovering from flood disasters.
Footnotes
Appendix 1
List of Selected Indicators for Resilience Assessment, Their Measurement Methods With Weights, and Interpretation of Respective Empirical Studies.

| Social resilience | |||||
|---|---|---|---|---|---|
| SN | Indicators | Data class | Weights | Interpretation | Empirical studies |
| SR1 | Community trust during a disaster | Very high | 1 | The higher cooperation and trust of HH in other communities and households, the greater the resilience. | Cutter et al. (2010), Norris et al. (2008) |
| High | 0.8 | ||||
| Moderate | 0.6 | ||||
| Low | 0.4 | ||||
| Very low | 0.2 | ||||
| SR2 | Community activeness in voluntary participation during a disaster | Very active | 1 | Voluntary participation of HHs during a disaster fosters a collaborative and proactive approach toward disaster response and resilience efforts. | Birkmann (2006a), Cutter et al. (2010) |
| Active | 0.8 | ||||
| Moderate | 0.6 | ||||
| Passive | 0.4 | ||||
| Very passive | 0.2 | ||||
| SR3 | Households having family members in high school and above education | Yes | 1 | The higher the education level of family members, the greater the understanding and interpretation of early warning & evacuation decision | Cutter et al. (2010), Morrow (2008), Norris et al. (2008) |
| No | 0 | ||||
| SR4 | Households having family members with > 60 and <10 years of age | Yes | 0 | Having Old aged population and children in homes constraints of mobility during flood | Cutter et al. (2010), Morrow (2008), Tobin and Whiteford (2002) |
| No | 1 | ||||
| SR5 | Trust in local government programs to address the special need of old/pregnant women, children, and disabled people | Very High | 1 | The program addressing the vulnerable group of people (old aged persons, pregnant women, children disabled person) will increase the accessibility of services, facilitates | Cutter et al. (2010) |
| High | 0.8 | ||||
| Moderate | 0.6 | ||||
| Low | 0.4 | ||||
| Very Low | 0.2 | ||||
| Physical resilience | |||||
| SN | Indicators | Data class | Weights | Interpretation | Empirical studies |
| PR1 | Households having access to clean/safe drinking water | Very Good | 1 | Unimproved water sources are considered to produce greater vulnerability Need to make | Bashier Abbas and Routray (2014) |
| Good | 0.8 | ||||
| Moderate | 0.6 | ||||
| Poor | 0.4 | ||||
| Very Poor | 0.2 | ||||
| PR2 | Availability of medical facilities during and after a disaster | Very Good | 1 | The availability of medical facilities during and after a disaster ensures timely access to healthcare services for affected populations | Cutter et al. (2010) |
| Good | 0.8 | ||||
| Moderate | 0.6 | ||||
| Poor | 0.4 | ||||
| Very Poor | 0.2 | ||||
| PR3 | Physical infrastructure in the surrounding for preparedness measures | Very reliable | 1 | The availability of physical infrastructure to enable prompt response, evacuation, and recovery efforts | Cutter et al. (2010) |
| Reliable | 0.8 | ||||
| Moderate | 0.6 | ||||
| Less reliable | 0.4 | ||||
| Worst reliable | 0.2 | ||||
| PR4 | Continuous availability of electricity supply | Very Good | 1 | Electricity supply to ensure the function of facilities’ essential services, facilitating effective response, recovery, and resilience-building efforts | Ahsan and Warner (2014), Bleau et al. (2015), Islam (2018) |
| Good | 0.8 | ||||
| Moderate | 0.6 | ||||
| Poor | 0.4 | ||||
| Very Poor | 0.2 | ||||
| PR5 | Households having reliable means of communication (Telephone/Mobile/internet) | Very reliable | 1 | Households with no access to means of communication will be at more risk | Bleau et al. (2015), Khan (2012), Panthi et al. (2015) |
| Reliable | 0.8 | ||||
| Moderate | 0.6 | ||||
| Less reliable | 0.4 | ||||
| Worst reliable | 0.2 | ||||
| Economic resilience | |||||
| SN | Indicators | Data class | Weights | Interpretation | Empirical studies |
| ER1 | Households having income stability | Very stable | 1 | Stable Job holders have more resilience to cope in disaster time. | Ahamed (2013), Cutter et al. (2003), Holand et al. (2011) |
| Stable | 0.8 | ||||
| Moderate | 0.6 | ||||
| Less stable | 0.4 | ||||
| Least stable | 0.2 | ||||
| ER2 | Households having multiple sources of livelihood options | 5 | 1 | Multiple sources of livelihood will increase capacity because even if one source is cut off, households can survive on another | Cutter et al. (2008), Norris et al. (2008) |
| 4 | 0.8 | ||||
| 3 | 0.6 | ||||
| 2 | 0.4 | ||||
| 1 | 0.2 | ||||
| ER3 | Households having any kind of insurance (Life, Health) | Yes | 1 | Insurance can enhance households’ ability to cope with and recover from floods | Birkmann et al. (2013), Browne and Hoyt (2000), Nhuan et al. (2016) |
| No | 0 | ||||
| ER4 | Households having access to the cooperative for saving and credits | Very good | 1 | A formal or informal banking system provides opportunities to cope with the financial crisis of the community | Browne and Hoyt (2000), Wisner et al. (2004) |
| Good | 0.8 | ||||
| Moderate | 0.6 | ||||
| Poor | 0.4 | ||||
| Very poor | 0.2 | ||||
| Institutional resilience | |||||
| SN | Indicators | Data class | Weights | Interpretation | Empirical studies |
| IR1 | DRR committee set up at local level | Very high | 1 | The establishment of a DRR committee at the local may ensure resilience-building, enabling coordinated planning, response, and recovery efforts to protect communities from the impact of disasters | Ahamed (2013) |
| High | 0.8 | ||||
| Moderate | 0.6 | ||||
| Low | 0.4 | ||||
| Very low | 0.2 | ||||
| IR2 | HH is satisfied with the services provided by the local government for DRR work | Very high | 1 | Quality results of initiatives ensure community participation in disaster resilience. | Multidisciplinary Center for Earthquake Engineering Research (MCEER, 2007) |
| High | 0.8 | ||||
| Moderate | 0.6 | ||||
| Low | 0.4 | ||||
| Very low | 0.2 | ||||
| IR3 | Government collaboration mechanism between its agencies (health, education, bank, security, | Very high | 1 | Effective collaboration mechanisms make the better coordination of disaster preparedness, response, and recovery efforts, promoting resilience and minimizing the impact of disasters on communities | Cutter et al. (2010), Norris et al. (2008) |
| High | 0.8 | ||||
| Moderate | 0.6 | ||||
| Low | 0.4 | ||||
| Very low | 0.2 | ||||
| IR4 | Effectiveness of NGO/INGOs support for DRR programming | Very high | 1 | The effectiveness of support from support agencies complements government efforts and ensures holistic and coordinated | Armaş and Avram (2008) |
| High | 0.8 | ||||
| Moderate | 0.6 | ||||
| Low | 0.4 | ||||
| Very low | 0.2 | ||||
| Institutional resilience | |||||
| SN | Indicators | Data class | Weights | Interpretation | Empirical studies |
| IR5 | Adequate budget and resources allocated by local government on DRR | Very high | 1 | Adequate budget allocation for the service can make the community adaptive to the hazards and impacts | Taubenböck et al. (2008) |
| High | 0.8 | ||||
| Moderate | 0.6 | ||||
| Low | 0.4 | ||||
| Very low | 0.2 | ||||
| Environmental resilience | |||||
| SN | Indicators | Data class | Weights | Interpretation | Empirical studies |
| EnR1 | Households having flood-resistant agriculture | Yes | 1 | The adoption of flood-resistant agriculture enhances resilience to floods, ensuring sustainable food production, protecting livelihoods, and contributing to overall community resilience. | Asrat et al. (2004) |
| No | 0 | ||||
| EnR2 | Accessibility of enough fertilizer at the local level | Very high | 1 | Fertilizers can increase agriculture productivity that makes the resilient community flood | Jaim and Akter (2019) |
| High | 0.8 | ||||
| Moderate | 0.6 | ||||
| Low | 0.4 | ||||
| Very low | 0.2 | ||||
| EnR3 | Removal mechanism of sand/debris, and garbage after the flood | Very high | 1 | For restoring normalcy, mitigating health and environmental risks, timely removal mechanisms for debris and garbage, supporting resilience | Pánek (2020) |
| High | 0.8 | ||||
| Moderate | 0.6 | ||||
| Low | 0.4 | ||||
| Very low | 0.2 | ||||
Acknowledgements
The authors express their gratitude to the local communities and households in Sunsari District for sharing their insights and experiences. This research was supported by The Second Century Fund (C2F), Chulalongkorn University, Thailand. Thanks, are also extended to the study participants, the survey team, and local authorities for their valuable contributions and support.
Consent to Participate
All participants provided their consent to participate in the study after being informed about its purpose, academic use, and potential publication before the interviews took place.
Author Contributions
1. Uddhav Prasad Guragain (First Author)
• Conceptualization, formal analysis, methodology, data collection, data curation, writing, original draft, and review editing.
2. Worawat Srisawasdi (Corresponding Author)
• Conceptualization, methodology, writing, review and editing, analysis.
3. Shoukat Ali, PhD, (Co-author)
• Writing review and editing, analysis.
Funding
The author(s) disclosed receipt of the following financial support for the research, authorship, and/or publication of this article: The Second Century Fund (C2F) at Chulalongkorn University, Thailand. However, no funding was provided for the publication of this article.
Declaration of Conflicting Interests
The author(s) declared no potential conflicts of interest with respect to the research, authorship, and/or publication of this article.
Data Availability Statement
Data will be made available on request.