
Abstract
This article examines the extent of regional inequality in multidimensional poverty in Nepal using the nationally representative Nepal Demographic Health Survey (2011) data. The authors present a more robust method of multidimensional poverty index (MPI), particularly in terms of the procedure of estimation and aggregation of the indicators as compared with previous studies. The findings suggest that despite the relatively better economic progress and a considerable reduction in education and health poverty, there is a wide inequality across the regions. Far less has been achieved in the case of reducing the standard of living poverty, that is, wealth poverty and inequalities across the regions. The article finds that global MPI tends to inflate poverty estimates in the case of Nepal. It also suggests that development policies and poverty reduction programs in Nepal must aim to reduce multidimensional poverty, of which deprivation in education, health and basic amenities must be an integral component, along with their efforts to improve economic growth and reduce income poverty.
Introduction
During the last one decade, Nepal has gone through a major political transition. Abolition of monarchy, the establishment of a Federal Democratic Republic, the election of Constituent Assembly in 2008 (and reelection in 2014) and the adoption of the new constitution in September 2015 are the landmarks in the political history and economic planning of Nepal. The country is making every effort to move out of an extended political transition, and is also aiming to become a developed country in the world by 2022 (United Nations Nepal, 2014).
The ambitious journey of transition from a comparatively less developed country to a developing and then to a developed nation demands a concerted effort for a holistic approach to the development. This is not possible without a significant reduction in the incidence of both absolute and relative multidimensional poverty in the country. Measurement of poverty itself is a complex and highly debatable issue. Social scientists in different countries have adopted different dimensions to determine poverty status of the populations (see, Angulo, Díaz, & Pardo, 2016; Bader, Bieri, Wiesmann, & Heinimann, 2016; Dhongde & Haveman, 2017; Dutta, 2015; Guio, Gordon, & Marlier, 2012; Guio et al., 2016; Hanandita & Tampubolon, 2016; Montoya & Teixeira, 2017; Nowak & Scheicher, 2017; Oxford Poverty & Human Development Initiative [OPHI], 2013; Rangarajan & Dev, 2015; Reyles, 2010; Rogan, 2016; Wang & Wang, 2016; World Bank, 2014; Yu, 2013). Nepal uses the concept of absolute poverty and has followed its own definition: According to which a person earning less than 1 US$ a day is termed as poor. By this definition, the latest official figures suggest that more than 35% of the total population is living below the poverty line in Nepal. However, the application of the concept of relative poverty is virtually absent in Nepal (Alkire, Adriana, & Roche, 2013; Central Bureau of Statistics [CBS], 2011; Nepal Human Development Report [NHDR], 2014; Uematsu, Shidiq, & Tiwari, 2016; World Bank, 2016).
Earlier, to achieve million development goals (MDGs), and now, to achieve sustainable development goals (SDGs), Nepal has been fairly active in investing in social policies including poverty reduction and active society engagement (Government of Nepal, 2011; Uematsu et al., 2016). This has resulted in a significant reduction in poverty (Uematsu et al., 2016). For instance, according to an estimate, the percentage of the multidimensional poor in Nepal has dropped significantly from 64.7% to 44.2% between 2006 and 2011, that is, by 4.1 percentage points per year (Alkire et al., 2013). In fact, the country has been able to reduce the national poverty much faster than its neighboring countries such as India, Pakistan, and Bangladesh (Drèze & Sen, 2013). In spite of considerable progress in poverty reduction in recent years, Nepal remains one of the poorest countries in the world. With a human development index (HDI) of 0.548 in 2014, Nepal is ranked 145th out of 187 countries listed in the United Nations Development Programme (UNDP; 2015). The National Living Standards Survey (NLSS) conducted in 2010-2011 reported that more than 30% of Nepalese live on less than US$14 per person per month using the income-based poverty estimation. However, this figure rises to 44.2% in the case of multidimensional poor. Furthermore, there is a large inequality in the prevalence of poverty within the nation. Although the overall poverty rate for Nepal is 30%, this figure rises to 45% in the mid-western region and to 46% in the far-western region (NLSS 2010-2011). Thus, a national-level figure often obscures the within-country inequality in poverty (Uematsu et al., 2016).
Background and Rationale
Measuring poverty is a complicated process (Sen, 1979; Townsend, 1954, 1971, 1979). Early efforts of measuring poverty involved unidimensional indicators based on income or consumption expenditure (Abel-Smith & Townsend, 1965; Atkinson, 1987; Atkinson, 1970; Bosanquet, 1903; Clark, Hemming, & Ulph, 1981; Hagenaars, 1987; Kakwani, 1980; Ravallion, 1998; Ravallion & Huppi, 1991; Sen, 1976, 1981, 1987, 1989; Thon, 1979; Townsend, 1954, 1971, 1979). Later, it was recognized that no single indicator alone could capture the multiple aspects of poverty (Foster, Greer, & Thorbecke, 1984; Townsend, 1979). Poverty is much more than having a low income or low consumption expenditure (Anand & Sen, 1997; Bourguignon & Chakravarty, 2003; Sen, 1970; Townsend, 1954).
Realizing the significance of multiple indicators, there have been some efforts to include multiple indicators in measuring poverty. The first multidimensional measure can be traced back to Townsend (1979), and the underpinnings of the multidimensional poverty index (MPI) were set out by Foster et al. (1984). The global MPI was designed in 2010 by the OPHI and the UNDP using different indicators to determine poverty beyond income-based measures (OPHI, 2013). This MPI replaced the previous human poverty index in subsequent human development reports of the world countries. Following this, numerous studies in many countries have used various procedures to estimate multidimensional poverty of individuals and households (Angulo et al., 2016; Bader et al., 2016; Dhongde & Haveman, 2017; Dutta, 2015; Guio et al., 2012; Guio et al., 2016; Hanandita & Tampubolon, 2016; Mohanty et al., 2017; Montoya & Teixeira, 2017; Nowak & Scheicher, 2017; Rangarajan & Dev, 2015; Rogan, 2016; Tsui, 2002; Wang & Wang, 2016; World Bank, 2014; Yu, 2013). A majority of these studies used methods designed for global MPI calculations (Alkire & Foster, 2007; Alkire, Foster, & Santos, 2011; Alkire & Santos, 2013).
Advancing the existing methodology of selection of parameters in multidimensional poverty, Guio et al. (2012) and Guio et al. (2016) proposed an analytical framework for developing robust material deprivation indicators for the whole population in the context of the European Union. They carried out systematic item-by-item analyses at national levels to identify material deprivation criteria, which satisfactorily meet suitability, validity, reliability, and additive criteria across the European Union. There have been some efforts to include multiple indicators in measuring poverty in Nepal (Alkire et al., 2013; CBS, 2013; Mitra, 2016; NHDR, 2014). However, we understand that these Nepal-specific estimates of multidimensional poverty have methodological limitations both in terms of estimation procedures and the use of indicators and their units of measurement. This study is an attempt to refine the measure of multidimensional poverty both regarding its dimensionality and estimation procedure and to fill this gap in the literature, specifically in the context of Nepal. We provide a theoretical background and the evidence of multidimensional poverty measures used in previous studies below. Then, we describe data, our proposed method and its advantage over the existing method, indicators of alternative dimensions, and the difference in the procedure used to estimate the multidimensional poverty in this study as compared with other studies in the context of Nepal (Alkire et al., 2013; CBS, 2013; Mitra, 2016; NHDR, 2014; Uematsu et al., 2016).
Measuring Poverty: Past Efforts and Our Approach
Debates on measuring poverty were intensified in the 1970s, but these discussions were mainly about measuring income poverty and defining the poverty line. During this period, the identification of the poor was exclusively by family-size-adjusted household income, concerning a specified income poverty line. Some contributions are worth mentioning here, for example, Townsend (1954, 1971, 1979), Sen (1970, 1972, 1973, 1992, 2000b), Bardhan (1970, 1971), Dasgupta, Sen, and Starrett (1973), Gordon and Townsend (1990). Sen (1976), in his seminal article “Poverty: An Ordinal Approach to Measurement,” has emphasized the theoretical soundness of the income poverty measurement. He has suggested an ordinal approach based on ordinal axioms for measuring poverty. However, he admitted that such an approach is difficult to replicate in reality, as required data may not be available. From the mid-1970s, it was recognized that poverty is much more than just having a little income (Townsend, 2010). During this time, the “basic needs approach,” social exclusion, and “capability approaches” gained prominence in complementing the process of identification of the poor or deprived populations. Studies have shown that income does not represent the nonmonetary multidimensional deprivations of households (such as lack of access to nutritious food, health services, quality education, potable water, livable house, sanitation facilities, electricity, basic information and more), and thus fails to identify the poor correctly (Sen, 1970, 1972, 1973, 1976; Townsend, 1979). Consequently, researchers have introduced various nonmonetary measures of deprivation, supplementing these multidimensional analyses with monetary measures to create a better overall picture of poverty (Foster et al., 1984; Townsend, 1979). For instance, Townsend (1979) highlighted “relative deprivation” by which he meant an absence or inadequacy of those diets, amenities, standards, services, and activities, which are common or customary in society. This could be understood as the initial debate on a multidimensional aspect of poverty and deprivation. His measure of deprivation included a list of 60 indicators of the standard of living. The indicators covered diet, clothing, fuel and light, house and housing amenities, and so on. Sen (2000a), endorsing the need to take a multidimensional approach to poverty, writes “Human lives are battered and diminished in all kinds of different ways, and the first task is to acknowledge that deprivations of very different kinds have to be accommodated within a general overarching framework” (p. 18). Thus, a poverty measure based on multiple indicators is more robust than the one measured based solely on income poverty (Betti, Gagliardi, & Verma, 2018; Deaton, 2013; Drèze & Sen, 2013; Gordon & Townsend, 1990; Guio et al., 2012; Guio et al., 2016). This suggests that the poverty debate has moved from a unidimensional (income) to a multidimensional approach, which led to the estimation of MPI.
Foster et al. (1984) proposed a systematic methodology for estimating multidimensional poverty for the first time. Their approach fueled the debate of measuring poverty and provided a framework for decomposing poverty. They showed new poverty measure that is additively decomposable with population share weights. Although their work was one of the most cited in poverty literature due to its notable methodological contribution for decomposing the indicators of measuring poverty, it however, did not contribute much in measuring multidimensional poverty. Later on, Alkire and Foster (2007) made a significant methodological improvement.
In 2010, Alkire and Santos developed MPI for various countries for the first time under OPHI. Multidimensional poverty comprises of a number of indicators showing the deprivations experienced by people—such as poor health, lack of education, inadequate living standard, lack of income, disempowerment, poor quality of work and threat from violence (Alkire & Foster, 2011a, 2011b). These indicators may vary depending upon the context of countries, cultures or societies and their state of affairs (Alkire, Foster, & Santos, 2011). Thus, a key criticism of global MPI used by UNDP is a lack of examination of its suitability within countries, dimensional structure reliability and validity and measurement invariance apart from the ambiguity in their household-level aggregation procedure of individual and household indicators. Some of these are discussed in detail in the method section of this study (also see Guio et al., 2012; Guio et al., 2016). A study by Betti et al. (2018) on simplified Jacknife variance estimates for measures of MPI is a seminal contribution to the literature.
In Nepal, to the best of our knowledge, the present exercise is the third attempt to measure MPI at a disaggregated level. The first attempt was by Alkire and her team at OPHI who estimated MPI for 104 countries including Nepal (Alkire, Roche, Santos, & Seth, 2011). In this study, they included years of schooling and school attendance for the education dimension, child mortality and nutritional status for the health dimension, and cooking fuel, sanitation, water, electricity, and floor and asset ownership for the standard of living. They estimated MPI by place of residence and developmental region (OPHI, 2013). Their findings suggested that 44.2% of people could be classified as poor in 2011, if poverty was assessed multidimensional. This estimate was much higher than the income-based poverty (25.2%) of NLSS (2010-2011). The second study is the NHDR (2014) released by the Government of Nepal in collaboration with UNDP. In this report, human poverty index was estimated (31.1%) using the percentage of people who were not expected to survive beyond age of 40 years for a long and healthy life; adult literacy rate for knowledge; and the percentage of people without access to safe water, percentage of malnourished children below 5 years of age and deprivation in economic provisioning for a decent standard of living. Human poverty index was estimated separately for a rural–urban place of residence, five development regions, three ecological zones, subregions, and districts.
In this study, as used in previous approaches, our measure of multidimensional poverty includes three basic dimensions of human development—health, education, and economic status. However, our estimates of MPI differ significantly from the NHDR (2014) and Alkire, Roche, and Vaz (2014) regarding inclusion and coverage of indicators, their estimation procedure, and aggregation of each dimension of MPI. First, we include net enrolment ratio instead of gross enrolment ratio under education dimension. Second, wealth index is used to measure economic status as compared with individual standard of living indicators. Finally, each indicator under different dimensions has been measured at the individual level rather than at household level. We also carried out a rigorous screening of variables to identify multiple deprivation items, which adequately meet suitability, validity, and reliability of the assumed latent dimensions of MPI. We have explained in detail below about the robustness and inclusiveness of our method of estimation of MPI over NHDR (2014) and Alkire, Roche, et al. (2011) in the context of Nepal, which is also applicable in the global context. This study has largely benefited from the conceptual and methodological advancements made in recent studies (e.g., Guio et al., 2012; Guio et al., 2016; Notten & Mendelson, 2016). We also disaggregated multidimensional poverty estimates by place of residence, developmental region, ecological zone, and subregions.
Data
This study has used data from a nationally representative Nepal Demographic Health Survey (DHS) collected in 2010-2011. The sample was designed to provide estimates of most key variables for the 13 ecodevelopment regions and three ecological regions (for further details on sampling design, see Ministry of Health and Population [MOHP], New ERA, & ICF International, 2012). The survey covered a nationally representative sample of 10,826 households, which yielded completed interviews with 12,674 women aged 15 years to 49 years in all selected households and with 4,121 men aged 15 years to 49 years in every second household. What is of particular interest to this study is that these data provide detailed information on mortality, nutrition, sociodemographic characteristics, access to basic amenities, and household assets. Furthermore, we have used income poverty and multidimensional poverty information from CBS (2011) and NHDR (2014), respectively, in the validity test of MPI items chosen for this study.
Measure of Multidimensional Poverty: Rethinking Dimensions and Computation
We have estimated MPI using information from indicators of three main dimensions—education, access to health, and standard of living. However, within these dimensions, our indicators are not the same as used by Alkire, Roche, et al. (2011) and NHDR (2014).
The dimensions and indicators within each dimension are presented in Table 1. We have described the measurement of dimensions and indicators below. The previous studies have used both theoretical and empirical criteria in identifying suitable items to be included in the MPI (Dickes, 1989; Eurostat, 2002; Guio, 2009; Perry, 2002; Whelan, 1993). In this study, suitability is theoretically derived as aptness to reflect low well-being of people across the different provinces of Nepal. Each indicator within a specific dimension was selected based on reviews of extensive literature in the context of Nepal. For example, in the case of the first two dimensions, suitable items were selected qualitatively that represent a single latent dimension: education or health. However, the next dimension, standard of living, was derived based on factor analyses because there were a large number of items that represented different kinds of material deprivations. Thus, it was important to confirm whether they were suitable to and representative of a single latent dimension of the standard of living or not. For each of these three aspects, item selection criteria were not only drawn from the literature on theoretical basis, but also empirically tested. The items that have successfully passed principles of reliability were then used in aggregation to MPI (Table 1). In addition to this, we have also tested for validity. However, in absence of income data in the same data set, we have assessed it through the macrolevel correlation between individual MPI components and income poverty levels (Figure 1).
Dimensions, Indicators, and Measures of MPI and Their RCs.
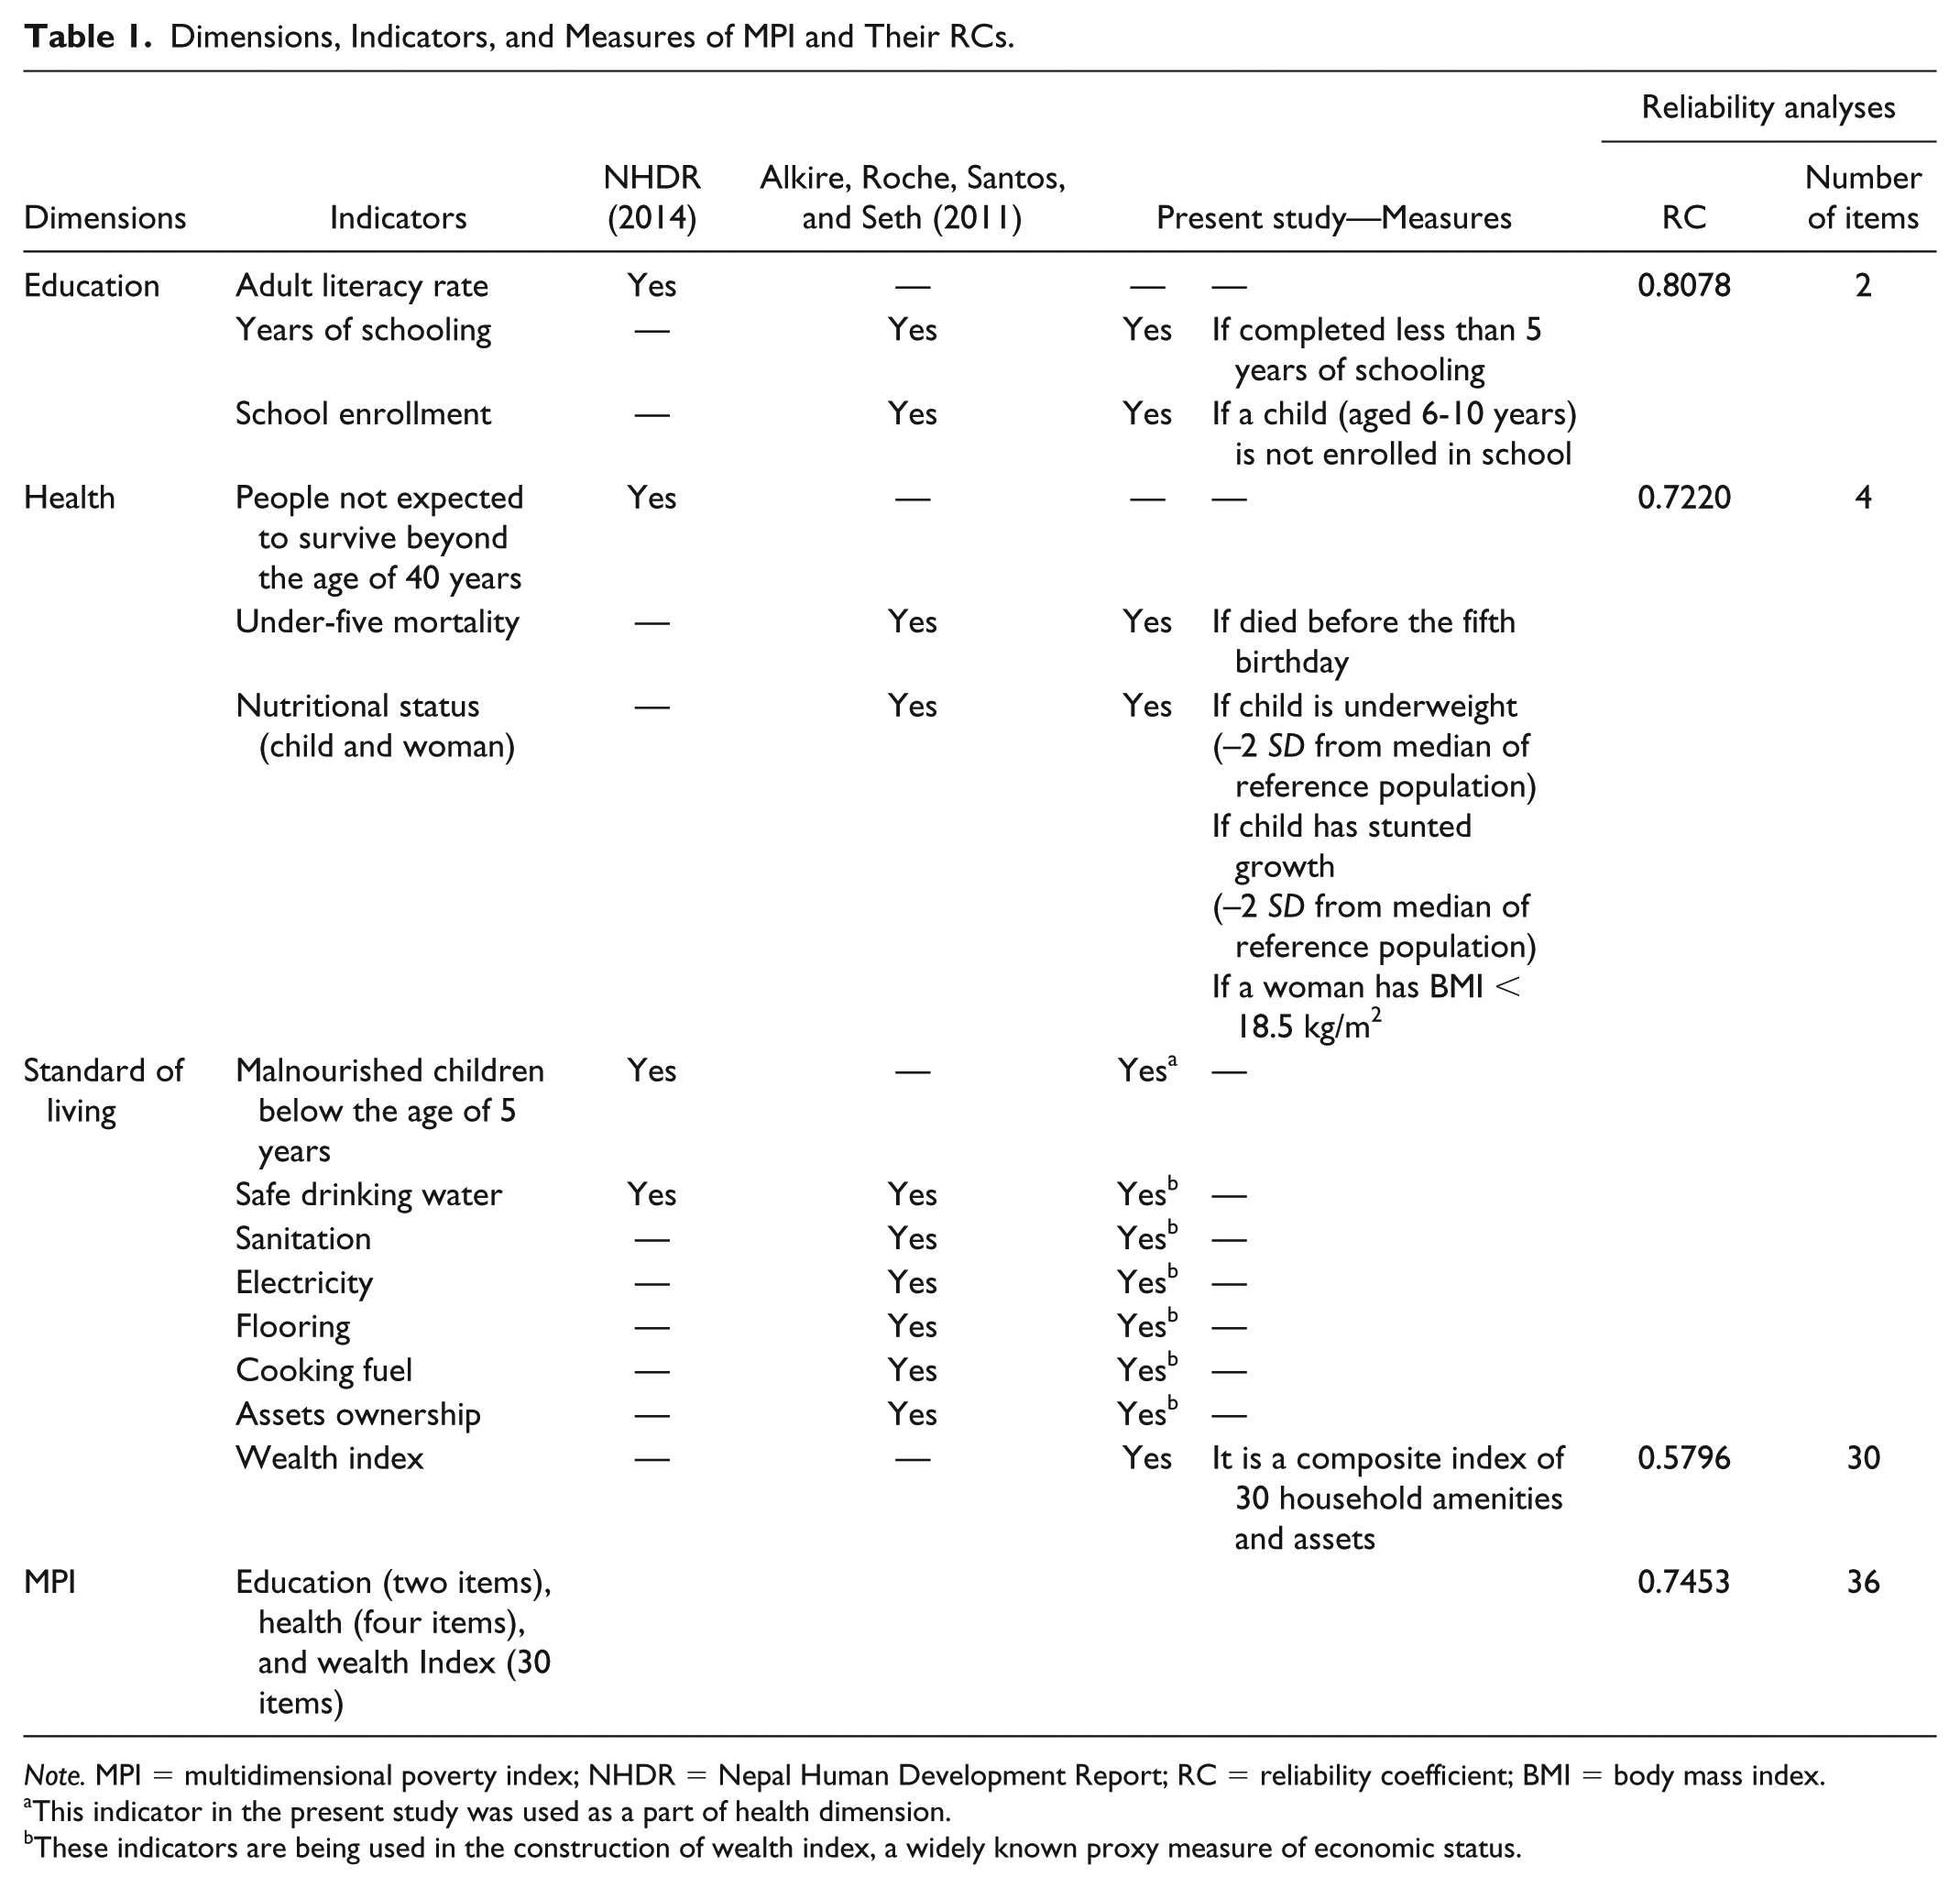
Note. MPI = multidimensional poverty index; NHDR = Nepal Human Development Report; RC = reliability coefficient; BMI = body mass index.
This indicator in the present study was used as a part of health dimension.
These indicators are being used in the construction of wealth index, a widely known proxy measure of economic status.

Correlation matrix for the different components of MPI with income-based poverty.
Education
NHDR (2014) used adult literacy rate for measuring educational deprivation. This measure has been severally criticized for being not a true indicator of measuring educational deprivation (Smith, 1992; UNDP, 1993). Therefore, studies are increasingly using years of schooling and school enrolment to measure educational deprivation. Alkire, Roche, et al. (2011) used both years of schooling and school enrolment as indicators of educational deprivation. While the present study also uses years of schooling and child enrolment ratio, but unlike Alkire, Roche, et al. (2011) who used gross enrolments, we have used net enrolments. We used net enrolment to overcome the limitations of gross enrolment ratio, which could be more than 100% and often fails to measure the true enrolment ratio. Reliability analyses for the items included in the dimension of education suggest a high reliability coefficient (RC = 0.8078), meaning that items considered under education dimension probably measure the same underlying latent concept “education.”
Health
While NHDR (2009) used percent of people not expected to survive beyond 40 years of age as an indicator of health status, both Alkire, Roche, et al. (2011) and we used two indicators of health: under-five mortality status and nutritional status.
Under-five mortality is measured as whether a child experienced death before his or her fifth birthday. Our other measures of health are the nutritional status of the child and the mother. The most convenient and standard method of measuring nutritional status of a child is his or her physical growth or the weight-for-age. This index provides information about growth and body composition and is measured in terms of standard deviation units (Z scores) from the median of the reference population. In addition, we have also considered height-for-age of children below 5 years of age to represent chronic undernutrition. Children whose standard score (Z score) of weight-for-age (underweight) and height-for-age (stunting) is below minus two standard deviations (–2 SD) from the median of the reference population are considered as malnourished. For analysis, a dichotomous variable whether an under-five child’s growth was below −2 SD (coded 0) or above −2 SD (coded 1) for weight-for-age and height-for-age was created.
Mother’s nutritional status is measured by body mass index (BMI). The BMI is categorized into three components: thin (BMI < 18.5), normal (BMI between 18.5 and 24.9), and obese (BMI > 25). In this study, we considered thin women with a BMI less than 18.5 as malnourished. Our indicators are same as taken by the Alkire, Roche, et al. (2011). In the case of the dimension of health, reliability analyses for the items included reveal a high RC (.7220), meaning that items considered under health dimension probably measure the same underlying latent concept “health.”
Wealth Index
Household wealth index is used as an indicator of standard of living. Wealth index is commonly used in DHS country-level studies and considered as a most reliable summary measure (Rutstein, Jhonson, & Gwatkin, 2000). For the purpose of this study, wealth index computed in Nepal DHS (2011) has been considered as an indicator of standard of living. The coverage of wealth index (MOHP, New ERA, & ICF International, 2012; Rutstein, 1999, 2008) is much more than the six standards of living indicators (i.e., access to safe water, sanitation, electricity, flooring, cooking fuel, and assets ownership) used by Alkire, Roche, et al. (2011).
The wealth index in its current form, which takes a better account of urban–rural differences in the scores and indicators of wealth in the Nepal DHS (2011), is created in three steps. First, a subset of indicators common to urban and rural areas was used to create wealth scores for households in both areas (for a detailed list of indicators see MOHP, New ERA, & ICF International, 2012; Rutstein, 2008). Categorical variables were transformed into dichotomous (0-1) indicators. These indicators were then examined using principal component analysis (PCA) method to produce a common factor score for each household. Second, separate factor scores were produced for households in urban and rural areas using an area-specific indicator. Third, the separate area-specific factor scores were combined to produce a nationally applicable wealth index by adjusting area-specific scores through a regression on the factor scores. This three-step procedure permits greater adaptability of the wealth index in both urban and rural areas. The resulting combined wealth index has a mean of zero and a standard deviation of one.
Once the index is computed, national-level wealth quintiles (from lowest to highest) were obtained by assigning the household score to each de jure household member, ranking each person in the population by his or her score, and then dividing the ranking into five equal categories, each comprising 20% of the population. In this study, bottom two quintiles, poorest and poorer (40%), form the poor. This classification is widely accepted in demographic research because it has been repeatedly proven in the DHS data–based analyses that these two quintiles show deprived status in several demographic indicators than other three quintiles (Rutstein, 2008).
The wealth index is particularly valuable in countries, which lack reliable data on income and expenditures, which are the traditional indicators used to measure household economic status (Chakraborty, Fry, Behl, & Longfield, 2016). For developing countries such as Nepal, with extreme geographical difficulties, high poverty incidence, and not so strong statistical information system, wealth index may serve a better purpose for measuring economic status (standard of living) than direct income (Gwatkin et al., 2007; Rutstein & Johnson, 2004). However, the recent studies (Guio et al., 2012; Guio et al., 2016) have suggested for testing the reliability and validity of dimensional structures and suitability of items used in the construction of material deprivation index such as wealth index. Following them, we have performed the reliability analyses for the 30 items used in the wealth index construction. The results of reliability analyses suggest, although slightly less, but a satisfactory RC (0.58) between the items selected, meaning they correlate to an assumed latent concept of “standard of living” in the study.
Estimation of MPI
Compared to the initial period of Townsend (1979) and Foster et al. (1984), the measure of multidimensional poverty has been advanceing in terms of its dimensional spread and the number of items used in each dimension. In particular, the introduction of the DHS, a homogeneous and reliable household survey over 80 developing countries, has facilitated the researchers to construct the index on unit-level data sets using a wider number of indicators related to both households and individuals. The global MPI becomes widely used measure since 2010 after its regular publication in human development reports of UNDP. Alkire, Roche, et al. (2011) have estimated global MPI using three dimensions: education, health, and living standard. As per this approach, a person on each indicator is identified as deprived or not deprived using information for any one household member. Then, it is aggregated across all the household members. This criterion of identifying poor and calculating MPI in their method has serious drawbacks. Researchers have often raised questions about measurability and aggregation process of indicators in the method of MPI calculation proposed by Alkire and her colleagues (Rangarajan & Dev, 2015). For instance, if one person in a household is undernourished that does not mean all household members are undernourished. Similarly, if one child has not attended school for 5 years or more that does not mean that other children did not go to school. Moreover, in the case of under-five mortality, if a household does not have under-five children, such households will not be included in that particular dimension of MPI. According to Nepal DHS (2011), the proportion of such households was as high as 11%. This is the main reason that Rangarajan and Dev (2015) have not estimated MPI using Alkire, Roche, et al.’s (2011) identification approach for neighboring developing country “India.” Rangarajan and Dev (2015) also questioned the aggregation method of individual- and household-level indicators by Alkire, Roche, et al. (2011). Some of the recent studies by Guio et al. (2016) and Notten and Mendelson (2016) have made conceptual and methodological advancements in the construction of material deprivation index like one which similar to MPI.
We concur with Rangarajan and Dev (2015), Guio et al. (2016), and Notten and Mendelson (2016), and therefore, made some modifications in Alkire and others’ criterion of aggregation of dimension indices to overcome the above-said limitations. In particular, we have estimated indicators at the population level for rural–urban, ecological zones and subnational level instead of household level in all three dimensions, namely, health, education, and standard of living. This method has merit over the previous method for two reasons. First, when we estimate child nutritional and child mortality indicators with the entire sample of child population as a denominator instead of households, it will overcome the limitation of excluding the households, which do not have under-five children at the time of the survey. Second, this process avoids the duplication of deprivation in terms of health and education across household members. In the case of the index of standard of living, we have estimated it at the household level and generalized the household index value to all the household members living in that particular household by exporting this variable to person file.
While estimating the composite index, the UNDP (2010) human development report used geometric mean (GM) to obtain HDI. We believe that this method of estimating GM of each dimension of indices (education, health and standard of living) is a better procedure to derive MPI rather than the simple mean as used by Alkire and Foster (2007) and Alkire, Roche, et al. (2011). Because GM makes sure that a low achievement in one dimension is not linearly compensated by high achievement in another dimension. The GM reduces the level of substitutability between dimensions and at the same time ensures that 1% decline in the index, say, life expectancy at birth has the same impact on the MPI as 1% decline in education or income index.
Thus, we estimate MPI using GM method by the following:

where EPI is education poverty index, HPI is health poverty index, and SLPI is the standard of living poverty index. For comparison, we also estimated MPI using simple mean by the following:

Thus, our methodology is different from Alkire, Roche, et al. (2011) and NHDR (2014) in terms of indicators used, estimation and aggregation approach. NHDR (2014) used traditional indicators to measure human poverty index, which is severely criticized by the scholars now (Dhongde & Haveman, 2017; Dutta, 2015; Gordon, 2000; Mitra, 2016; Rogan, 2016; Rutstein, 2008; Wang & Wang, 2016). For instance, NHDR (2014) used adult literacy rate for education; percentage of people not expected to survive beyond 40 years of age (life expectancy) for health and percentage of people not having access to safe drinking water and child undernourishment for the standard of living. The adult literacy rate is replaced by the mean years of schooling at UNDP HDI because it does not depict the current scenario of educational attainment in a country or state. Therefore, UNDP includes school enrollments, which represent current scenario. We considered both mean years of schooling and net school enrollment ratio. Among health indicators, NHDR (2014) fails to take more sophisticated and sensitive measures such as child mortality and nutrition. Standard of living poverty is measured by deprivation in access to drinking water, which is acceptable; but the inclusion of child undernourishment cannot be justified to be included in the standard of living poverty unless they had tested for its suitability and reliability in this dimension. It also fails to incorporate several other important variables under the dimension of the standard of living: sanitation, electricity, housing, and many others. Therefore, our indicator, especially in the case of the standard of living poverty (measured as wealth index), which incorporates multiple household assets, is a better indicator.
From methodology (dimensional structure and aggregation process) point of view, we differ with Alkire, Roche, et al. (2011) on three points: number and type of indicators, their estimation procedure, and process of aggregation of dimension indices used in the computation of MPI. In terms of indicators, we differ only at three places. First, we have used net enrollment ratio rather than gross enrollment ratio in the education dimension, an additional indicator height-for-age under nutritional status of children under health dimension and wealth index based on 30 assets instead of Alkire and colleagues’ standard of living index based on six indicators. Second, we also differ with Alkire and colleagues in terms of estimation procedure of individual indicators. They have estimated deprivation basically at a household level even for indicators, which conventionally supposed to be estimated at the individual level. However, we estimated each indicator based on the nature of indicator and considered the unit of analysis accordingly, that is, if it is an individual kind of variable then measured at the individual level or if it is household variable then measured at the household level then the score distributed among the household members.
Results
Descriptive Statistics
Table 2 presents descriptive statistics of indicators covered under each dimension of MPI by place of residence, ecological regions, developmental regions, and ecodevelopment subregions. The descriptive statistics show a large difference in each of the specific indicators of all three dimensions of MPI, namely, education, health, and standard of living.
Descriptive Statistics of Indicators, Nepal, 2011.

Source. Author’s calculations based on Nepal DHS 2011 data.
Note. BMI = body mass index; LL = lower limit; UL = upper limit; Nepal DHS = Nepal Demographic Health Survey.
Distribution of indicators by geographic regions: Education
By place of residence, about 54.4% people do not complete 5 years of schooling in rural areas as compared with 32.2% in urban areas. On the contrary, children between 6 years and 10 years of age not enrolled are 7.7% in rural areas as compared with 3.1% in urban areas. The result shows a huge gap in rural–urban educational poverty.
Differences were also observed across ecological zones (namely, mountain, hill, and Terai). A large number of people across the ecological regions had less than 5 years of schooling. The figure varies from 48.0% in hills to 59.1% in the mountain areas. Surprisingly, children not enrolled (age 6-10 years) reflects the reverse situation. The highest number of children not enrolled (age 6-10 years) found to be the highest in Terai region (10.63%) and lowest in mountain region (1.40%).
By development regions, the highest proportion of individuals with less than 5 years of education were reported in the mid-western development region (55.5%) followed by far-western region (54.4%). The lowest proportion was found in the eastern and western development region (47.7%). Except for central region (13.50%), in other regions children not enrolled (age 6-10 years) were below 10%. The far-western region recorded the lowest (2.60%) number of children not enrolled (age 6-10 years).
Further disaggregation based on ecodevelopmental region suggests that individuals had less than 5 years of education in the central mountain (63.7%), western mountain (60.5%), far-western hills (56.8%), and central Terai (61.2%) are considerably high. On the contrary, the proportion of children not enrolled in school was the highest in central Terai (19.1%) followed by eastern Terai (6.9%) and western Terai (5.6%). These results show that there is variation in educational poverty by rural–urban residence, development regions, and ecodevelopmental subregions.
Distribution of indicators by geographic regions: Health
By place of residence, among health poverty indicators, as far as under-five mortality is concerned, both rural (4.7%) and urban (4.0%) areas still face a dearth of health facilities as reflected in high under-five mortality. Gaps are noticeable in the case of nutritional indicators also. More than one third of total children in rural areas are poor regarding nutritional status whereas in urban areas around one fourth of total children are poor. However, as compared to children, nutritional status of adult females is slightly better. As per our estimates, 18.5% females in rural areas and 13.5% females in urban areas have poor nutritional status.
By ecological regions, we found maximum adult females with BMI < 18.5 in the Terai region (22.5%), but children with poor nutritional status were maximum in the mountain region (height-for-age 52.8%; weight-for-age 35.5%). Under-five mortality was the highest in the mountain region (6.4%). As against this, hills were found to be the least poor in terms of select health indicators.
Among developmental regions, broadly mid- and far-western region show the greatest extent of deprivations on an average in all health indicators. In the case of under-five mortality and adult females with BMI < 18.5 found to be highest in the far-western region (mortality < 5%-6.60%; and BMI < 18.5%-23.6%). On the contrary, height-for-age and weight-for-age are the highest in the mid-western region (height for age 49.0%; weight for age 36.2%).
In the case of ecodevelopmental subregion, western mountain region has experienced the highest number of under-five deaths (7.9%) and underweight children (41.0%). However, central Terai region had the highest number of adult females with BMI < 18.5 (25.9%). Under-five mortality was the least in the western Terai (3.20%), whereas underweight children and adult females with BMI < 18.5 were the lowest in the western hill. Thus, there is no single subregion, which has performed better in all health indicators.
Distribution of indicators by geographic regions: Standard of living
By place of residence, huge poverty differences are evident in rural–urban areas in the case of wealth status. The share of poorer and poorest in terms of wealth status is more than 7 times in rural areas than urban areas. About 6.3% people are found to be in poorer and poorest wealth quintile in urban areas as against of 44.6% in rural areas.
By ecological regions, high variation was noticed in the case of wealth status. Around 71.8% people are poor in mountain region followed by hills (52.5%) and Terai region (25.5%). Wealth poverty is 3 times higher in mountain region than Terai.
In the case of developmental regions, the incidence of wealth poverty was just double in the mid- and far-western regions as compared with other developmental regions. About 60% people were poor in terms of wealth in mid- and far-western regions as compared with around 35% in other three regions. This indicates the unequal distribution of wealth across developmental regions.
Things are not different in ecodevelopment subregions. The degree of variation in wealth poverty can be imagined from the number of people belonging to poor and poorest wealth quintile ranges from 16.1% (eastern Terai) to 84.3% (western mountain). Far-western hills (79.4%) and mid-western hills (72.9%) were other two subregions with huge wealth poverty. All Terai-related subregions exhibit low wealth poverty.
MPI
Table 3 provides estimates of MPI by place of residence, ecological regions, development regions and subregions.
Multidimensional Poverty by Place of Residence, Nepal, 2011.
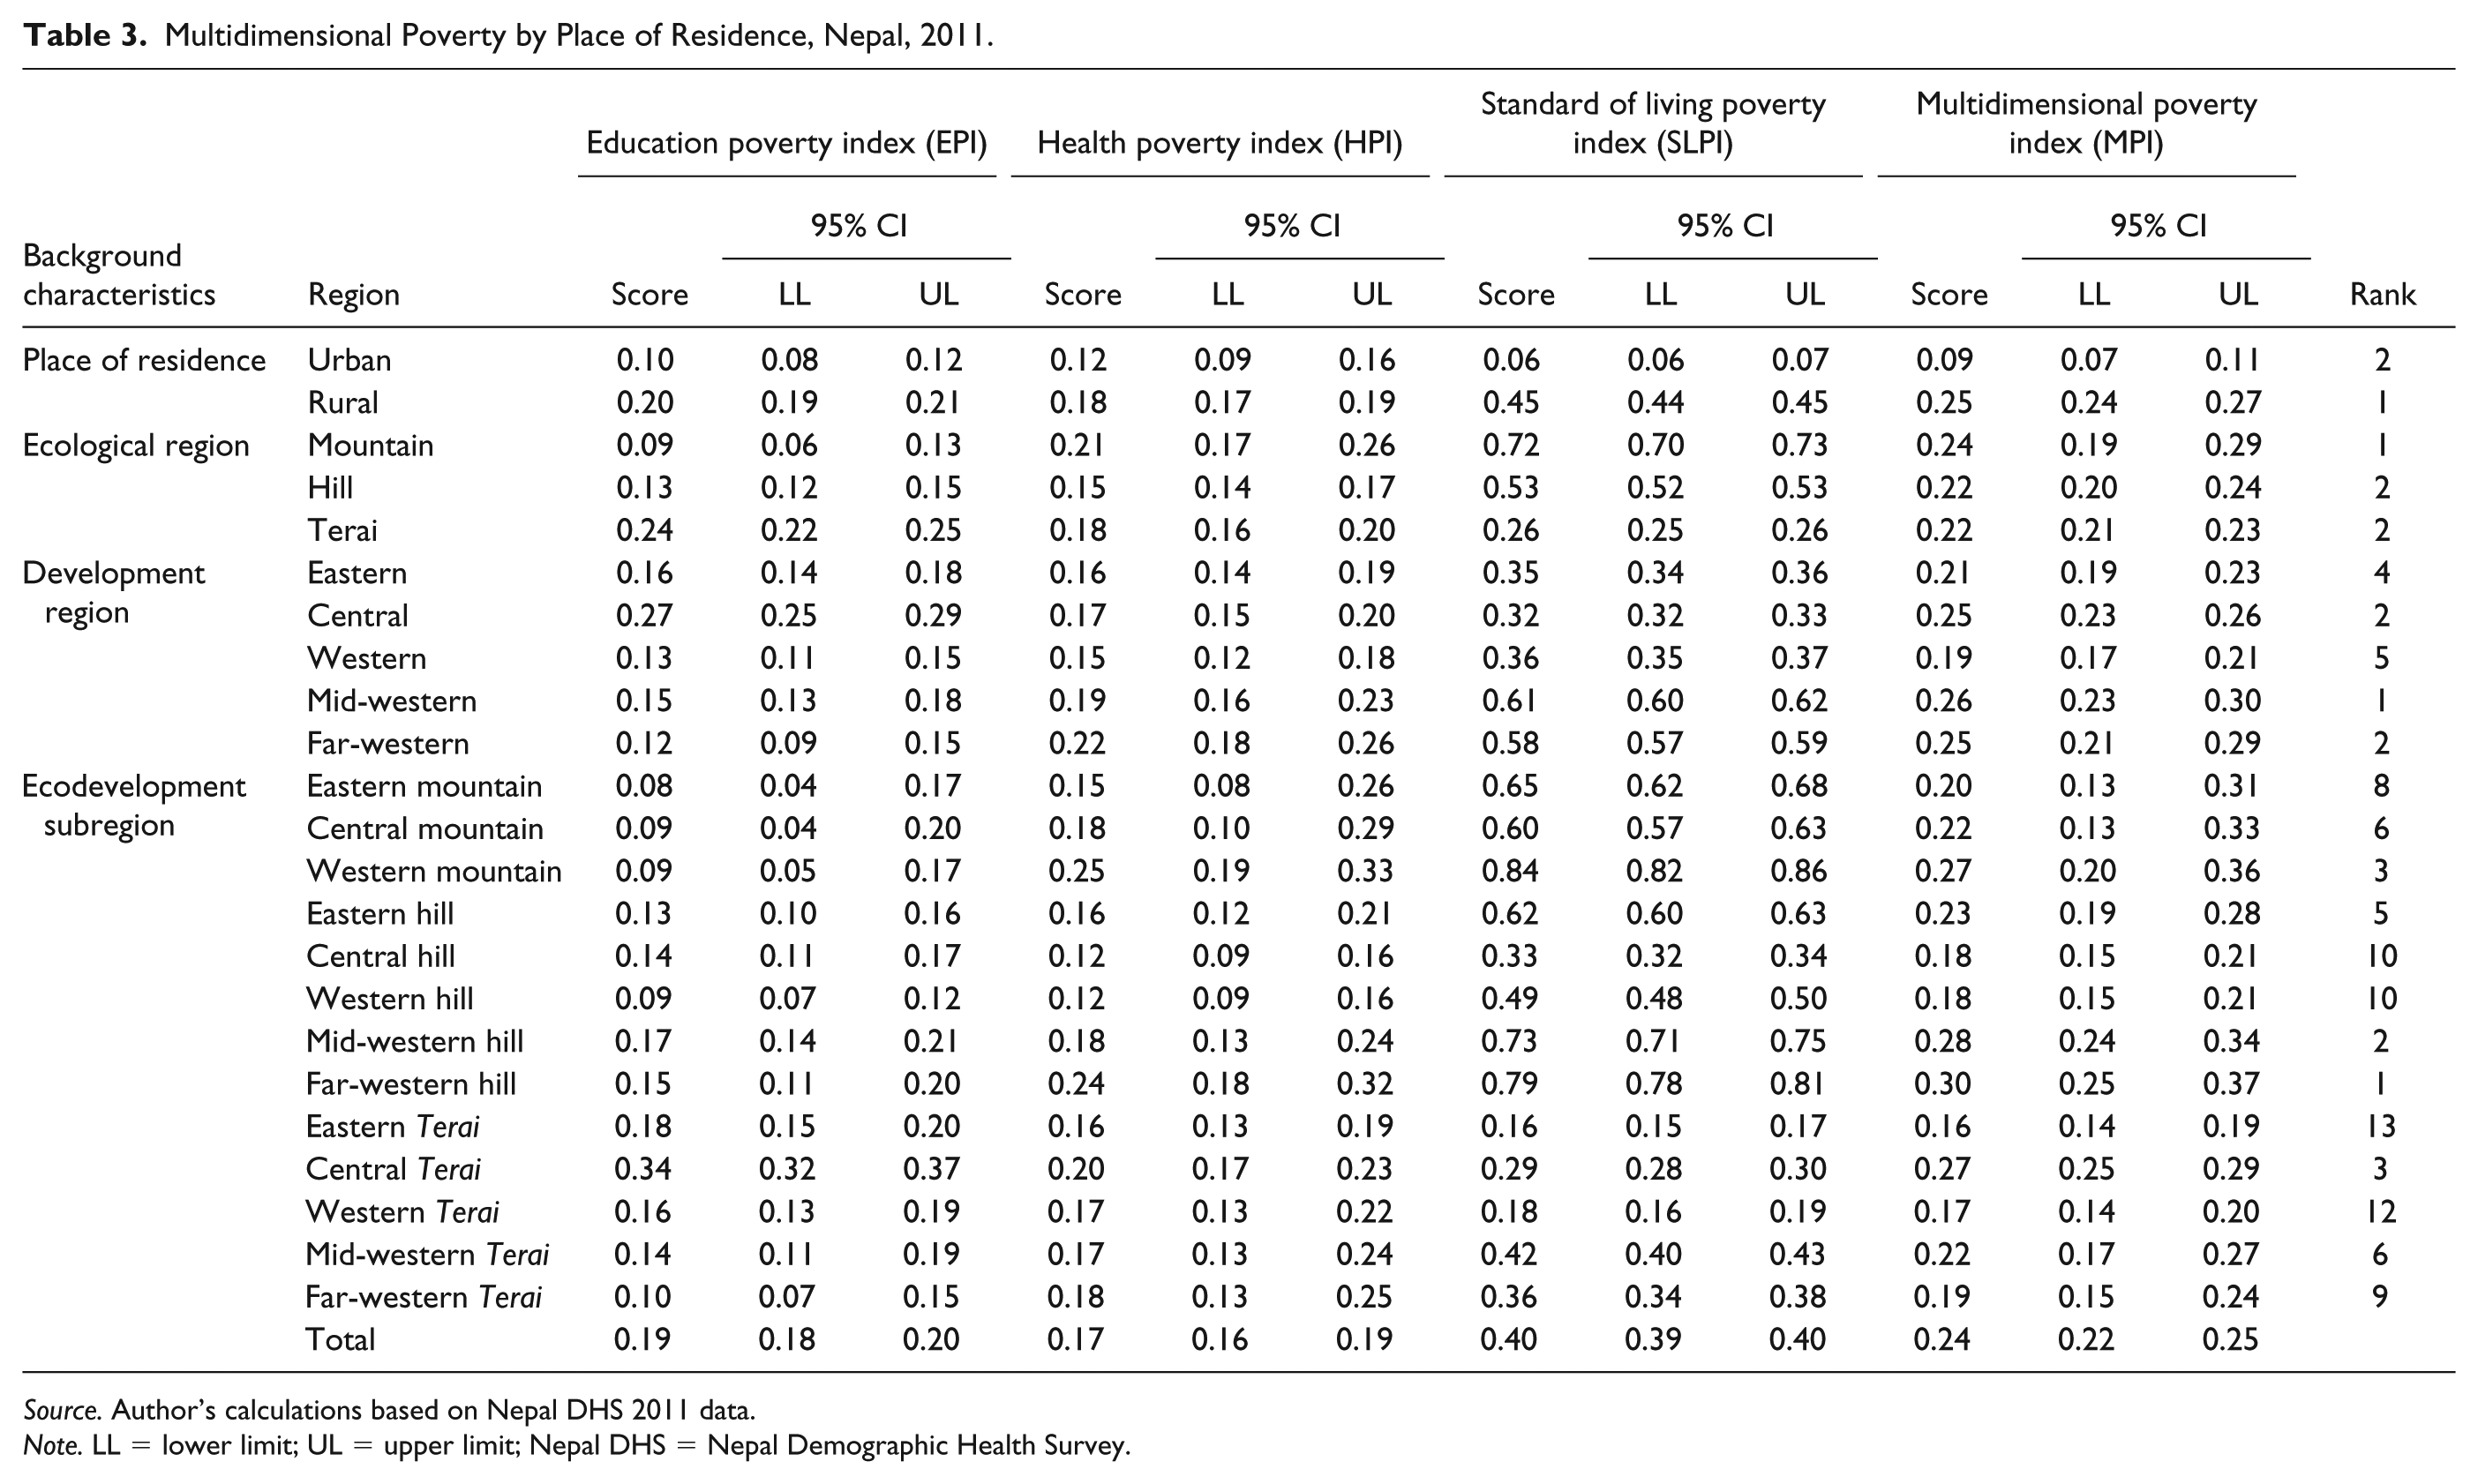
Source. Author’s calculations based on Nepal DHS 2011 data.
Note. LL = lower limit; UL = upper limit; Nepal DHS = Nepal Demographic Health Survey.
MPI by rural–urban place of residence
Overall MPI estimate for rural areas (0.254) is about 2.5 times greater than in urban areas (0.091). While 25% people in the rural areas are experiencing multidimensional poverty, this proportion is only 10% in the urban areas. Specifically, the results show that rural areas are at a disadvantageous position in comparison with urban areas in all three dimensions, namely, education, health and wealth status. The highest difference in rural–urban poverty was found in wealth status. Poverty in terms of wealth status in rural areas (0.446) is nearly 7 times higher than their urban counterparts (0.063).
MPI across ecological regions
Estimates by ecological region reveal that MPI is the highest in the mountain region followed by hills and Terai regions. Surprisingly, educational poverty is the highest in the Terai region (0.237). Again, stark differences can be noticed in the case of wealth poverty. About three fourth people are poor in mountain region as compared with only one half and one fourth in hill and Terai regions, respectively.
MPI across development regions
The results of MPI by the development region reveal that mid-western (0.262) and far-western (0.247) regions have the highest incidence of poverty, whereas, western region (0.188) has the least. Educational poverty is the highest in the central region (0.269) followed by the eastern region (0.1560). Here again, the educational poverty is found to be the lowest (0.119) in the far-western region, but in contrast to it, this region has the highest health poverty (0.219) and second-highest standard of living poverty (0.579). Similar trends for enrolment were also observed under different survey reports (Asia-Pacific Cultural Center for UNESCO [ACCU], 2001; Ministry of Health and Population et al., 2012; NLSS, 2011). However, differences in health poverty among other regions than far-western are not very significant. But pronounced divergence can be noticed again in the case of poverty in terms of standard of living. Poverty in terms of standard of living is nearly double in mid-western (0.612) and far-western (0.579) regions as compared with other three regions. Furthermore, differences can also be seen in the overall MPI score by developmental regions.
MPI across ecodevelopment subregions
Table 3 presents the MPI and relative rank of subregions. Far-western hill is the poorest (0.305) among all followed by mid-western hill (0.283). Trends in the individual dimensions suggest greater variations in the case of educational and standard of living poverty. Poverty differences between least and most educationally poor are 0.260, whereas in the standard of living poverty are 0.682. However, differences are much less in the case of health poverty, which is only 0.131. Standing of subregions in terms of individual dimensions also differs significantly. For instance, central Terai (0.342) and estern mountain (0.082) in education, western mountain (0.254) and western hill (0.122) in health and western mountain (0.843) and eastern Terai (0.161) in the standard of living poverty are the most and least poor regions, respectively.
Income-Based Poverty Versus Multidimensional Poverty
In this section, we compare the income-based poverty measure with MPI. Poverty is the lack of resources over time, whereas MPI is a consequence of deprivation in various resources. There is a complementary and dynamic relationship between these two indicators. In developed countries context, considerable variation were observed between income-based poverty estimates and MPI, although the relationship is strictly not linear. Both Peter Townsend (1979) and Mack and Lansley (1985) used the relationship between income and deprivation to choose their MPI items (cited in Guio et al., 2016). But existing literature in developing countries such as Nepal hardly gives any evidence on the nature of the relationship between income poverty and multidimensional poverty. This study fills this decisive gap. Table 4 compares estimates of multidimensional poverty estimates from our study (by the arithmetic mean method and GM method) with income-based poverty estimates by CBS (2011) and Nepal human poverty estimates by NHDR (2014). Our estimates of overall MPI (GM) are similar to income-based poverty. For instance, 23.64% people are poor as per our estimates, and the corresponding figure by income-based measure is 25.2%. This provides a kind of validation to our results.
Income-Based Poverty Versus Multidimensional Poverty in Nepal, 2011.

Source. aAuthor’s estimates based on Nepal DHS 2011 data. bCBS (2010-2011), Nepal. cNHDR, 2014.
Note. AM = arithmetic mean; GM = geometric mean; NHDR = Nepal Human Development Report; Nepal DHS = Nepal Demographic Health Survey; CBS = Central Bureau of Statistics.
Meanwhile, MPI estimates by the arithmetic mean are similar to NHDR (2014) estimates. As per NHDR (2014), poverty is 31.1%, whereas as per our estimates, it is 30.39%. Rural–urban poverty differences by MPI (GM) are about 15%, which is around 12% in the case of income-based poverty by CBS (2010-2011). Our poverty estimates for the urban area (9.11%) show lesser poverty as compared with CBS 2010-2011 (15.5%) and NHDR (2014; 18.5%) but in the case of rural poverty, the differences are not very significant between our estimates (25.38%) and CBS 2010-2011 (27.4%). However, rural poverty shown by NHDR (2014) is about 10% higher than our MPI (GM) estimates. In the case of classification based on ecological regions, mountain region showed the highest poverty by all measures, but high variability in estimates across the methods is visible. Only 23.91% people are experiencing multidimensional poverty as per MPI (GM) whereas the corresponding figure by MPI (arithmetic mean) is 43.24%, by CBS 2010-2011 is 42.3% and 38.5% by NHDR (2014). The same is the case with hill and Terai regions. A similar contrast in terms of variability of estimates by different methods is also visible in development regions.
In the case of subregions, there is a change in relative position of subregions in terms of least and most multidimensional poor. As per MPI (GM), far-western hill subregion (30.50%) is the region with the highest multidimensional poor and eastern Terai (16.48%) is the subregion with least multidimensional poor. On the contrary, far-western hill (42.1%) and central hill subregions (24.7%) were the most and least multidimensional poor, respectively, as per NHDR (2014).
Overall, compared to developed countries, in Nepal, we found less variation in the levels of income-based poverty and multidimensional poverty (Figure 2). This may be because with an increase in absolute income levels with economic growth, the relative disparities in material access increases. With the introduction of every new technology and resources, richer tend to access faster than their counterpart, thus, leads to rising disparities, which also give rise to increase in relative deprivation or poverty (Deaton, 2013). However, in low-income countries still, the overall material access relative to developed countries is less. Therefore, there is less gap between incomes-based poverty and multidimensional deprivation.

Relationship between MPI and income-based poverty.
Discussion and Conclusion
Unlike several recent studies on multidimensional poverty, which used global MPI procedure of estimation, we have proposed an alternative approach for measuring MPI. In this approach, poverty in terms of each indicator has been measured at the individual level rather than at household level. Moreover, the aggregation procedure used in this study is similar to the procedure used in HDI calculation. As pointed out in the methods section, this procedure overcomes the limitations of global MPI used by UNDP-HDR reports. Our results are methodologically robust in terms of both numbers of indicators taken for each dimension and method of aggregation. Our methodological improvements show that current methodology of estimating multidimensional poverty particularly in the case of Nepal tends to deflate poverty numbers by a significant margin. For instance, multidimensional poor by GM aggregation method in this study is 24% against 44% in Alkire et al. (2013) in case of Nepal. However, we have no doubt in the fact that there is scope to improve the measure further given the availability of data, especially, on the new forms of assets and direct income information in the same data set.
The estimates at subnational level suggest that geographical location still works as a major determining factor in poverty as mountain region has the highest multidimensional poverty. The disparity between rural and urban poverty is significant. Despite substantial progress in the reduction of income poverty in recent years, multidimensional poverty in rural areas of Nepal remains slightly higher. It may have serious implications because more than 80% of the population in Nepal still lives in rural areas. However, a careful observation of different dimensions of multidimensional poverty shows that it is the rural deprivation in the standard of living, which is a major contributor to rural–urban differences in the total MPI. These results are in tune with some of the previous studies (Bhurtel, 2013; Jerve, 2001; NHDR, 2009; Wagle, 2007), which also noted the poor standard of living in rural areas, which contributes majorly to multidimensional rural poverty in the country.
However, the education status seems to be not related to the geographical location as our study indicates the highest net enrollment in the mountain region followed by hills and Terai regions, whereas the NHDR (2014) shows that hills have the lowest educational poverty. The educational poverty seems to be indicator sensitive where NHDR (2014) poverty index takes illiteracy rate into consideration; the present study has taken years of schooling and net enrollment ratio, which are better indicators than adult literacy and gross enrollment ratio. Similar contrasting results in educational poverty are also observed by development regions and subdevelopment regions. These results assume greater importance in the context where Nepal government fixed their targets of educational attainment under development plans in terms of enrollment ratios, not literacy; our results provide more robust basis for effective policy planning and implementation. The results are also robust because regions with a high number of children not enrolled (6-10 years of age) coincide with the high number of people attending less than 5 years of schooling.
It is also noticeable that educationally poor regions (Terai) are the regions, which border with the most backward states (Uttar Pradesh and Bihar) of the neighboring country “India” regarding education and economic progress. There may be some common explanations and linkages behind the low development process in the regions, which require deeper empirical investigation (Samuels, Nino-Zarazua, Wagle, Sultana, & Sultana, 2011; Srinivasan, 2012). One possible explanation is that migration is very high in the Terai region (49% highest among all regions), especially, the male migration (49.8%), which is also the case with neighboring Indian states (Nepal DHS, 2011). Nepalese leave their homes at an early age in expectation of earning a livelihood and, thus, do not give due attention to educational attainment (Samuels et al., 2011).
Although interregion differences can be noticed in health poverty, it is comparatively lesser than educational and standard of living poverty. The heavy presence of international agencies, that is, International Center for Integrated Mountain Development (ICMOD), World Health Organization (WHO), and United Nations Children’s Fund, and so on and the introduction of many health-related progressive schemes by the Nepal government in the last two decades have brought the much-needed improvement in health status across all the regions, especially in the disadvantageous regions such as mountain (Bentley, 1995; Engel et al., 2013). Engel et al. (2013) noted, A consistent policy focus and sustained financial commitment by the government and donors throughout the past two decades, including substantial increases in funding for maternal health since the early 1990s, has allowed for widespread improvements in access to medical services, particularly in remote areas.
Thus, Nepal’s experience in the health sector can provide important lessons for other developing countries, especially, the South Asian Association of Regional Cooperation (SAARC) nations struggling with high levels of maternal mortality and poor health facilities, mainly within a circumstance of difficult terrain and high-income poverty.
Regarding wealth status, poverty levels are higher across all the regions. The high poverty in terms of wealth status indicates poor conditions of housing, sanitation, electricity, drinking water, and other basic amenities. Wealth poverty contributes to significant differences in the overall multidimensional poverty of different place of residence and regions. Wealth poverty in rural areas is 7 times higher than urban areas, whereas it is 3 times higher in mountain than Terai region. Similarly, it is almost double in the far-western and mid-western region as compared with other developmental regions. Stark differences were also observed across the subregional classification. These findings from the study are corroborated by other studies, which also noted the significant rise in income and wealth inequalities during last three decades across the rural–urban regions (NHDR, 2014; Wagle, 2007; World Institute for Development Economics Research [WIDER], 2005; World Bank, 2006). Bhurtel (2013) argued that it implies two things: First, the labour share of the national income has declined over time while the share of capital has rapidly increased. The dull growth of agriculture and stagnant manufacturing has mainly contributed to the growing economic inequalities. Secondly, the government (Nepal) has failed to take fiscal measures to reduce income inequality. Monetary measures such as providing cheap and easy credit to the poor have been largely ineffective.
High incidence of the standard of living poverty in the mountain areas is also a reflection of poor provision of basic needs of life as well as a confirmation of the fact that natural features still are important determinant of multidimensional poverty. This also shows that the government policies in Nepal mainly focus on the economic growth and employment generation and ignore to bridge the gap between rich and poor. At the same time, the government also failed to remove income inequalities as stated in Tenth Plan document (NHDR, 2014; Wagle, 2007).
In terms of comparability across the methods, it is important to note that CBS (2011) estimates of poverty are essentially income-based poverty, which is comparable with our standard of living poverty estimates rather than overall MPI estimates. Income is the source as well as the outcome of the wealth of a household. Past wealth helps in income generation and thus generated income helps in wealth accumulation. Nonetheless, this feeding loop is based on the condition that income level must be above their consumption expenditure level. The income level of two households or individuals may be same, but their wealth level may differ significantly. Income level often does count for generational accumulation and transfer of wealth. Therefore, income may show the lesser incidence of poverty than wealth. This is exactly the case with Nepal. Poverty regarding wealth status showed the relatively higher incidence of poverty among different geographical areas (Figure 3). Even, country-level poverty in terms of wealth status differs significantly than income poverty. Our measure of standard of living poverty is comprehensive as it is based on wealth index, which has been prepared by including multiple household assets. The estimates from this study show the greater extent of wealth poverty compared with OPHI (2013). However, multidimensional poverty levels are much less than wealth index–based poverty levels, which suggest that Government of Nepal is operating a number of social security measures in the form of provision of basic education and health services to all the populations, which might work as counteracting to wealth-based deprivation.

Relationship between wealth and income poverty.
In conclusion, this study had examined the extent of multidimensional poverty in Nepal disaggregated by geographic regions. It adopted the more robust method of MPI compared with global MPI of UNDP, particularly regarding indicators, their definitions, dimensional structure, and aggregation procedure than that of the previous studies. It also took into consideration the latest methodological improvements in calculating deprivation index measures by Guio et al. (2012), Guio et al. (2016), and Notten and Mendelson (2016). To conclude, the findings of the study suggest that although Nepal has experienced a decent economic progress and a considerable reduction in education and health poverty with a considerable increase in wealth inequalities across the regions, overall MPI remains high. A far less has been achieved in the case of reducing the standard of living poverty, that is, wealth poverty and inequalities across the regions. Thus, the article suggests that development policies and poverty reduction programs in Nepal must aim to reduce multidimensional poverty by geographic regions, of which deprivation in education, health, and basic amenities must be an integral component, along with their efforts to improve economic growth and reduce income and wealth-based poverty.
Footnotes
Declaration of Conflicting Interests
The author(s) declared no potential conflicts of interest with respect to the research, authorship, and/or publication of this article.
Funding
The author(s) received no financial support for the research, authorship, and/or publication of this article.