
Abstract
Absenteeism at work, possibly leading to productivity loss in business, is related to various psychological, social, and economic factors. Since predicting absenteeism is involved with complex associations of such factors, appropriately utilizing machine learning algorithms is required in the analysis. Statistical pre-processing and applications of machine learning methods have developed the comprehensive analysis of massive social data for absenteeism. The aim of this study is to develop a quantitative approach to identify the associations of factors and classify the absenteeism by including the effect of factors in the high-dimensional data. This approach implements association analysis including odds ratio test and network analysis, and supervised learning with imbalanced classification with random forest, application of principal component analysis and penalized regression methods. The dataset in this study includes records of various types of absenteeism at workplace from July 2007 to July 2010 in Brazil. Our study shows that there exist strongly interacting factors and that specific factors are strongly associated with absenteeism. The proposed method is validated on publicly available data sets using random forest and penalized regression with k-fold cross validation in order to strengthen better generalizability. One of major findings in this study is to elucidate the associations of factors affecting absenteeism. Application to similarly structured social data improves the understanding of the complex interplay between social factors and absenteeism that are important for people analytics which can help organizations resolve management difficulties.
Keywords
Introduction
Absenteeism can be defined as taking an absence on a regularly planned workday (Riedy et al., 2020). Absenteeism is possibly related to various demographic, situational, socioeconomic factors, including transportation expense, workload, service time, age, body mass index, etc. (de Wit et al., 2018). The absenteeism may be affected by lack of educational opportunities at work, extended service time, and overwhelming work load (Aboagye et al., 2019). It has been shown that work-related absenteeism can be positively altered by the workplace’s improved work environment (Grimani et al., 2019). From a variety of public health studies, it has been proven that absenteeism at work may affect productivity loss associated with work-related features (van Den Heuvel et al., 2010). Workload and service time with emotional exhaustion may be associated with higher levels of absenteeism (Vignoli et al., 2016). It is crucial that the association of factors, or the relations between various factors and the outcome, absenteeism, should be appropriately examined and identified in terms of business and public health.
In a systematic analysis of social and psychological factors, absenteeism at work includes behaviors such as facing family-related interruptions or leaving early (Boise & Neal, 1996). Using demographic or situational information to estimate the outcome with socioeconomic status has been considered as an innovative statistical analysis to elucidate latent social and psychological factors and identify variables influencing workers’ absenteeism (Markussen et al., 2011). Absenteeism at work is a consequence of situational and environmental factors with social and psychological adjustments that may have an effect on the variables which are correlated to business growth (Hausknecht et al., 2008). Business growth is susceptible to the workers’ physical office environment, which may adversely affect productivity (Kamarulzaman et al., 2011). There is an extended literature on the management of working environment related to social and psychological effect on workers (Belloni et al., 2022). Studies have demonstrated that variables related to workplace environment and workers do not independently affect absenteeism but are strongly correlated in terms of labor economics and public health (Bubonya et al., 2017; D. W. Lee et al., 2021). Since absenteeism is a significant determinant related to the laboring processes of business, validating the associations of social factors affecting the absenteeism can estimate variables in workers’ workplace environment (Sarker et al., 2016). Therefore, it is crucial to utilize appropriate computational and statistical approaches to define complex interactions of occupational factors in various social and economic aspects.
Identifying the interactions of factors in workplace environment in the high-dimensional social data with outcomes is an emerging area in business and public health research. In the complex structures of high-dimensional social data, extracting features for the prediction of outcome is challenging. Estimating the associations of features in the high-dimensional data has been examined with machine learning methods such as penalized regression (Doerken et al., 2019; Mullah et al., 2021) with community detection (Fortunato, 2010). The network analysis of demographic, situational and social factors can not only provide the associations of strongly interacting factors but also construct a model to estimate an outcome based on relations of variables. To classify an outcome in high-dimensional setting, lasso (Wang & Du, 2019), elastic net (Goutman et al., 2022), and ridge (Xu et al., 2012) methods are utilized. To design a model to analyze high-dimensional social data, an effective and efficient statistical approach to classify the outcome considering complex interactions among high dimensional features of social and economic factors.
In this paper, a novel analytic approach is suggested in order to implement a network analysis on the integration of demographic and socioeconomic features and classify the absenteeism. The proposed approach will conduct a comprehensive computational and statistical experiment to evaluate interactions of social factors and obtain the relations between the social and psychological factors related to absenteeism. The estimated associations of features in work environment detected by the proposed methods are interpreted in the context of the business and public health literature.
Given the social and psychological relations from work environment variables related to absenteeism, the proposed methods can be applied to similarly structured workers’ demographic, situational, and socioeconomic datasets to assess health outcomes. Developing and utilizing the proposed method to examine the workers’ condition can explain how complex combinations of social and psychological factors can have an impact on absenteeism. Elucidating the patterns of associations between factors from work environment using computational and statistical methods can be bettered by considering prior knowledge in the proposed approach.
Conceptual Background
Absenteeism is an employee’s justified or unjustified absence from workplace (Putnam et al., 2004). It is expected that workers may take a certain number of absences every year. Consecutive or overwhelming absences affected by various social and psychological factors may lead to decreased productivity, influencing strategies, ethics, and other significant criteria in business (Amer et al., 2022; Bryan et al., 2021). These risk factors may indicate seasons, transportation expenses, distance from residence to work, service time, workload, age, body mass index, education level, drinking and smoking status and family-related variables. It is critical to develop and use effective and efficient methods to appropriately identify complex interactions of various demographic, situational, and socioeconomic factors and to accurately classify absenteeism by including the significant factors (Schmidt et al., 2021). The analysis of absenteeism at workplace can be performed with machine learning algorithms by including the variables of age, education, working hours, etc. (Park et al., 2024). Previous studies focus on designing a set of rules that connect factors to an outcome, absenteeism (de Oliveira et al., 2019; Rista et al., 2020).
In this study, there exist various reasons for absence such as certain diseases, pregnancy, childbirth, injury, external causes of morbidity and mortality, or factors affecting health conditions. In the data analysis of this study, the status of absenteeism is analyzed regardless of reasons for absence. There exist factors such as distance, service time, age, workload, education level, number of children, number of pets, the status of social drinking or smoking, BMI. It is significant to understand the associations of factors and the impact of factors on absenteeism (Martiniano & Ferreira, 2018). Specifically, there have been studies on relationship between alcohol consumption and workplace absenteeism (Bacharach et al., 2010; Marzan et al., 2023; S Hashemi et al., 2022). Utilizing workplace absenteeism dataset with various factors related to and reasons for absenteeism may provide significant clues about not only associations of factors and absenteeism but also co-worker support. To analyze associations of factors and absenteeism, two hypotheses will be presented and tested.
Research Model and Hypotheses
A research model with two hypotheses can be designed.
There Exists a Difference in the Structures of Networks Built Using Features Related to Drinkers and Non-drinkers
Drinkers and non-drinkers may have different characteristics or priorities in terms of social and psychological factors. The features in drinker and non-drinker groups have distinct levels of relations. In this hypothesis, the network structures built using features by drinkers and non-drinkers can be compared.
Age, Body Mass Index, and Family-Related Attributes Have a Positive Effect on Absenteeism
Various demographic, situational, and socioeconomic factors positively or negatively affect absenteeism. Machine learning methods should be utilized to estimate the impact of factors on the outcome and accurately classify absenteeism.
Materials and Methods
Data Description
The dataset (Martiniano & Ferreira, 2018) can be directly accessed via the Project DOI: 10.24432/C5X882 at https://archive.ics.uci.edu/ from UC Irvine Machine Learning Repository. Various types of absenteeism were investigated for the study of at a courier company in Brazil. The data set includes 21 categorical, integer, or real features and 740 instances.
The dataset of absenteeism at work includes an outcome and features. The outcome is a binary variable which indicates unjustified absenteeism and other cases. The features are categorial or real variables which indicates demographic, situational, or socioeconomic characteristics. In the classification of the outcome of absenteeism, association of categorical variables, association of real variables, classification of an outcome in the imbalanced data may be considered in order to better understand the structures of data and conduct the prediction of an outcome (Sowjanya & Mrudula, 2022; Zhao et al., 2018). Computing odds ratio using the contingency table for the association of categorical variables (Simon, 2001), network analysis (Luke & Harris, 2007) detecting and representing the interactions of real variables and various machine learning methods such as principal component analysis (Jolliffe & Cadima, 2016), random forest (Khalilia et al., 2011), and penalized regression (Fu et al., 2017) including Lasso, Elastic Net, and Ridge can be implemented to analyze high-dimensional data.
Estimation of Odds Ratio
An odds ratio is an estimation of association between a factor and an outcome. Odds ratio represents the possibility that an outcome may occur given a factor, compared to the possibility of the outcome occurring without that factor (Ranganathan et al., 2015). The odds ratio between the event of disciplinary failure, drinking status, or smoking status, and absenteeism is computed.
Principal Component Analysis
Principal component analysis was conducted to evaluate how unjustified absenteeism, and presenteeism or justified absenteeism groups can be classified. As an unsupervised learning method, which detects the patterns in the high-dimensional data, principal component analysis can reduce the complexity by transforming data points to lower dimensions (Lever et al., 2017). In this process, principal component analysis aims to find the axis with the maximum variance in order to minimize the loss of information. Principal component analysis projects data onto lower dimensions by summarizing the data with a limited number of principal components.
Imbalanced Data With Random Forest
Imbalanced data include the majority and minority classes possibly with misclassification (Fotouhi et al., 2019). It is crucial to investigate the effect of class imbalance in the model. In order to obtain the best balancer in the model, random Forest, an ensemble of decision trees based on the bagging strategy implementing simple random sampling method with replacement, can be utilized (Ganaie et al., 2022). To better design imbalanced ensemble learning, over-sampling or under-sampling methods are considered.
Network Analysis Using Graphical Lasso and Community Detection
The graphical lasso is a regularization technique that helps to identify a sparse inverse covariance matrix, effectively revealing the underlying structure of the data. A correlation is rigorously measured by utilizing the graphical lasso based on the partial correlation between features in work environment to build an optimized network model. Estimating the association between demographic, situational, or socioeconomic features is crucial in the network analysis. It is challenging to extract only important characteristics because all characteristics appear to have multiple connections with other features. However, using graphical lasso makes it convenient to select only significant properties (Huang et al., 2020). With a network built with n instances and p features, there exist strongly correlated features. The proposed regression model can detect the interactions between features and minimize the negative log likelihood with penalty terms to estimate the optimized regression coefficients for the analysis. The minimization formula follows Equation 1.

where S indicates empirical covariance matrix, θ indicates a nonnegative definite matrix, tr indicates the trace value of a matrix, and

Modeling and visualizing a network of features can be conducted by using community detection methods and graphical lasso which estimates regression coefficients of features in the dataset.
Penalized Regression
Penalized regression is an extension of regression that can help with strongly correlated features and avoid overfitting in the high-dimensional data. To construct a network of features form workplace environment data, a method of computing partial correlation between features is utilized. When there exists a correlation with some subsets of network characteristics, the potential interactions of the features should be defined (Friedman et al., 2010; Liu et al., 2009). All the factors associated with the demographic, situational, and socioeconomic effects for each characteristic are validated to develop the network model that represents the interactions between the two features. Suppose there exist instances

where
Data Analysis Results
Odds ratio values for the event of disciplinary failure, drinking status, or smoking status and absenteeism are computed. The 95% confidence intervals of odds ratio values between the event of disciplinary failure or smoking status and absenteeism contain the value of 1, indicating that there may not exist statistical significance, suggesting that the relationship between these two variables is likely due to chance. The odds ratio between drinking status and absenteeism is 2.468 with a 95% confidence interval of [1.098, 5.55] which does not contain 1, representing that there may exist statistical significance, indicating that drinking status may have an impact on absenteeism.
The result (Figure 1) obtained by the application of principal component analysis shows that it is not clear to classify absenteeism using the data from work environment.

Principal component analysis on absenteeism.
Results of Imbalanced Data With Random Forest
The class of outcome variable contains 33 unjustified absenteeism cases and 707 presenteeism or justified absenteeism cases. Random forest algorithm gives accuracy of 0.957 with the original data, 0.940 with over-sampled data, and 0.880 with under-sampled data.
Network Analysis
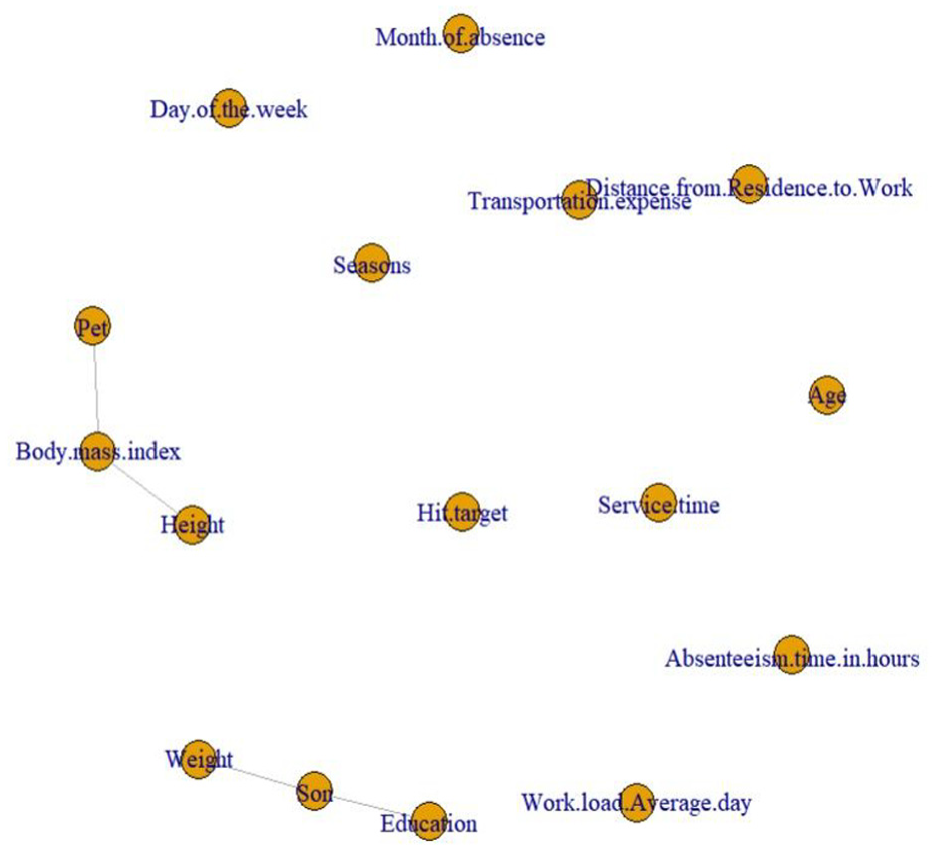
Three different networks with instances for drinkers (Figure 2), and instances for non-drinkers (Figure 3) are constructed. The network for all instances does not represent specific interactions but the relation between height and body mass index. Since the formula for body mass index calculation includes height as a parameter, the result is promising but not new.

Network from Lasso model for drinkers only.
Network from Lasso model for non-drinkers only.
In the network analysis of features for drinkers, the feature body mass index works as a hub with degree of 4 in the network. Four features including education, son, pet, and height have interactions with the feature, body mass index. Here, the variable, son, indicates the number of children and the variable, pet, indicates the number of pets. Co-existence of features such as body mass index, education, son, pet, and height is shown, and the change in a feature body mass index may affect the change in these four features.
In the network analysis of features for non-drinkers, there are two connected components. One connected component contains three features such as body mass index, pet and height. The feature, body mass index works as a hub with degree of 2 in the network. Two features including pet, and height have interactions with the feature, body mass index. The other connected component contains three features such as son, weight, and education. The feature, son works as a hub with degree of 2 in the network. Two features including weight and education have interactions with the feature, son. Co-existence of features such as body mass index, pet, and height, and the co-existence of features such as son, weight and education are shown. The change in the feature, body mass index may affect the change in two features pet and height, or the change in the feature, son, may affect the change in two features, weight and education.
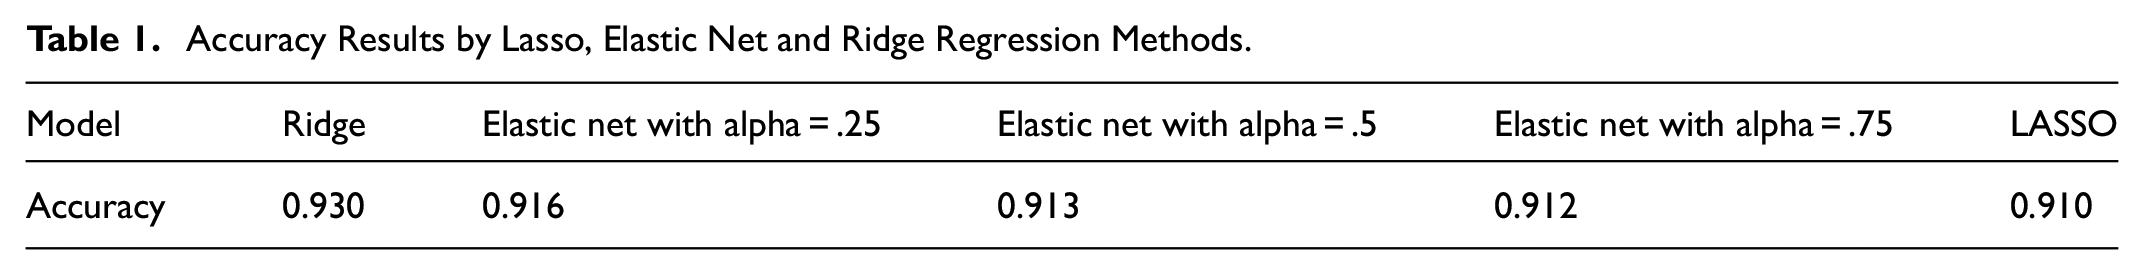
In the prediction of absenteeism with features in the data, Ridge regression outperforms other penalized regression methods in terms of accuracy defined as the proportion of true positives and true negatives among all instances (Table 1).
Accuracy Results by Lasso, Elastic Net and Ridge Regression Methods.
Ridge regression method selected 6 factors as predictors which positively affect the absenteeism outcome (Table 2). Based on average coefficients, factors such as Transportation expense, age, hit target, son, weight, and body mass index positively affect the absenteeism at work. Since the month of absence and absenteeism time in hours directly affect the absenteeism, these two factors were selected but excluded.
Features Positively Correlated With Unjustified Absenteeism.

Ridge regression method selected 8 factors as predictors which negatively affect the absenteeism (Table 3). Based on averaged coefficients, factors such as day of the week, seasons, distance from residence to work, service time, workload, education, pet, and height negatively affect the absenteeism
Features Negatively Correlated With Unjustified Absenteeism.

Discussion and Implications
The statistical approach implements statistical analysis and machine learning methods considering the interactions of features selected and grouped by penalized regression and community detection (Kuzudisli et al., 2023). The proposed method computed odds ratio between the outcome, absenteeism, and categorical variables such as the event of disciplinary failure, drinking status and smoking status. The 95% confidence intervals of odds ratio between the outcome, absenteeism and categorical variables imply that disciplinary failure or smoking status are not directly related to absenteeism. Instead, the odds ratio between social drinking status and absenteeism shows that there is a possibility that drinkers are more likely to take absences than non-drinkers. When the odds ratio value is greater than 1 and the 95% confidence interval of odds ratio does not include the value of 1, it may indicate that the possibility that an outcome may occur given a factor is higher, compared to the possibility of the outcome occurring without that factor. To perform the association analysis of categorical variables, odds ratio values using a contingency table can be calculated.
We assume that studies on the analysis of absenteeism include the application of various machine learning algorithms and datasets from different sources. While the previous studies classify the specific outcome using machine learning algorithms with various factors, the proposed approach conducts machine learning algorithms and includes the associations of factors detected by network analysis. The proposed approach detects significant interactions of demographic, situational, and socioeconomic features in the workplace environment utilizing graphical lasso and community detection (Bakkeli, 2023). Graphical lasso estimates how each feature interacts with other features in the data. With the use of penalty term, graphical lasso produces an inverse covariance matrix after finding an optimized hyperparameter, avoiding overfitting in the model. Given estimated inverse covariance matrix, community detection method constructs a network which represents the interactions of features in the data. The network analysis can show hub nodes which have connections with many other nodes. It is crucial to identify hub nodes since any nodes having connections with many nodes may play a significant role in the mechanism of features in the network. Constructing network structures of features based on the stratification by a specific feature is needed in order to identify different network structures based on different groups of instances, inferring various important interpretations in the real-world data analysis.
The network from the original model and drinking-specific models identified fundamental associations consistent with known epidemiological roles of the features (Beard et al., 2019). The common features of these models is a separate network containing Body mass index and other features. The feature body mass index plays a central role among the work environment features. Drinking-dependent functional differences in the workplace environment may underlie the observed drinking-specificity of responses to in situational exposures to psychological decision (Rehm et al., 2017). The drinking-specificity of the social networks was investigated by grouping workers on the basis of whether they had drunk, producing subtly different networks. We observed differences in the connections with features body mass index and son; in non-drinkers, son was connected with weight and education, and in drinkers, son was connected with body mass index.
Two-dimensional principal component analysis may not perfectly classify the outcomes. In this case, random forest or penalized regression can better predict the outcomes using the high-dimensional data. In the imbalanced data analysis, the outcome has majority and minority classes, and a new sampling strategy may be conducted to appropriately estimate the outcomes. In the real-world data application, random forest on original data slightly outperformed the classification methods such as random forest on over-sampled or under-sampled data or penalized regression methods including Lasso, Elastic Net, and Ridge. To find the best performing machine learning methods for the analysis of workplace environment data, validation of various machine learning methods on differently sampled data can be conducted. The penalized regression implements five penalized regression methods with alpha = 1, .75, .5, .25, or 0. When alpha is 1, Lasso is implemented to select the subset of features from the high-dimensional data. Since Lasso extracts selected significant features for the prediction of an outcome, Lasso outperforms other penalized regression methods in terms of accuracy. However, in the experiments described in this project, Ridge regression method outperforms other penalized regression methods. Based on the prediction result of ridge regression, features positively or negatively affecting absenteeism are estimated.
The feature, age and employee absenteeism are associated in the classification analysis. Results indicate that both justified and unjustified are associated with age (Martocchio, 1989). Employee absenteeism is associated with the family-related attribute such as the number of children (Hysing et al., 2017). The results show that the feature, son and employee absenteeism are significantly associated. Poor health conditions caused by obesity may adversely affect work productivity related to absenteeism (Destri et al., 2022). Obesity represented by high BMI implies a burden due to absenteeism. There may exist factors which may affect the interpretations of data analysis results. In a social group, cultural influences, individual differences and unique circumstances, organizational culture, dynamic nature of absenteeism patterns over time, organizational policies and procedures, organizational support may have an impact on absenteeism rates. For an individual employee’s attendance, mental and physical health issues, job flexibility, job satisfaction, job stress, job insecurity, work-life balance may be significant factors.
The study’s approaches have certain limitations. Utilizing publicly available data may result in a limited sample size and features, which may affect the specificity of data analysis. While the study conducts statistical methods and network analysis for the analysis, appropriate regularization for the penalized regression and the repetition of k-fold cross validation may need to be reviewed. Plus, various machine learning algorithms and statistical tests other than odds ratio tests can be considered. As a future research direction for the valid design of statistical experiments, the control over external variables, potential confounding variables, potential biases or outliers in data collection, interaction effects between factors, potential outliers can be examined.
Conclusion
An innovative approach evaluates the inverse covariance matrix representing the associations of features in the data and predicts an outcome using high-dimensional features. The proposed method implements odds ratio, network analysis, principal component analysis, random forest and penalized regression methods. This approach enables analysis on the relations of both categorical and continuous variables and evaluates the predictive performance of each machine learning algorithm. The proposed approach can be applied in the studies which use the machine learning techniques for public health and social impact problems such as multiple organizational studies (Leso et al., 2023).
The proposed approach is tested with workplace environment data with more demographic, situational, or socioeconomic features which influence the status of absenteeism. The limitation of this method can be improved by applying the proposed methods data with various features. An optimal model to obtain the best predictive accuracy can be derived if we use network structures of features and prior knowledge. The generalizability of the proposed methods in the real data analysis may need to be examined further to assess its applicability to classify outcomes with a larger set of high-dimensional features in the domain of business and public health (Al-Raeei, 2024).
In summary, the aim of proposed approach on real-world data is to efficiently and accurately predict the outcome. The proposed methods can play a significant role as a part of a research methodology to evaluate the interactions of social and psychological factors that may affect absenteeism related to workplace environment (Born et al., 2016; J. W. Lee et al., 2021; Mottaz & Potts, 1986). The proposed methods can be applied to similarly structured high-dimensional management data to estimate the complex associations between significant features and an outcome using information from workplace environment.
Footnotes
Funding
The author(s) disclosed receipt of the following financial support for the research, authorship, and/or publication of this article: This article is financially supported by the 2025 College of Public Policy at Korea University.
Declaration of Conflicting Interests
The author(s) declared no potential conflicts of interest with respect to the research, authorship, and/or publication of this article.