
Abstract
The hotel industry is placing increasing emphasis on customers’ perception of service warmth. However, the current methods for measuring customers’ perception of service warmth are limited to sample surveys. Thus, a two-stage quantitative approach was adopted in this study to develop a novel measuring instrument. By leveraging big data analysis and machine learning techniques, a weighted lexicon of 95 words was identified, which can be utilized to assess customers’ perception of enthusiasm toward P2P accommodation services. The effectiveness of this new measurement tool was tested through two methods: a five-fold cross-validation approach and multiple regression with controlled variables. The instrument developed in this study enables comparable measurement results of perceived service enthusiasm across different accommodation units. Furthermore, this research contributes to the knowledge of measurement instrument development in the era of big data. The practical implications of using the weighted word list are also discussed.
Plain Language Summary
Hotels are working hard to make sure customers feel warmly welcomed, but current methods mainly rely on surveys. In this study, a two-step approach was used to create a new tool for measuring customer perception of service warmth. By using big data and machine learning, a list of 95 words was identified to assess how customers feel about peer-to-peer accommodation services. To test this tool, two methods were used: a five-fold cross-validation approach and multiple regression with controlled variables. The new tool allows for consistent measurement of perceived service enthusiasm across different places to stay. This research also contributes to our understanding of creating measurement tools in the age of big data. The practical uses of using the weighted word list are also explored.
Introduction
The perception of service enthusiasm by customers holds particular significance in the hotel industry as it is strongly associated with how the friendliness and care provided by the staff are viewed by consumers (Stauss, 2002). Consequently, a crucial influence is exerted on consumers’ subsequent attitudes (Cuddy et al., 2011). Meanwhile, it serves as a key driver for consumer satisfaction, loyalty, and retention rates (Rust & Zahorik, 1993), playing a pivotal role in the formation and reinforcement of the relationship between service providers and customers (Fiske et al., 2007; Scott et al., 2013). The increasing recognition of the impact of service enthusiasm on the hotel industry has prompted more service providers to take action in delivering enthusiastic services to their customers. For instance, hotels like A tour assist customers in finding lost wedding rings by dismantling drainage systems in two rooms and guesthouse owners brew traditional Chinese herbal medicine for guests. Hidilao Restaurant invests significant resources to create a caring atmosphere, such as baby care, celebrating customers’ birthdays, and providing snacks, games, and nail salons to entertain waiting customers. Furthermore, many hotel suppliers not only implement baby-friendly designs but also incorporate pet-friendly designs.
In the hospitality industry, service warmth is commonly associated with customers’ perceptions of warmth during service encounters and interactions, the characteristics and behaviors exhibited by service employees, and even the reputation of hotel brands (Gao & Mattila, 2014; Pino et al., 2020; Smith et al., 2016). Consequently, assessing customers’ perceptions of service warmth has become a significant concern in current research. Marketing researchers have employed various methods to measure or evaluate perceived warmth in recent years. These methods include (1) measurement scales in laboratory experiments or sample surveys. Example items are “To what extent do you perceive the hotel (or its employees, or other research subjects) as warm, kind, friendly, helpful, caring, and generous?” (Aaker et al., 1986; Choi et al., 2021; Gao & Mattila, 2014; Güntürkün et al., 2020; Kolbl et al., 2019; Li et al., 2019; Ren et al., 2018; Smith et al., 2016; Terache et al., 2020). (2) Qualitative methods, including content analysis and observational coding (Pan et al., 2021; Schade et al., 2015). (3) Some other methods, such as the single-category implicit association test, and so on (Lindqvist et al., 2017). By employing these diverse approaches, researchers aim to gain a comprehensive understanding of customers’ perceptions of service warmth.
Using measurement scales to detect customers’ perceptions of service warmth is a commonly employed and convenient method in academic research. However, this approach has several drawbacks including, but not limited to the challenging selection of measurement items, the incommensurable results, and limitations in sampling methods. Other measuring methods that require high academic abilities also encounter similar issues related to sample selection and incommensurability. Thus, there is a need to develop a new instrument that overcomes the aforementioned defects and effectively measures customers’ perceptions of service warmth in the hospitality industry. Furthermore, it is essential to consider the impact reviews have on the purchasing decisions of other customers (Cox et al., 2009; Gretzel & Yoo, 2008). With the availability of big data, it becomes possible to capture all customers’ reviews expressing various perceptions, including the perceptions of service warmth. Accordingly, by analyzing more than one million customer reviews of peer-to-peer (P2P) accommodation on Airbnb’s website, we employ machine learning techniques to generate a weighted word list to serve as a reliable measurement instrument for assessing customers’ perceived warmth of accommodation services.
We propose a new instrument for assessing perceived service warmth in the hospitality industry. The development process includes the following steps: identifying a keyword list relevant to service warmth perception, determining word weights through expert ratings and machine learning, and verifying the accuracy and validity of the weighted word list. Essentially, the current study aims to uncover how service providers objectively assess their customers’ perceived warmth of the services provided in the hospitality industry. The results contribute to the existing knowledge on service warmth evaluation and respond to calls for big data research to capture individual customers’ perceptions and preferences. The findings of this study help hotel managers engaged in customer relationship management to enable to evaluate the level of service warmth efficiently and effectively.
Literature Review
The Effect of Service Warmth in Hospitality Industry
Warmth is considered a dimension of human social cognition in the social perception literature (Fiske et al., 2007). Perceived warmth encompasses traits such as friendliness, helpfulness, sincerity, trustworthiness, caring, and morality (Scott et al., 2013). Psychological closeness and a sense of connection with others have been linked to stronger feelings of warmth (Gino & Galinsky, 2012; Ren et al., 2018). Previous research has demonstrated that service smoothness, employee friendliness, and helpfulness are key determinants of perceived service warmth (Lemmink & Mattsson, 2002; Stauss, 2002). Customers not only expect efficient service from employees but also seek a friendly, sincere, and empathetic emotional experience (Parasuraman et al., 1988).
In the context of the hospitality industry, customers’ perceived warmth is largely shaped during service interactions that take place through direct contact with service providers (Bufquin et al., 2017; Parasuraman et al., 1985). Especially in P2P accommodation, a major role is played by hosts and employees in conveying a sense of warmth to customers (Gao & Mattila, 2014; Pino et al., 2020). Hosts treat customers similarly to their friends or relatives, providing a home-like environment that fosters a sense of service warmth and differentiates homestay from traditional hotels (X. Cheng et al., 2019; Lin et al., 2019).
Consequently, service warmth assumes a particularly crucial role in the hospitality industry. Because it exhibits positive associations with customers’ likability, perceived service quality, and subsequent attitudes and satisfaction (Fan & Mattila, 2021). Pino et al. (2020) also found that enhanced customers’ expectations of warmth lead to increased reservation intentions. Service warmth evaluation typically has a positive impact on willingness to pay, loyalty, and word of mouth (Gao & Mattila, 2014; Pino et al., 2020; Smith et al., 2016). Furthermore, service warmth is a significant dimension of high service performance and contributes to building and maintaining customer relationships (Cuddy et al., 2011; Ren et al., 2018; Smith et al., 2016). In sum, the relationship between the evaluation of service warmth and the overall evaluation of hotels is widely acknowledged. In other words, similar to evaluations about the personal trait of warmth significantly influence global evaluations of other people (Wojciszke & Abele, 2008).
Existing Tools for Perceived Service Warmth Measurement
Measurement scales are widely utilized for estimating customers’ perceptions of warmth. The most common formats include the seven-point (or five-point) Likert scale and the semantic differential scale, where respondents assign scores to indicate their attitudes or feelings precisely. Additionally, scale items vary according to the objectives of the study. For instance, Ren et al. (2018) employed three measurement items—warm, kind, and generous–to examine the impact of communication formats on feelings of warmth toward hotels. Gao and Mattila (2014) used warm (cold) and friendly (unfriendly) to assess the perceived warmth of green hotels, while Li et al. (2019) utilized warm (cold) and friendly (unfriendly) items to measure customers’ perceived warmth of service employees. Other measurement items encompass trustworthy, good-natured, sincere, helpful, kind, caring, sociable, tolerant, agreeable, and sympathetic (Choi et al., 2021; Güntürkün et al., 2020; Kolbl et al., 2019; Smith et al., 2016; Terache et al., 2020). Some studies have used a wider range of sliders than a seven-point scale, such as from 0 to 100 (Terache et al., 2020).
However, the current measurement scales used to assess customers’ perception of service warmth have some shortcomings, particularly for owners and managers in the accommodation industry. First, the accuracy and validity of measurement results are limited by the sampling method and its quality. The sample failure to adequately represent the population may result in the utility of the service warmth measurement being compromised. Second, multiple measurement items require appropriate selection to guarantee the measurement results. Third, it is challenging to compare the measurement results of perceived warmth among different accommodations, as finding identical samples for many diverse lodgings is difficult. Therefore, this study aims to develop an advanced measurement instrument to overcome these challenges.
Some qualitative methods are also employed to assess perceptions of warmth, such as content analysis and observational coding (Pan et al., 2021; Schade et al., 2015). Researchers code statements or tasks to the dimension of warmth with qualitative instruments, and frequency calculation is usually adopted to assess warmth perception. Several fewer common methods are used to measure perceived warmth, including the single-category implicit association test, linguistic category model, and coefficient of relative substantive agreement (Halkias & Diamantopoulos, 2020; Kervyn et al., 2011; Lindqvist et al., 2017). However, the measurement of perceived warmth based on a specific small sample can result in incommensurable results. In contrast, the measurement instrument developed in this study is based on machine learning techniques and big data, which can be used conveniently and effortlessly.
Methodology
Given the objectives of this study, a two-stage quantitative approach was proposed to obtain a weighted words list capable of measuring customers’ perceptions of service warmth for P2P accommodations. In contrast to the questionnaire survey method commonly used in previous temperature-related studies, this study employed online user-generated reviews from Airbnb. This method has the advantage of being unsolicited, providing ample descriptions, and maintaining objectivity (Lv, Lu et al., 2022; Qiu et al., 2023). Moreover, it effectively avoids subjectivity and bias that might have arisen from interviews (Lv, Lu et al., 2022).
The initial step involved content analysis using language clustering with word co-occurrence networks and a word2vec model to gain insight into how customers expressed their warmth perception through user-generated text reviews on Airbnb. This helped identify terms most relevant to customers’ warmth perception. Subsequently, a random forest model was trained to determine the weights of words based on their importance in contributing to warmth perception, as assessed by experts who rated the text reviews.
Two crucial phases in examining social media data, such as online reviews, were data collection and data analysis (M. Cheng & Jin, 2019; Del Vecchio et al., 2018). As shown in Figure 1, the raw unstructured data was collected from Airbnb’s website, encompassing attributes related to Airbnb listings, customers’ textual reviews, and hosts’ responses to the reviews. During the data analysis phase, data pre-processing was conducted to convert raw data into a format suitable for further analysis. Clustering algorithms were then applied to extract themes related to customers’ warmth perception based on words’ co-occurrence. Finally, the random forest model was employed to determine the words’ weights of contributions to the theme of customers’ warmth perception and to identify the weighted scale for measuring their warmth perceptions. Additionally, a validity testing phase was introduced, where the effectiveness of the constructed weighted scale in data analysis was examined using testing samples rated by experts and multiple regression with control variables collected from Airbnb’s website.
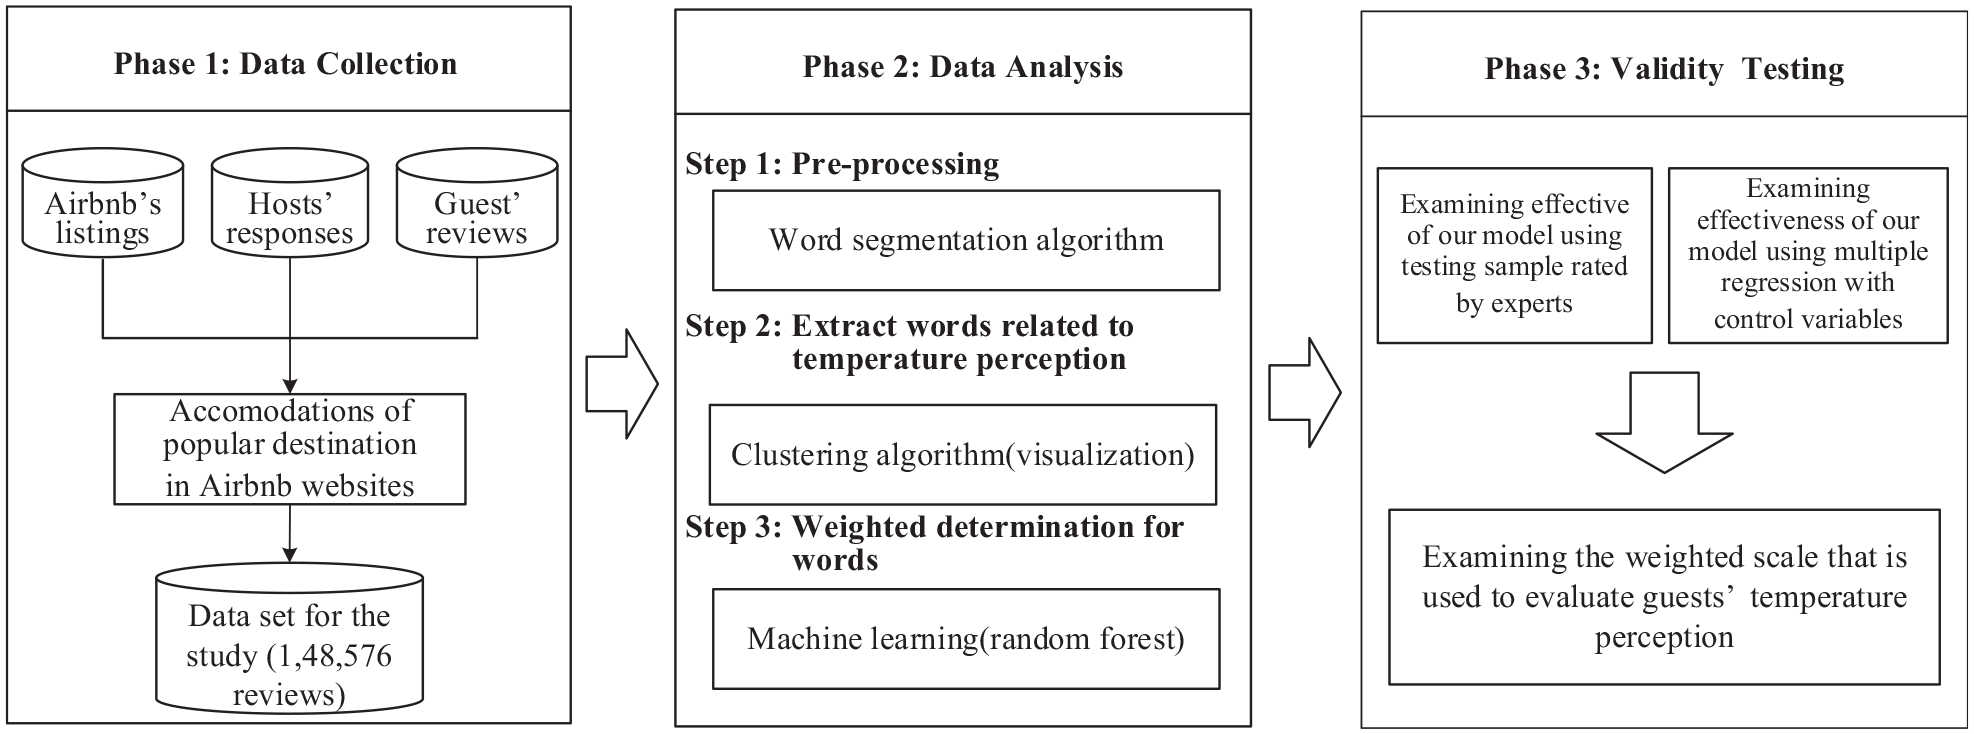
Methodology of this study.
Data Collection
The primary source of data for our study was user-generated text reviews from Airbnb. As stated by the official website of Airbnb, Airbnb is devoted to a trusted community marketplace that allows people to list, discover, and book unique accommodations around the world. Since its launch in 2008 as a peer-to-peer platform for short-term rental accommodations, Airbnb has experienced exponential growth over the past decade (M. Cheng & Zhang, 2019). Currently, it offers over 6 million listings in almost 200 countries, and more than 500 million customers have booked properties from this platform. The dataset we selected in April 2022 contains 1,048,576 reviews for 11,918 accommodations. These reviews were posted by customers who used Airbnb services during popular destination trips between April 1st, 2010, and April 1st, 2022. Table 1 provides summary statistics for the data, and Figure 2 presents a typical example of a review posted by an Airbnb guest for a specific accommodation in a popular destination.
Summary Statistics.


An example of a review.
The five-star ratings in our data are higher than those in some previous studies, such as the data used by Santos et al. (2020) and Zervas et al. (2021). First, the data used in this study are all from reviews for accommodations in popular destinations, where hosts rely more on Airbnb to earn money. Consequently, these hosts have more to gain from improving their ratings compared to hosts in other areas. Second, the response rate of our data is relatively higher compared to data used in most existing literature, indicating that these hosts strive more to improve service quality to a greater extent, leading to higher ratings.
As stated by O’Donohoe (2010) and Ploder and Hamann (2021), downloading existing reviews from websites does not strictly qualify as human subject research. Thus, ethical clearance is not required for our study, as it does not involve any interaction or intervention that would require consent.
Data Analysis
The data analysis process was divided into three steps: pre-processing, theme extraction, and detailed determination of word weights. Specifically, in the pre-processing step, we first removed reviews that were automatically posted by Airbnb. These reviews mostly pertained to reservation cancellations made by customers or hosts, as well as social interactions like “Tell others in the Airbnb community about your stay.” Following the approach of previous studies (von Hoffen et al., 2018; Yap et al., 2018), we then filtered out non-English reviews to minimize the impact of language and cultural differences on expression. After removing automated posts and non-English reviews, the dataset was reduced to 933,257 reviews. We further eliminated interjections such as “hmms” and “oh,” as well as emojis, as they did not provide explicit insights into customers’ warmth perception. This step was performed using the “nltk” module in Python. Finally, standard English stop word filtering was conducted to complete the data cleaning process, following the suggestion of Falasari and Muslim (2022).
To extract themes related to warmth perception from customers’ reviews and identify words most closely associated with this theme, a visualized clustering algorithm based on words’ co-occurrence was employed. The co-occurrence based clustering algorithm is a simple yet powerful approach that has proven effective in mining information from textual data, especially from the vast volume of user-generated content on websites (Liu et al., 2022; Verma et al., 2021). As shown in Figure 3, the clustering results are visualized using different colors. The words in nodes are sized relative to their frequency of appearance in customers’ reviews, while the relations, that is, arc edges, measure the co-occurrence of these words (Cevoli et al., 2021; Hunt et al., 2014).

Results of clustering based on words’ co-occurrence.
From the clustering results, the red cluster can be used to measure customers’ perceptions of service warmth. The green cluster primarily represents evaluations of the accommodation’s competence, while the blue cluster reflects descriptions of the accommodation’s location and surroundings. The clustering algorithm ultimately identified 57 words from the red cluster, such as comfort, value, and cleanliness, which constitute the original word list associated with customers’ perception of warmth. Also, the word2vec model, proposed by Al-Saqqa and Awajan (2019), was utilized to vectorize the words in customers’ reviews and expand the original word list into the final word list using the cosine similarity algorithm proposed by Xia et al. (2015) and Ye (2011). To include all words contributing to customers’ perceptions of service warmth, the threshold for the cosine similarity algorithm was set at 0.91. After expanding the original word list through the cosine similarity algorithm, the final word list, which fully and appropriately describes customers’ warmth perceptions, contains 95 words.
Finally, the weights of words, which measure contributions to customers’ warmth perceptions in the final words list, are determined through the random forest model (see Figure 4). The random forest model, one of the most important machine learning techniques, has emerged as a serious competitor to state-of-the-art methods such as Support Vector Machines (SVMs) (Gan et al., 2013), neural networks (Jiang et al., 2021), and fuzzy methods (Talpur et al., 2022), among others. In the complex big data analysis scenario, the random forest model is preferred due to its advantages of effective training processes, fast prediction, and resilience in handling imbalanced data (Sheridan, 2013). Consequently, we chose the random forest model to determine the relative importance of words in the cluster of warmth perception.
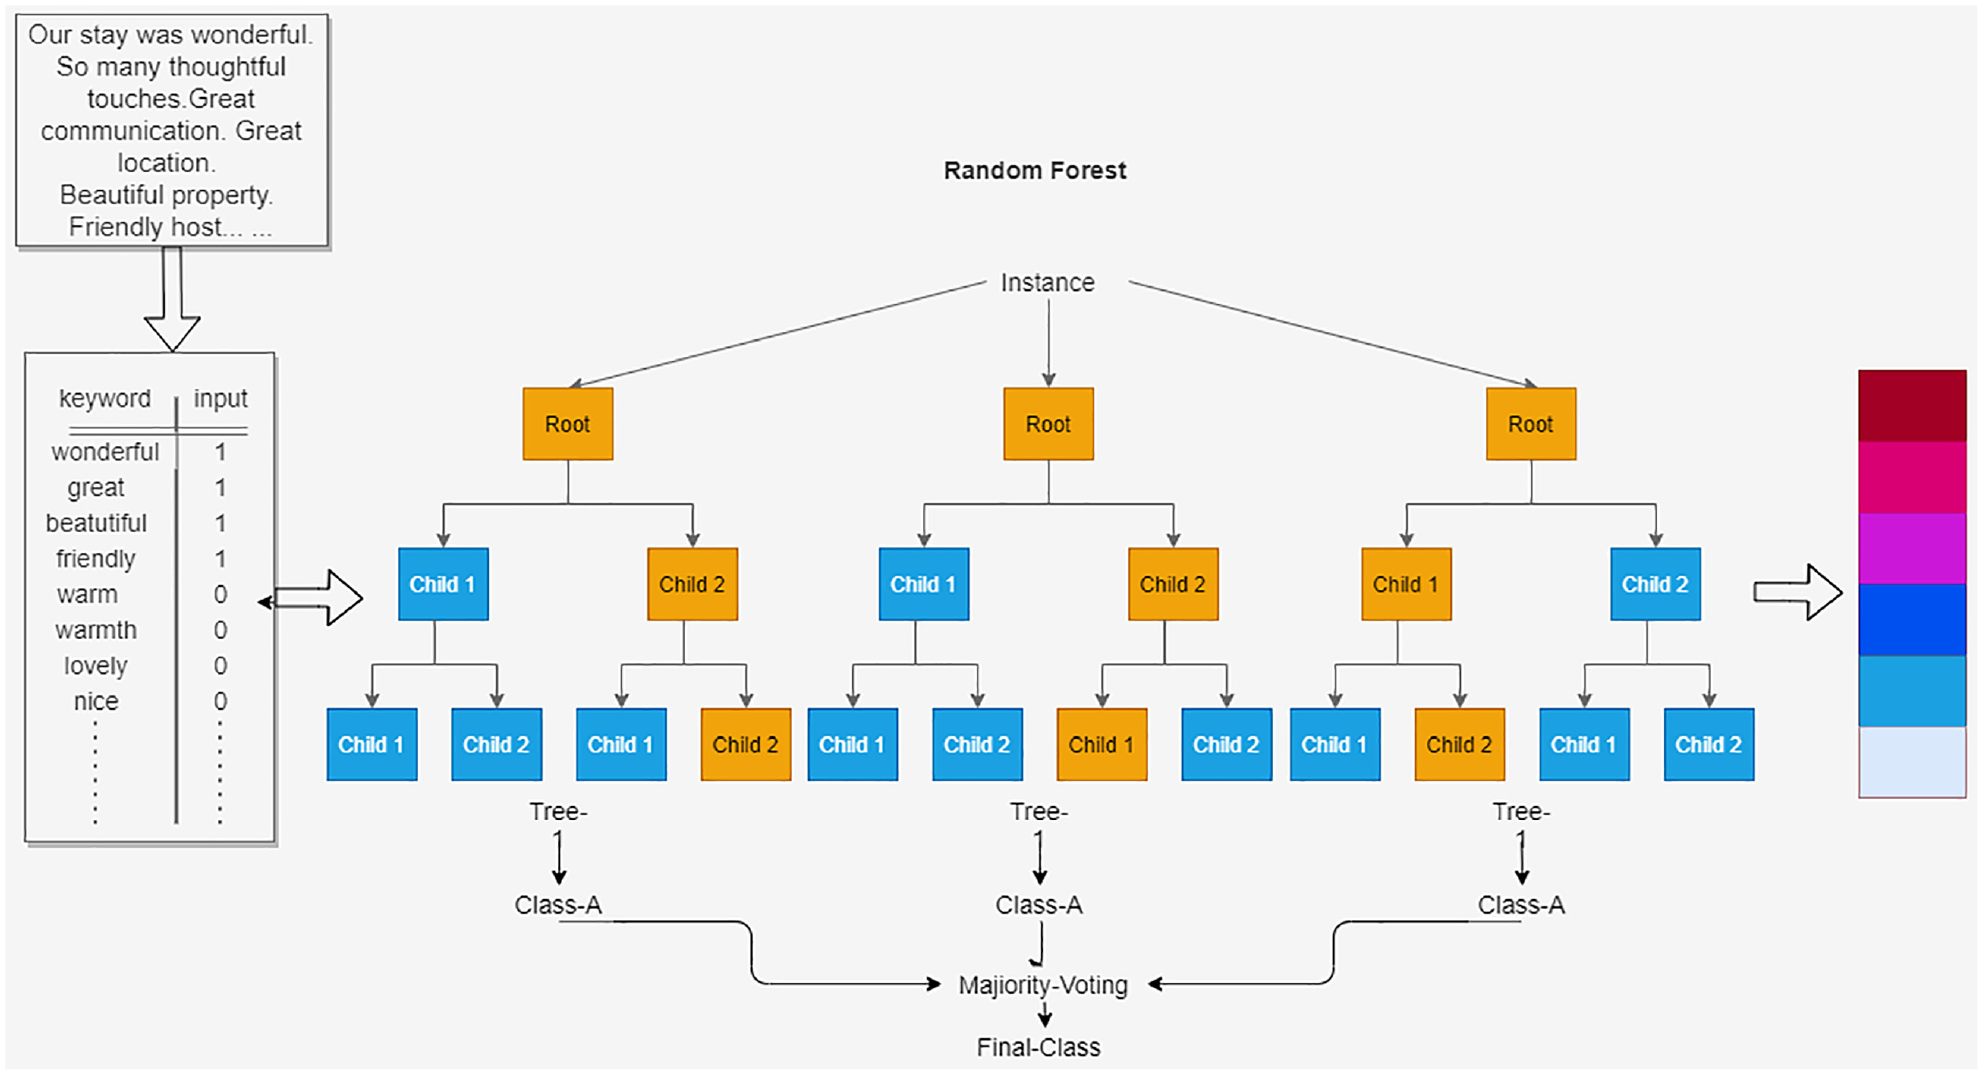
Random forest model.
For the training model, we randomly selected 1,000 customer reviews that were evenly distributed in different areas of the popular destination. A total of 78 experts were involved in the rating process, including 41 students who had made reservations through Airbnb more than five times in the past 2 years, 21 professors in the areas of tourism management or marketing, and 16 government staff members in charge of public travel affairs. These experts were invited to rate the reviews to ensure that each customer’s review was rated by at least two experts. The communication and data exchange between researchers and experts were conducted via email. On average, the response time after sending the reviews was approximately 10 days. The average score assigned by the experts to each review represented the customers’ warmth perceptions and was used to train the random forest model to obtain the word weights. A part of the words related to customers’ warmth perception and their corresponding contribution weights are listed in Table 2.
Words’ List for Customers’ Warmth Perceptions.

Note. Full table see Appendix 1.
We present a weighted list of words through three steps: pre-processing, constructing a word list related to customers’ warmth perception, and determining the weights for the constructed word list. Combined with machine learning techniques such as random forest and SVM, the proposed weighted word list in this study can assist to evaluate service warmth perceptions of customers. For example, we assessed the warmth perceptions of 3,000 randomly selected reviews from Airbnb’s mountain cabins over the past three years by using the weighted word list. Each review receives an evaluation score ranging from 0 to 5 points, where 5 points indicate the warmest perception and 0 points suggest the coldest perception by the guest. As shown in Figure 5, the column charts reveal the proportions of reviews falling into different scoring ranges. The color bar gradually changes from cool tones to warm tones, illustrating the warmth perceptions of customers.
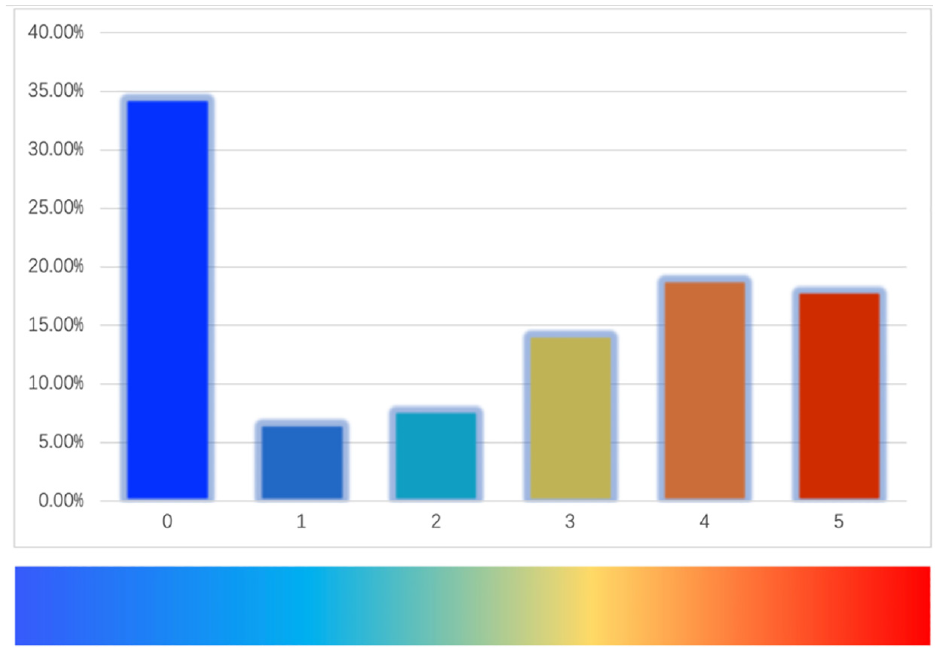
Evaluations of warmth perceptions based on the weighted words’ list (random forest algorithm).
Validity Testing
We validated the weighted word list derived from the previous two phases of the data analysis process using two methods. The first method involves a five-fold cross-validation approach using testing samples randomly selected from the reviews. The second method employs multiple regression to analyze the scores of accommodations by each guest who made reviews on Airbnb.
First, similar to the construction of training samples, we randomly selected another 500 reviews that are evenly distributed in different areas of popular destinations as the testing samples. 30 additional experts, including 17 males and 13 females were employed to rate the scores of warmth perception for these testing samples. Although these experts are different from the group used for model training, their expertise and backgrounds are similar, including students, professors, and government staff.
Based on the scores provided by these experts, all 500 reviews are classified into two groups: one with a warm perception containing 348 reviews, and the other with a cold perception containing 152 reviews. The five-fold cross-validation method is commonly used for indicator evaluation or model selection (Grimm et al., 2017; Peterson & Cavanaugh, 2019; Tuson et al., 2021). We assessed the prediction accuracy of warmth perception using typical machine learning algorithms based on the proposed weighted word list in this study. As shown in Table 3, the weighted words effectively measure customers’ warmth perception. Additionally, the random forest algorithm used to identify the contributing words to warmth perception is appropriate.
Accuracy of Warmth Perception Prediction.

The multiple regression method is proposed to verify the appropriateness of the weighted words for customers’ warmth perception, adopting a five-fold cross-validation approach. According to previous studies’ (Tefera & Migiro, 2018; Zhang & Verma, 2017) suggestions, scores of online reviews rated by customers are the most popular indicators that comprehensively represent customer perceptions. This implies that customers who have a warmer experience may tend to give a higher rating to the accommodation. Thus, multiple regression was conducted to examine the relationship between the warmth perception predicted based on the proposed weighted word list and random forest model, and the scores provided by customers. The regression model can be defined as follows.

The regression equation includes the dependent variable “Score,” and the independent variables “TP,” representing the scores rated by customers and the warmth perception predicted by the word list and random forest, respectively. “Contr” represents the vector of control variables, including the price of accommodations, the check-in experience, the location, pets allowed, wifi, pool, and other facilities reported in Airbnb and hosts’ profiles. The coefficient “α” represents the intercept, and “ε” measures the residual. The results of the regression analysis are presented in Table 4. The results indicate a significant positive influence of customers’ warmth perception on the scores they rated. This finding validates the effectiveness of the weighted word list we constructed to measure customers’ warmth perceptions and confirms the predictive capability of the random forest in foresting warmth perceptions to a certain extent.
Regression Results of Warmth Perceptions.
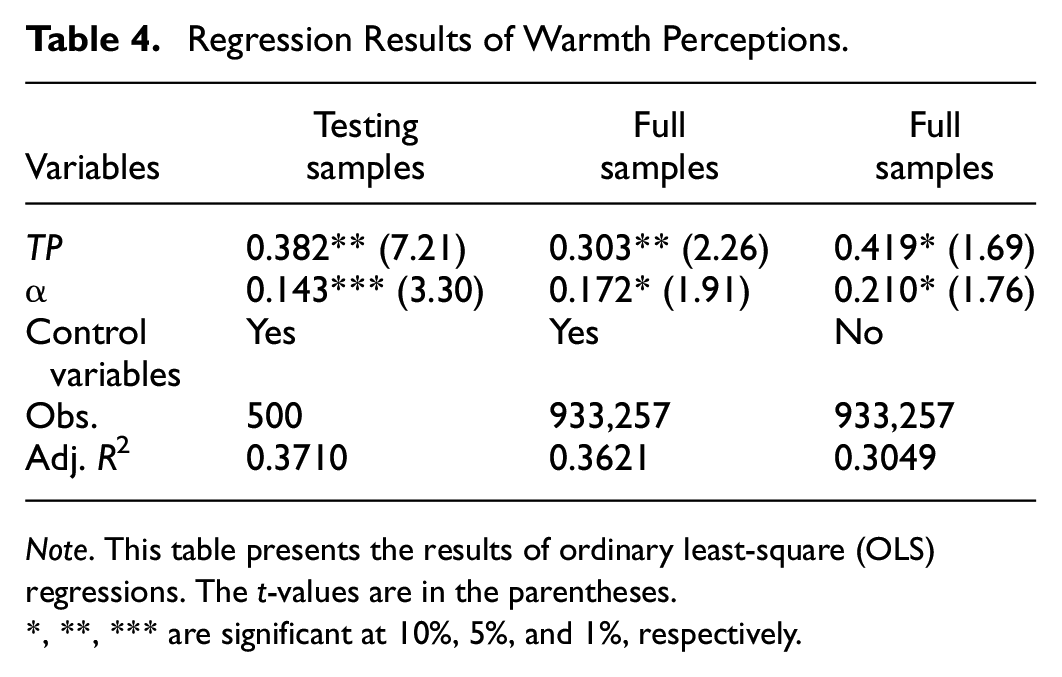
Note. This table presents the results of ordinary least-square (OLS) regressions. The t-values are in the parentheses.
, **, *** are significant at 10%, 5%, and 1%, respectively.
General Discussion
Conclusions
In the hospitality industry, service warmth has become a crucial factor for maintaining customer relationships, influencing their positive attitudes and behavioral intentions (Cuddy et al., 2011; Lemmink & Mattsson, 2002; Ren et al., 2018; Smith et al., 2016). However, existing measurement approaches have some limitations. Thus, this study developed a new instrument to measure customers’ perceptions of service warmth, thereby facilitating the evaluation and improvement of accommodation services.
The new measurement instrument is a weighted word list, created using a staged quantitative approach. First, over one million online reviews were collected from Airbnb’s website. Subsequently, a list of 95 keywords relevant to service warmth perception was extracted from these reviews using word co-occurrence networks and a word2vec model. Then, the weights of these 95 words were determined through a combination of expert ratings and machine learning techniques. At last, the validity of the weighted word list was assessed using the five-fold cross-validation approach, and its predictive potential for customers’ ratings of accommodations was also examined. The findings revealed that the random forest model was effective in predicting warmth perception, and the weighted 95-word list demonstrated exceptional capability in measuring customers’ perceptions of service warmth in P2P accommodations. Also, the customer’s warm perception positively affects the customer’s rating of peer-to-peer accommodation.
Theoretical Implications
This study has several theoretical implications. First, 95 words discovered in the study can effectively measure customers’ perceptions of service warmth. On one hand, some of these words align with previous measurement scales, such as “friendly,”“kind,” and “warm” (Choi et al., 2021; Gao & Mattila, 2014; Güntürkün et al., 2020; Kolbl et al., 2019; Li et al., 2019; Ren et al., 2018; Smith et al., 2016; Terache et al., 2020). On the other hand, a wide array of distinctly different adjectives has been identified as contributing to the measurement of perceived warmth. These include “comfortable,”“nice,”“helpful,”“comfy,”“cozy,”“welcoming,’ and more. Interestingly, even certain nouns, such as “host,”“gem,”“peace,” and “gift,” have been found to play a role in measuring warmth perception. These findings demonstrate that while some synonyms for “warm” are used to gauge warmth perception, they are rarely perceived or utilized as descriptors when customers experience warm services in P2P accommodations. Moreover, unlike previous scales that treat each item with equal weight, this study assigns varying weights to each word, thereby enhancing the effectiveness and accuracy of the measurement instrument concerning customers’ perceptions of service warmth.
Second, this study responds to the call for big data research by developing a measurement instrument based on machine learning. The measurement results derived from big data can be utilized in service warmth research to expand the findings of this field, which has predominantly relied on lab experiments and sample surveys in most existing research. At last, in line with previous studies, the study verifies the positive impact of perceived service warmth. The results of this study show a positive correlation between perceived service warmth and the scores of online reviews rated by customers.
Practical Implications
The study also has practical implications. First, this study offers a perceived service warmth measurement instrument for utilization. The suggested approach to applying this measurement instrument involves collecting all customers’ reviews and utilizing typical machine learning algorithms based on the weighted word list to calculate the scores of perceived service warmth. Homestay owners, managers in the hospitality industry, and scholars interested in service warmth studies can send the collected customers’ reviews to the development team of this instrument to obtain the measurement results. Alternatively, they can be provided with the program code to conduct the measurement independently.
Compared with previous scales, the greatest strength of this new instrument is its ability to achieve comparable service warmth scores. As a result, homestay owners and managers in the hospitality industry can clearly understand the advantages or disadvantages of their customers’ perceived service warmth compared to their competitors. A simple and convenient method to operate this measurement instrument is to first multiply the frequency of a listed word appearing in customers’ reviews by the weight of the word, and then obtain the sum of all products as the measurement result. The approach makes the deployment of the instrument easy and practical without requiring sample surveys or expertise in selecting scale items.
The second contribution is the function of the word list itself. The word list developed in the study can assist homestay owners and managers in the hospitality industry) in understanding how to improve customers’ perception of warmth. If the keywords from the list are frequently mentioned in the reviews, operators need to investigate to ascertain the specific service behaviors, features, or interactions that foster the perception of warmth. Subsequently, measures need to be taken to reinforce these identified aspects. On the other hand, if only a few words from the list appear in the reviews, it indicates that customers’ perceptions of service warmth are low, and some beneficial strategies are required to address this issue. For instance, implementing smile service, treating customers as friends, and creating comfortable, cozy, and warm surroundings could be beneficial approaches.
Limitations and Future Research
This study develops a new measurement instrument for perceived service warmth based on user-generated text reviews from Airbnb, which offers P2P accommodation services. Future research can explore how to measure customers’ perceptions of service warmth in hotels, and to discuss the similarities and differences between these two instruments. Furthermore, expert ratings play a crucial role in the development process, and we hope to rely more on customer ratings as big data technology advances. Finally, we used a five-fold-cross validation approach and multiple regression for scores to test the validity of the weighted word list. Future research can employ other methods, such as sample surveys or interviews, to establish connections between traditional measurement methods and this new instrument.
Footnotes
Appendix
Words’ List for Customers’ Warmth Perceptions.

| Words | Weights | Words | Weights | Words | Weights |
|---|---|---|---|---|---|
| place | 0.055361 | fantastic | 0.010989 | thanks | 0.002671 |
| stay | 0.052169 | relaxing | 0.010383 | fruit | 0.002660 |
| clean | 0.048941 | thought | 0.010060 | outstanding | 0.002621 |
| host | 0.043040 | fresh | 0.009150 | brilliant | 0.002621 |
| comfortable | 0.041210 | absolutely | 0.008370 | beautifully | 0.002525 |
| nice | 0.035904 | gem | 0.008155 | sunset | 0.002515 |
| ever | 0.035691 | sun | 0.007951 | bread | 0.002459 |
| location | 0.035336 | ideal | 0.007814 | tranquil | 0.002228 |
| good | 0.035080 | gorgeous | 0.007017 | bustle | 0.002109 |
| great | 0.029521 | talk | 0.006796 | hustle | 0.002007 |
| real | 0.024521 | rise | 0.006668 | superb | 0.001992 |
| lovely | 0.022823 | thank | 0.006358 | spectacular | 0.001856 |
| joy | 0.021118 | cozy | 0.005661 | heaters | 0.001824 |
| quiet | 0.020906 | setting | 0.005654 | exceptional | 0.001732 |
| beautiful | 0.020563 | peace | 0.005565 | reality | 0.001503 |
| perfect | 0.020487 | truly | 0.005465 | surroundings | 0.001305 |
| definitely | 0.020450 | thoughtful | 0.005428 | sunrise | 0.000955 |
| really | 0.019280 | peaceful | 0.005249 | tastefully | 0.000953 |
| friendly | 0.018247 | stunning | 0.005210 | flower | 0.000947 |
| amazing | 0.017844 | nicely | 0.005093 | beauty | 0.000777 |
| helpful | 0.016769 | fab | 0.004998 | idyllic | 0.000765 |
| kind | 0.016676 | heating | 0.004524 | gift | 0.000745 |
| wonderful | 0.016569 | incredible | 0.004287 | paradise | 0.000614 |
| hosts | 0.016003 | delight | 0.004273 | warmth | 0.000550 |
| best | 0.014847 | fireplace | 0.003177 | serene | 0.000436 |
| welcoming | 0.014099 | generous | 0.003003 | relaxation | 0.000354 |
| warm | 0.013917 | romantic | 0.002937 | gifts | 0.000280 |
| comfy | 0.013172 | fabulous | 0.002850 | serenity | 0.000267 |
| excellent | 0.012053 | chat | 0.002845 | tranquility | 0.000260 |
| extremely | 0.011633 | retreat | 0.002834 | stylishly | 0.000258 |
| fire | 0.011108 | enjoyable | 0.002715 | sunsets | 0.000226 |
Acknowledgements
Special thanks to Dr. Zhou Daohong, a doctoral student at the Western Business School of Southwestern University of Finance and Economics, for the data research and analysis support provided to this study.
Declaration of Conflicting Interests
The author(s) declared no potential conflicts of interest with respect to the research, authorship, and/or publication of this article.
Funding
The author(s) disclosed receipt of the following financial support for the research, authorship, and/or publication of this article: This study was supported by the Humanities and Social Science Fund of Ministry of Education of China (23YJC790088), The National Natural Science Foundation of Sichuan Province (2023NSFSC1043), the Undergraduate Research and Learning Program of Southwestern University of Finance and Economics and Social Science Project of Sichuan Tourism University (2023SCTUS D02).
Data Availability Statement
Data sharing not applicable to this article as no datasets were generated or analyzed during the current study.