
Abstract
Enhancing the efficiency of green innovation is a vital step toward sustainable progress and eco-conscious economic growth. Using data from Chinese listed firms between 2007 and 2022, this study explores how digitalization influences corporate green innovation efficiency. The analysis indicates a significant positive effect of digitalization, particularly on firms in non-manufacturing industries and those located in developed regions. Key digitalization components, including cloud computing and digital technology applications, emerge as pivotal in improving green innovation efficiency, whereas technologies like artificial intelligence, blockchain, and big data face implementation challenges. Additionally, the speed of digitalization is shown to amplify these benefits. These findings provide valuable evidence and actionable policy recommendations to utilize digitalization for promoting green economic growth and sustainable development.
Keywords
Introduction
In the era of Industry 4.0, digitalization (DI) has emerged as a transformative force that drives sweeping changes in global economic systems and corporate innovation practices (Si et al., 2022). The rapid growth of the information and communication technology (ICT) sector underscores its significance as a cornerstone of economic competitiveness and productivity. Between 2013 and 2023, the ICT sector grew at an average annual rate of 7.6%, nearly three times higher than the broader economy, according to recent OECD (2024) data. The advancements in ICT have empowered firms to optimize resource allocation, streamline workflows, and enhance operational efficiency, creating a foundation for more resilient and adaptive business ecosystems. However, the transformative potential of DI extends far beyond economic productivity. By addressing critical global challenges—notably environmental sustainability—digital technologies are reshaping how firms respond to pressing societal demands, including climate change and resource efficiency.
Achieving sustainable development has become one of the most urgent global imperatives. Initiatives such as the United Nations Sustainable Development Goals and widespread “net zero” commitments are increasingly pressuring firms to innovate in ways that align with environmental responsibility. Green innovation—an innovation that minimizes environmental impacts while promoting resource efficiency—has emerged as a vital pathway for balancing economic growth with ecological responsibility. Despite its potential, implementing green innovation remains fraught with inefficiencies, including resource misallocation, technological constraints, and organizational fragmentation (Bai et al., 2024). These barriers have resulted in uneven adoption and suboptimal outcomes, particularly in contexts where technological and institutional support is limited. The intersection of digital transformation and green innovation presents a promising avenue for overcoming these challenges, enabling firms to achieve sustainable economic growth while addressing environmental concerns.
DI offers transformative potential to address the inefficiencies inherent in green innovation by facilitating resource optimization, fostering cross-functional integration, and removing innovation barriers (Da Silva Nascimento et al., 2024; Jiang & Li, 2024). Unlike traditional green innovation approaches, which often emphasize outputs such as patents or new product launches, digital technologies enable firms to enhance the efficiency of innovation processes. For instance, cloud computing and big data can minimize redundancies in research and development, while digital platforms improve collaboration across geographically dispersed teams. Despite these advantages, the role of DI in driving green innovation efficiency (GIE) has received limited empirical attention. Existing studies primarily focus on the outcomes of green innovation, leaving significant gaps in understanding the mechanisms through which DI enhances efficiency and the contextual factors—such as industry type and regional variations—that mediate this relationship.
This study seeks to fill this critical research gap by exploring the impact of DI on corporate GIE within the Chinese context. China, as the world’s second-largest contributor to the digital economy, provides a compelling and data-rich environment for examining these dynamics (Lu & Hu, 2024; C. Sun et al., 2022). According to the China Academy of Information and Communications Technology’s 2021 White Paper on Digital Economy Development, China’s digital economy reached 39.2 trillion yuan (approximately $5.4 trillion), accounting for 38.6% of the country’s GDP (Tian et al., 2022). The scale and rapid evolution of China’s digital economy offer unique insights into how DI can be leveraged to address environmental and economic challenges. This study aims to answer four key questions: (1) Does DI enhance GIE? (2) Which sub-dimensions of DI are the most influential in improving GIE? (3) How does the speed of DI adoption dynamically affect GIE? (4) Are the effects of DI on GIE heterogeneous across industries and regions?
Using a sample of 4,128 Chinese listed firms from 2007 to 2022, this study investigates the effects of DI on GIE. We introduce a superior methodology for measuring DI through a neural network-based Word2Vec model, overcoming the limitations of traditional keyword frequency analysis. By training this model on company annual reports, we ensure a more detailed and comprehensive identification of digitalization-related language, particularly in the complex context of Chinese text. Additionally, we incorporate a two-stage measurement approach for GIE, combining patent data and advanced data envelopment analysis (DEA), ensuring the accuracy of our indicators. Our empirical results show that DI significantly enhances GIE, with particularly pronounced effects in non-manufacturing sectors and developed regions. Among the dimensions of DI, cloud computing and digital technology applications emerge as the primary drivers, and the speed of DI plays a crucial role in amplifying the green innovation benefits.
This study offers several significant contributions to the literature. First, from a theoretical standpoint, it provides a comprehensive framework for understanding how DI enhances GIE by optimizing resources, mitigating agency conflicts, and strengthening dynamic capabilities. This approach addresses a critical gap in the literature, particularly with regard to the heterogeneous effects of DI across industries, regions, and technological contexts. Second, methodologically, we introduce the Word2Vec model, which allows for a more accurate and robust measurement of DI compared to traditional keyword-based approaches. This innovation enhances the scientific rigor of DI metrics. Third, leveraging a large sample of Chinese listed companies over the period 2007–2022, we provide empirical evidence that cloud computing and digital technology applications are key drivers of GIE, while technologies such as artificial intelligence face significant implementation barriers. Fourth, by analyzing the speed of digital adoption as a dynamic factor, this study offers actionable insights for policymakers, laying a solid theoretical and practical foundation for achieving green economic transformation and sustainable development goals. Together, these contributions push the frontier in understanding the intersection of digitalization and sustainable innovation.
Literature Review and Hypothesis
Literature Review
DI has become an important driving force for firms aiming to enhance innovation and optimize operational efficiency (Baiyere et al., 2020). This process involves integrating advanced digital technologies such as artificial intelligence, big data, cloud computing, and blockchain into various business functions (P. Chen & Hao, 2022; Tian et al., 2022). In fact, DI has not only fundamentally transformed business models and production processes but has also become a key driver of green innovation, which focuses on environmentally sustainable products and processes (Jiang & Li, 2024). As companies face increasing pressure to achieve sustainability goals, leveraging digital technologies to enhance green innovation has garnered increasing attention (e.g., H.Li et al., 2023; Y. Liu et al., 2020; Schiederig et al., 2012).
DI facilitates green innovation by improving resource efficiency, reducing waste, and optimizing energy usage through data-driven insights (Chin et al., 2022; X. Liu et al., 2023). Vial (2019) defines DI as the organizational adjustments made to embrace digital technologies, leading to the redefinition of business models and the creation of new value. Similarly, Hess et al. (2016) and P. Chen and Hao (2022) argue that DI marks a significant shift, characterized by the integration of cutting-edge technologies that allow firms to achieve sustainability goals while driving innovation. Verhoef et al. (2019) further outline that the DI process unfolds in stages: digitizing analog information, adjusting business processes through digital tools, and strategically redesigning operational models to embrace sustainability.
Previous literature has emphasized the crucial role of individual digital technologies in driving green innovation efficiency. For example, artificial intelligence and machine learning algorithms enable companies to predict and optimize energy consumption, reduce emissions, and minimize resource waste (Luo & Wang, 2025). Big data analytics also aids in monitoring environmental impacts, allowing companies to identify inefficiencies in production and distribution processes (Taherdoost, 2024). Cloud computing achieves flexible resource management by optimizing energy consumption and enhancing the scalability of green solutions, while blockchain technology improves transparency and traceability within supply chains, fostering greater accountability for environmental performance (Nuryanto et al., 2024).
While the relationship between DI and green innovation has received significant attention, many studies focus on the role of digital technologies in operational optimization and resource management. Scholars argue that DI provides firms with the tools to overcome traditional constraints in resource management, enabling them to better align their business models with sustainability goals (Rachinger et al., 2018). The ability to collect, process, and analyze large amounts of environmental data enhances organizational decision-making capabilities, allowing them to create more sustainable and resource-efficient products and services (Chan et al., 2018).
Research on developing countries indicates that digital technologies can enhance productivity through better environmental management and decentralized decision-making. Commander et al. (2010) highlight that investment in ICT can strengthen the innovation efforts of firms in emerging markets. Evidence from developed countries also demonstrates the positive roles of digitalization in green innovation. Brynjolfsson and Hitt (2003) provide evidence of a complementary relationship between skilled labor and digital investments, which accelerates innovation outcomes. Furthermore, Andersson et al. (2021) argue that firms engaged in digital software development are more likely to adopt innovative practices, resulting in increased sales of green technologies.
Unlike the definition of green innovation, which focuses on output, the concept of GIE not only emphasizes the technical development efficiency of environmentally friendly products but also examines how these innovations contribute to sustainability goals, including reducing emissions, improving energy use, and better resource management (W. Zhou et al., 2024). Therefore, despite the growing body of research on DI and green innovation, the specific relationship between DI and GIE remains underexplored. This gap is particularly noticeable in existing studies, which tend to focus on general innovation or operational optimization but fail to address how digitalization uniquely affects green innovation efficiency (e.g., Nuryanto et al., 2024). While digital technologies have been shown to enhance sustainability across industries, the direct link to improving GIE and the impact of multiple sub-dimensions remains largely unexplored. This gap in the literature suggests the need for more targeted research to explore the nuanced role of DI in advancing green innovation, particularly in the context of environmental sustainability.
In conclusion, DI represents a fundamental shift in how organizations approach green innovation, breaking down traditional barriers and enabling the integration of sustainable practices into business models. By improving operational efficiency, promoting resource optimization, and enhancing environmental transparency, DI provides firms with unprecedented opportunities to drive green innovation. This study aims to fill this gap by investigating the extent to which DI influences GIE, the contributions of its sub-dimensions, the speed of DI, and the heterogeneity across industries and regions, contributing to a deeper understanding of how digital technologies can enhance green innovation effectiveness in business environments.
Theoretical Background
The Resource-Based View (RBV)
RBV emphasizes the role of unique, valuable, and difficult-to-imitate resources in driving a firm’s performance and competitive advantage (Abid et al., 2023; Barney, 1991). In the context of GIE, DI serves as a transformative resource that enhances the allocation and utilization of both tangible and intangible assets to promote sustainable innovation outcomes (Lin & Ma, 2022). Through technologies like cloud computing and advanced digital applications, digitalization facilitates the integration and reorganization of resources, enabling firms to achieve higher environmental performance (P. Chen & Hao, 2022).
RBV highlights that the reconfiguration of internal resources is critical for addressing environmental challenges. For instance, digital platforms enable firms to optimize resource flows, enhance operational efficiencies, and reduce waste in the production process, all of which contribute to improved GIE (Y. Li et al., 2020). Moreover, digital technologies empower firms to access and leverage external resources through enhanced collaboration across supply chains and ecosystems, thus amplifying their green innovation potential (G. Sun et al., 2023). This theoretical lens underscores that DI not only provides a pathway for sustainable innovation but also transforms resource management into a competitive advantage for environmentally responsible firms.
The Agency Theory Perspective (ATP)
ATP addresses the conflict of interest between managers and shareholders, particularly when strategic decisions involve long-term investments with uncertain returns (Eisenhardt, 1989). These conflicts are particularly pronounced in green innovation initiatives, which often require significant upfront investments and long payback periods, making managers hesitant to pursue such projects (Xiang et al., 2021). DI offers a means to mitigate these challenges by improving transparency and accountability, thereby reducing agency costs and encouraging alignment between managerial actions and shareholder interests (Fang et al., 2022).
For green innovation, technologies like big data analytics and blockchain play a pivotal role in reducing information asymmetry and improving decision-making. Big data analytics allows firms to model the potential environmental and economic impact of green innovation projects, reducing uncertainty and ensuring that resources are allocated efficiently (Feng et al., 2022). Blockchain technology, on the other hand, enhances trust and accountability in multi-stakeholder collaborations, ensuring that green innovation partnerships are more transparent and effective (Chin et al., 2022). By addressing the agency problem, DI fosters a more conducive environment for green innovation investments, ultimately driving improvements in GIE.
The Dynamic Capabilities Perspective (DCP)
DCP highlights the importance of a firm’s ability to adapt to rapidly changing environments by reconfiguring internal and external resources (Brock & Hitt, 2024). In the context of green innovation, DI enhances dynamic capabilities by enabling firms to sense environmental opportunities, seize them through effective decision-making, and reconfigure resources to maximize GIE (Yuan & Cao, 2022).
DI supports firms in identifying emerging environmental trends and aligning innovation efforts with sustainability imperatives. For example, cloud computing provides the flexibility to scale R&D operations in response to changing green innovation requirements, while advanced data technologies streamline the flow of information, reducing redundancies and enabling collaborative problem-solving (Lai et al., 2023). These capabilities allow firms to remain agile in their responses to regulatory pressures, consumer preferences, and competitive dynamics, ensuring that green innovation efforts are both effective and efficient.
DCP also emphasize the role of organizational processes in leveraging external knowledge. DI enables firms to integrate external insights into their green innovation strategies, fostering adaptive responses to environmental challenges (e.g., Lee et al., 2024; X. Liu et al., 2023). By enhancing the agility and resilience of innovation processes, DI ensures that firms can maintain competitiveness while achieving sustainability goals, positioning it as a critical enabler of superior GIE.
Hypothesis Development
DI is increasingly recognized as a critical driver of innovation efficiency due to its potential to optimize resources and reduce inefficiencies, aligning with the principles of RBV. From the RBV, DI enhances a firm’s ability to reconfigure and utilize both tangible and intangible resources, facilitating the integration of sustainable practices into innovation processes. For instance, cloud computing and advanced digital platforms enable firms to identify inefficiencies and implement greener solutions across their operations, thereby improving both environmental outcomes and innovation effectiveness (Asif et al., 2023). These capabilities allow firms to access external knowledge networks and foster cross-organizational collaborations, leveraging shared resources to co-develop green innovations (Feng et al., 2022; G. Sun et al., 2023). This suggests that DI is not merely an operational tool but a strategic asset that transforms resource utilization into competitive advantages in the realm of sustainability.
ATP further reinforces the potential of DI to enhance GIE by mitigating information asymmetry and aligning managerial actions with shareholder interests. Green innovation often involves long-term investments with uncertain returns, which can lead to managerial hesitation or misalignment of priorities (Lin & Ma, 2022; Phung et al., 2022). DI addresses these issues by improving transparency and accountability through technologies like big data analytics and blockchain (e.g., Pu & Zulkafli, 2024; Simsek et al., 2019). Big data analytics allows firms to model and assess the potential environmental and economic impacts of innovation projects, reducing uncertainty and encouraging better resource allocation. Blockchain fosters trust and accountability in multi-stakeholder collaborations, ensuring that resources are directed toward impactful green initiatives (Chin et al., 2022; X. Liu et al., 2023). By reducing agency costs, DI creates a conducive environment for sustainable innovation investments, ultimately driving improvements in GIE. Based on the above discussion, we propose our first hypothesis as follows:
H1: All else being equal, DI has a positive and significant influence on GIE.
DCP emphasizes a firm’s ability to sense opportunities, seize them strategically, and reconfigure resources to adapt to dynamic environments (Teece, 2007; Teece et al., 1997). DI, characterized by its five key dimensions—artificial intelligence (AI), blockchain (BC), cloud computing (CC), big data (BD), and digital technology applications (DTA)—serves as a catalyst for these capabilities, thereby enhancing GIE.
First, based on the theoretical framework of the DCP, AI strengthens a firm’s sensing capabilities by analyzing complex environmental data, forecasting regulatory trends, and identifying eco-friendly innovation opportunities (Bag et al., 2020). AI-driven systems reduce uncertainty in environmental decision-making and accelerate the development of green products and processes, which may contribute to higher GIE. Second, BC enhances transparency and trust in green innovation collaborations, particularly in supply chain decarbonization and sustainability projects (Queiroz & Wamba, 2018). By fostering inter-organizational collaboration and ensuring data security, BC reduces transaction costs and promotes the efficient implementation of green initiatives, thereby boosting GIE (Heo et al., 2024). Third, CC facilitates resource reconfiguration by enabling real-time data sharing and scalable resource allocation, critical for green innovation projects (Yu et al., 2023). Its flexibility allows firms to optimize energy usage and reduce environmental impact during innovation processes, promoting sustainable innovation outcomes (Lăzăroiu et al., 2023). Fourth, BD enhances firms’ abilities to identify and prioritize high-impact green innovations by analyzing environmental trends and consumer preferences (Cadden et al., 2023). Advanced analytics reduce inefficiencies and guide investment into eco-innovation projects, driving improvements in GIE (Xie et al., 2021). Fifth, DTA optimizes production systems and supports intelligent management processes, enabling firms to reduce emissions and adopt sustainable practices (W. Chen & Srinivasan, 2023). By integrating resources and enhancing responsiveness to environmental challenges, DTA fosters a more efficient green innovation ecosystem (Urbinati et al., 2018).
Collectively, these five dimensions of DI enhance firms’ dynamic capabilities, enabling them to integrate sustainability into their green innovation strategies effectively. Thus, we propose the second hypothesis:
H2: The five dimensions of DI (artificial intelligence, blockchain, cloud computing, big data, and digital technology applications) positively and significantly influence GIE.
The speed of digitalization (SDI) directly influences a firm’s ability to leverage digital tools to enhance technological capabilities and drive green innovation. Generally, the rapid adoption of digital technologies enables firms to swiftly respond to environmental challenges, adapt to regulatory changes, and capitalize on emerging eco-innovation opportunities (P. Chen & Hao, 2022; F. Chen et al., 2024; Elia et al., 2019). This dynamic adaptability aligns with the principles of DCP, which emphasizes the importance of sensing, acquiring, and reconfiguring resources in rapidly changing environments (Teece, 2007).
Firms accelerating their DI can gain a first-mover advantage in adopting green technologies and implementing environmentally friendly practices. For instance, SDI can enable firms to improve energy-saving systems and real-time environmental monitoring, reducing waste and enhancing resource efficiency (Ma et al., 2022). The fast pace of DI ensures that firms can comply with stringent environmental regulations and respond to evolving consumer preferences for sustainable products, maintaining their competitiveness in the green market (Bygstad & Øvrelid, 2020; Chin et al., 2022).
Furthermore, RBV highlights that the speed of resource deployment is critical to gaining a competitive edge. Firms that rapidly adopt digital technologies can better leverage their intangible resources, such as knowledge and data, to develop green innovations that outpace slower adopters (Elia et al., 2019; Lee et al., 2024). By quickly scaling innovation processes, they enhance the effectiveness of their green innovation initiatives, making it more likely to translate efforts into measurable environmental and economic benefits. Based on these two perspectives, we propose the third hypothesis:
H3: SDI plays a positive role in driving GIE through DI.
The business environment for non-manufacturing enterprises differs significantly from manufacturing firms in terms of innovation processes and resource utilization (Chesbrough, 2003; Da Silva Nascimento et al., 2024). Non-manufacturing enterprises typically face fewer physical constraints in implementing green innovations and can more readily integrate digital tools to enhance their environmental impact (H. Li et al., 2023). The flexibility inherent in the service and technology sectors allows these firms to rapidly adapt to digital innovations that improve environmental sustainability. Given these dynamics, we expect that DI will have a stronger impact on GIE in non-manufacturing enterprises compared to manufacturing firms, which may face more rigid infrastructure or regulatory challenges. Thus, we propose the fourth hypothesis:
H4: The influence of DI on GIE is more pronounced in non-manufacturing enterprises.
Enterprises in developed regions typically have access to more advanced infrastructure, greater technological resources, and more robust regulatory frameworks supporting sustainable practices (Pick & Nishida, 2014). These factors create a conducive environment for digital innovation to drive substantial improvements in green innovation outcomes (Hao et al., 2024). Additionally, firms in developed regions are more likely to receive government incentives and face stricter environmental regulations, which enhance the adoption of digital technologies aimed at improving sustainability (T. Fu & Jian, 2021). Therefore, we expect that the impact of DI on green innovation effectiveness will be more pronounced in enterprises located in developed regions, where these external supports are more prevalent. Thus, we propose the fifth hypothesis:
H5: The influence of DI on GIE is more pronounced in enterprises located in developed regions.
Data and Empirical Strategy
Data Source and Processing
The dataset comprises Chinese listed firms spanning the period from 2007 to 2022. It was constructed by integrating diverse data sources, including R&D and patent data from Chinese Research Data Services, financial information from the China Stock Market & Accounting Research Database, and digitalization-related terms extracted from corporate annual reports using text-mining techniques. To ensure the reliability and accuracy of the dataset, the following preprocessing steps were undertaken: (1) Financial firms were excluded due to their distinct governance structures and operational characteristics, which differ significantly from those of non-financial enterprises; (2) Firms under “special treatment” (ST)—those with consecutive losses over 2 years and at risk of delisting—were omitted to avoid anomalies; (3) Observations with missing data were removed to maintain data integrity and minimize potential biases; and (4) Continuous variables were winsorized at the 1st and 99th percentiles to mitigate the influence of outliers. As a result, the final sample consists of 4,128 firms. A comprehensive breakdown of companies by industry, manufacturing type, and geographic location is presented in Table 1.
Comprehensive Breakdown of Companies by Industry, Manufacturing Type, and Geographic Location.

Note: the classification of listed companies in China is based on the “Industry Classification Guidelines for Listed Companies” disclosed by the China Securities Regulatory Commission. The distinction between developed and developing regions in China is made according to various indicators such as economic development level, GDP, per capita income, infrastructure, education, and healthcare. The classification is primarily based on regional economic disparities. Developed regions are typically concentrated in the eastern coastal regions and include economically stronger regions (including Beijing, Tianjin, Hebei, Shanghai, Jiangsu, Zhejiang, Fujian, Shandong, Guangdong, and Hainan). Developing regions, on the other hand, are generally located in the central and western regions, as well as some less developed regions (including Shanxi, Anhui, Jiangxi, Henan, Hubei, Hunan, Inner Mongolia, Guangxi, Chongqing, Sichuan, Guizhou, Yunnan, Tibet, Shaanxi, Gansu, Qinghai, Ningxia, Xinjiang, Liaoning, Jilin, and Heilongjiang).
Variables Construction
Dependent Variable
This study adopts green innovation efficiency (GIE) as the core dependent variable. In economics, efficiency is defined as the ratio of resource inputs to outputs, serving as a critical measure of resource utilization and allocation. Traditional research on technological innovation efficiency has primarily focused on maximizing economic benefits, often neglecting ecological and environmental considerations (Y. Liu et al., 2020). Consequently, such studies fall short in evaluating innovation aligned with the principles of green development. To address this limitation, scholars have redefined GIE as the innovation efficiency that integrates environmental outcomes with economic benefits during the process of resource input and output, distinguishing it from conventional innovation efficiency, which focuses solely on economic outputs (e.g., Dutta et al., 2022; Ilhan et al., 2020).
Grounded in the Innovation Value Chain Theory (Roper et al., 2008) and following the methodological framework outlined by G. Li et al. (2022), this study specifically investigates corporate efficiency during the green technology R&D stage. Green patents were identified based on the environmental-friendly International Patent Classification (IPC) codes issued by the World Intellectual Property Organization (WIPO) in 2010. For measuring GIE, the inputs include full-time equivalent R&D personnel and internal R&D expenditures, while outputs consist of the number of valid green patent applications and green patent grants. By employing the DEA-SBM model, this study quantifies the efficiency of the green innovation process on a year-by-year basis. Specifically, for the green technology R&D stage, the initial input indicators are the full-time equivalent research staff and internal R&D expenditure. The intermediate output indicators include the number of patent applications, valid invention patents, and green invention patent applications. The efficiency for both stages is calculated using the DEA-SBM model, providing a robust framework for evaluating GIE. This approach integrates both environmental and economic dimensions, offering a nuanced understanding of the green innovation process in terms of resource inputs and innovation outputs.
Independent Variable
The primary independent variable in this study is digitalization (DI). Annual reports provide rich insights into corporate strategies and priorities, offering a valuable resource for analyzing firms’ strategic orientations (Kindermann et al., 2021). However, in Chinese, the same concept is often expressed through various terms, creating challenges for accurate textual analysis. Simply relying on the frequency of individual keywords to measure DI risks substantial information loss. To overcome this, we adopted an advanced methodology leveraging a neural network-based Word2Vec model trained on data extracted from company annual reports. This approach enables a more nuanced and comprehensive identification of DI-related language.
Our process involved several key steps. First, we targeted the Management Discussion and Analysis (MD&A) sections of annual reports from 2007 to 2022, where corporate strategies and green innovation priorities are extensively discussed. We began by identifying initial keywords such as “artificial intelligence,”“cloud computing,”“blockchain,”“big data,” and “digital technology application,” which represent core aspects of DI. Second, we set the model parameters for training the Word2Vec model. Specifically, the word vector dimension was set to 100, and the sliding window size was 5 words. We utilized both the Continuous Bag-of-Words (CBOW) and Skip-Gram (SG) models (Rong, 2014), with negative sampling to ensure efficient training. Third, we selected the corpus, which consists of annual reports from Chinese companies, focusing on the MD&A sections. The text data were preprocessed using Python tools, such as Jieba for tokenization. Stop words were removed, and normalization was performed to ensure consistency, ensuring that the text fed into the Word2Vec model was clean and relevant. Fourth, the neural network model generated word vectors to calculate semantic relationships between terms. To ensure that the expanded vocabulary was relevant to the concept of digital transformation, a post-processing step was applied. In this step, each newly identified keyword was manually reviewed for relevance to the digitalization context. Keywords that closely aligned with concepts such as “technology adoption,”“innovation,” and “digital transformation” were retained in the final dictionary. This approach minimized the risk of including irrelevant terms and helped create a more comprehensive vocabulary. Finally, with the enriched dictionary, we computed the frequency of DI-related keywords in each firm’s MD&A sections. These frequencies were log-transformed using the formula LN (keyword frequency + 1) to create a standardized measure of DI for all sampled companies. This robust metric not only captures the depth of firms’ engagement with digital transformation but also ensures consistency and comparability across the dataset (refer to Table 2 for details).
Keywords of Digitalization.

Source. Own.
Control Variables
In line with prior research (e.g., F. Chen et al., 2024; Phung et al., 2022; Schiederig et al., 2012), this study incorporates a range of control variables to address potential confounding effects. Firm Age (AGE), measured as the natural logarithm of the number of years since the firm’s establishment, serves as an indicator of organizational maturity and accumulated experience. Financial Leverage (LEV), defined as the ratio of total debt to total assets, captures the firm’s financial risk and capital structure. Return on Assets (ROA), calculated as net income divided by total assets, represents operational efficiency and profitability. Managerial Ownership (MO), measured as the percentage of shares held by executives and board members, reflects the alignment of managerial interests with those of shareholders, thereby addressing potential agency issues. Managerial Compensation (MC), proxied by the logarithm of the total annual remuneration of the top management team, accounts for financial incentives and their impact on managerial behavior. Finally, Board Size (BS), defined as the total number of directors on the board, provides insights into the governance framework and decision-making capacity.
Model Specification
To examine the impact of DI on GIE, we constructed the following panel data fixed-effects ordinary least squares model:

Here,
Empirical Results
Descriptive Statistics
Table 3 summarizes the distribution of the key variables used in the analysis. The dependent variable, GIE, exhibits an average value of 0.53 and variability across firms as indicated by a range of 0.153 to 0.973, reflecting differences in green innovation efficiency. The independent variable, DI, shows significant diversity in digital technology adoption, with a central value of 1.276 and observations spanning from 0 to 4.595.
Summary Statistics of Key Variables.

Source. Own.
The control variables highlight additional variability within the dataset. AGE, expressed as the natural logarithm of firm age, records a median value of 2.894, with observations ranging between 2.079 and 3.466. LEV, representing financial leverage, varies considerably, with a midpoint of 3.145 and a dispersion between 1.074 and 13.165. ROA indicates operational performance differences, with values extending from −0.181 to 0.190 around a typical value of 0.037. Managerial ownership (MO) spans a wide interval, from 0 to 62.719, with firms often clustering around 11.418. For managerial compensation (MC), reported as a natural logarithm, the most frequent value is 14.487, with observations ranging between 12.722 and 16.303, showing limited fluctuation. Lastly, BS, also logarithmically transformed to represent board size, clusters around 2.132, with governance structures varying moderately between 1.609 and 2.639.
Correlation and Variance Inflation Factor Analysis
Table 4 displays the Pearson correlation coefficients and VIF statistics. The correlation analysis reveals a significant positive relationship between DI and GIE (r = .313, p < .01), offering initial support for the hypothesis that DI positively influences GIE. The VIF results, with all values below 1.5, confirm the absence of multicollinearity issues among the predictors. The highest VIF is observed for MO at 1.27, further affirming that multicollinearity does not pose a problem in the model.
Pearson Correlation and Variance Inflation Factor Analysis.

Note.**p < .05 (significant at 5%), ***p < .01 (significant at 1%).
Univariate analysis
Table 5 provides a comparison of GIE between firms with and without DI. Firms classified as having DI (Dummy DI = 1) demonstrate a notably higher GIE average of 4.026, whereas those without DI (Dummy DI = 0) report a lower mean of 3.691. This difference, tested statistically, is significant (t = 0.335, p < .01). Furthermore, the linear regression line depicted in Figure 1 illustrates a positive relationship between DI and GIE, reinforcing the observation that digitalized firms achieve greater GIE compared to their non-digitalized counterparts.
Univariate Analysis.

Source. Own.
Significance at the 1% threshold.

The linear fit of DI and GIE.
Multivariate Results
Table 6 presents the baseline regression results examining the relationship between DI and GIE to test the hypothesis that digitalization positively influences green innovation efficiency. All regression models include both year and firm fixed effects to control for temporal and firm-specific variations that may influence the results. The estimation employs robust standard errors clustered at the firm level to ensure valid statistical inference.
Main Results.

Source. Own.
Note. All models utilize firm-level clustering for robust standard errors, with the corresponding robust t-values presented in brackets.
Significance levels are represented by *, **, and *** for 10%, 5%, and 1%, respectively.
Column (1) presents the regression results for the relationship between DI and GIE. The coefficient for DI is significantly positive at the 5% level (α1 = .0045), indicating that digitalization has a robust positive effect on green innovation efficiency without the inclusion of control variables. In columns (2) and (3), control variables are progressively added. The positive effect of DI on GIE remains significant at the 5% level in both models, confirming the robustness of the relationship between DI and GIE even after accounting for other factors.
Regarding the control variables, LEV (financial leverage) is significantly positive at the 10% level in models (2) and (3), suggesting that firms with higher leverage tend to exhibit greater green innovation efficiency. ROA (return on assets) has a significant negative effect in models (2) and (3), with coefficients of −0.0662 and −0.0806, respectively, indicating that more profitable firms are less likely to engage in green innovation. Furthermore, in model (3), MO (managerial ownership) and MC (managerial compensation) both show significant positive relationships with GIE, with coefficients of 0.0005 and 0.0065, respectively, suggesting that higher managerial ownership and compensation are positively associated with green innovation efficiency. However, AGE (firm age) and BS (board size) do not exhibit a significant impact on GIE, suggesting that these factors do not play a major role in shaping GIE in our sample.
Overall, our study confirms a positive correlation between DI indicators obtained through machine learning and corporate GIE, highlighting the importance of digital technologies. While the efficiency metric in this study differs from that used by Ferreira et al. (2018), who employed new product development as a measure of innovation output, the conclusions are similar. This evidence further substantiates the role of DI in enhancing both the input and output efficiency of green innovation by breaking organizational boundaries and bridging information gaps.
Robustness Checks
To ensure the validity of our findings on the positive relationship between DI and GIE, this section performs a variety of additional tests to check the robustness of the baseline results.
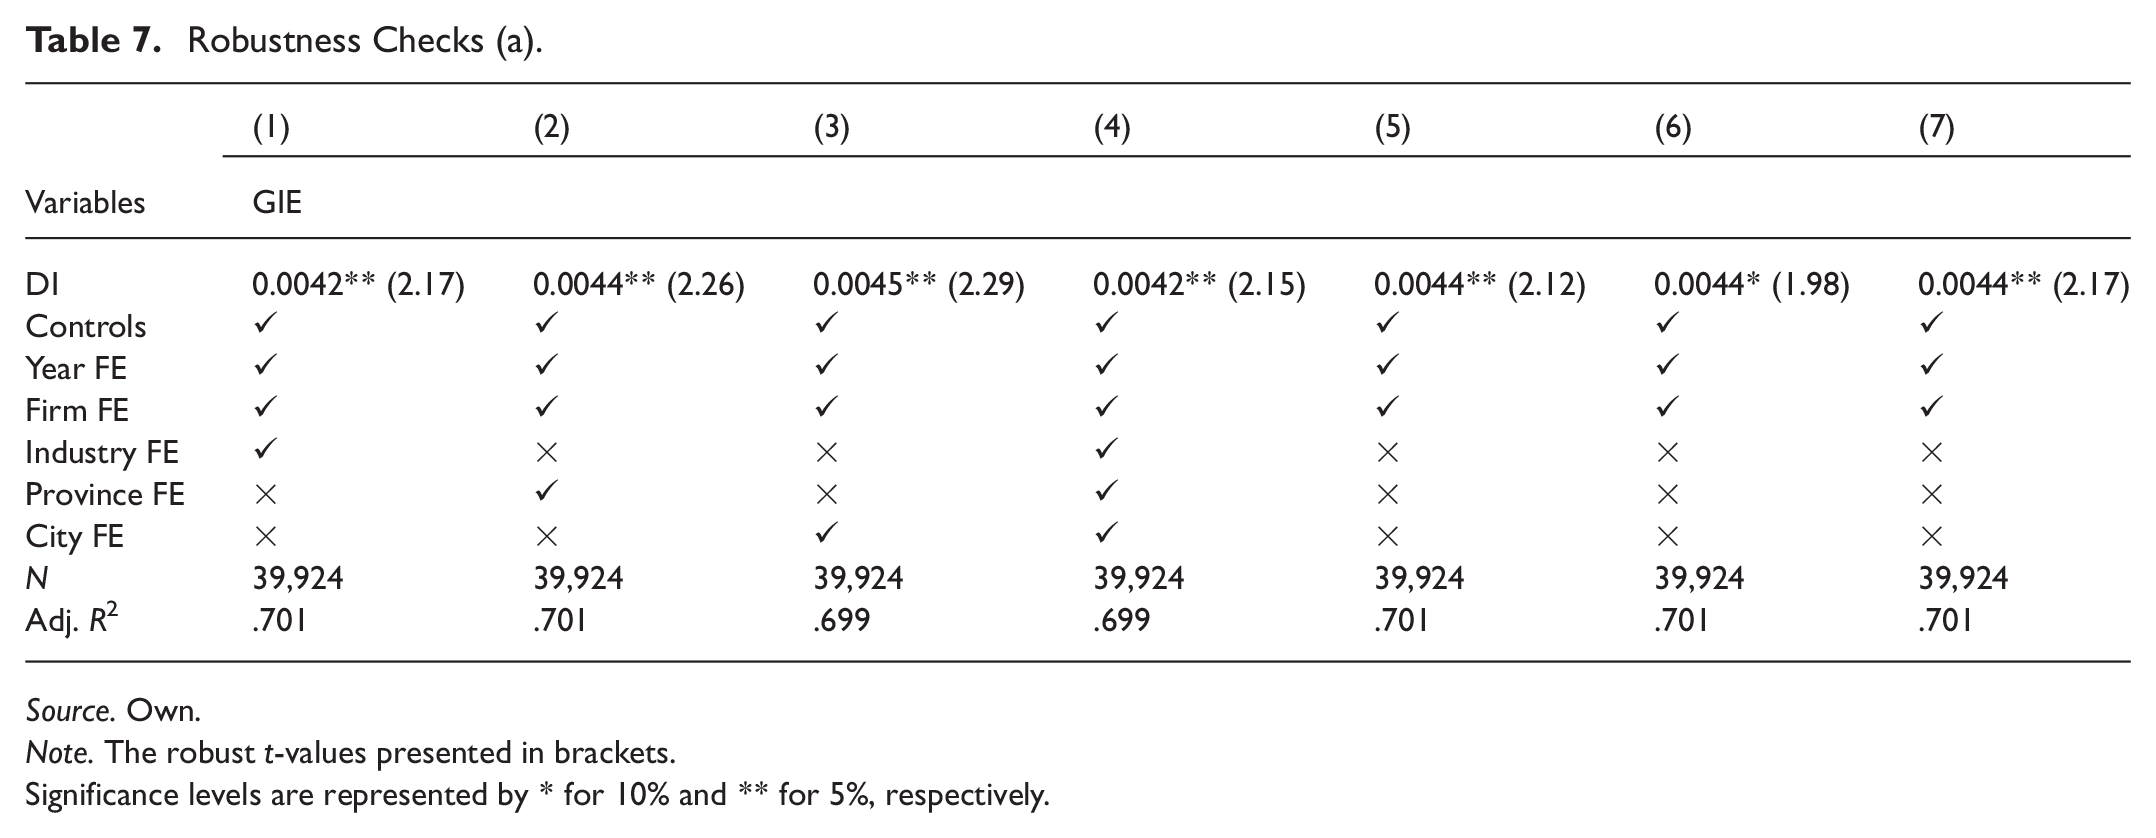
Additional Fixed Effects. To account for unobserved geographical heterogeneity and potential location-specific factors, we introduce additional fixed effects at the province, city, and industry levels based on the firms’ registered locations. Columns (1)–(4) of Table 7 report the results when these fixed effects are incrementally added, either individually or collectively. The inclusion of these additional fixed effects does not alter our primary findings, thereby strengthening the robustness of our conclusions.
Adjusted Standard Errors. To address potential correlations at higher aggregation levels—such as industry, province, or city—that might not be fully captured by firm-level standard error adjustments, we re-estimate the model using clustered robust standard errors at these levels. As shown in columns (5)–(7) of Table 7, the coefficients retain their statistical significance and magnitude across these specifications. This alleviates concerns about potential over- or under-adjustment of robust standard errors due to heteroscedasticity and autocorrelation, further validating the reliability of our findings.
Lagged Independent Variable. This approach is particularly suitable when the effects of an independent variable materialize gradually over time rather than immediately. For instance, DI initiatives often require time to influence outcomes such as GIE, as their effects may depend on the completion of projects, the adoption of new processes, or incremental organizational learning. By incorporating a 1-year lag (L.DI) and a 2-year lag (L2.DI), we aim to capture the delayed effects of DI on GIE. This approach mitigates potential simultaneity bias, as current DI could be influenced by contemporaneous GIE, and ensures that the impact of DI is measured within an appropriate temporal framework. Table 8 presents the results of robustness checks using lagged DI variables. Column (1) reports the regression results with DI lagged by 1 year (L.DI), while column (2) incorporates DI lagged by 2 years (L2.DI). In column (1), the coefficient of L.DI is positive and statistically significant at the 5% level, indicating that DI has a significant positive impact on GIE 1 year after its implementation. In column (2), the impact of DI extends to a 2-year lag, with L2.DI also exhibiting a positive and statistically significant coefficient at the 10% level. Although the statistical strength slightly decreases, the results suggest that the influence of DI persists over a longer temporal horizon. These findings provide additional support for the robustness of our main conclusions, highlighting the enduring and incremental effects of DI on GIE.
Subsample Tests. Subsample analyses were conducted to ensure the robustness of our findings by addressing potential biases introduced by unique sample periods and regional disparities. First, our sample includes data from two distinct periods: the global financial crisis (2008–2009) and the COVID-19 pandemic (2020–2021). Both periods represent significant economic disruptions that could introduce external shocks, potentially confounding the relationship between DI and GIE. Therefore, observations from these periods were excluded to examine whether the results hold in more stable economic conditions. Second, given the inherent digital advantages of firms located in China’s directly governed municipalities (Beijing, Tianjin, Shanghai, and Chongqing), their inclusion may lead to sample heterogeneity. These cities are at the forefront of digital transformation in China, and firms registered there may not represent broader patterns. To address this, we excluded firms based in these municipalities to test for the robustness of our results across more representative samples. Table 8 presents the results of these subsample tests. Column (3) excludes data from the global financial crisis period, column (4) excludes the COVID-19 pandemic period, column (5) excludes both periods simultaneously, and column (6) removes firms registered in the four municipalities. Across all subsamples, the coefficient for DI remains positive and statistically significant at the 5% level, indicating strong explanatory power across all sub-sampling sensitivity tests.
Alternative Estimation Method. To further ensure robustness, we employed a fixed-effects regression model with Driscoll-Kraay standard errors. This method is particularly advantageous as it accounts for heteroscedasticity, autocorrelation, and cross-sectional dependence, which are common in panel datasets with large cross-sectional and time-series dimensions. The results, presented in column (7) of Table 8, show that the coefficient for DI remains positive and statistically significant at the 5% level. The finding reinforce the robustness of our main conclusions while addressing potential statistical concerns.
Robustness Checks (a).
Source. Own.
Note: The robust t-values presented in brackets.
Significance levels are represented by * for 10% and ** for 5%, respectively.
Robustness Checks (b).

Source. Own.
Note. The robust t-values presented in brackets.
Significance levels are represented by * for 10% and ** for 5%, respectively.
Expanded Analysis
Dimensions of Digitalization
The empirical findings of this study confirm that DI positively influences GIE. However, a critical question emerges regarding which specific dimensions of DI are the most influential. Previous research underscores the transformative role of advanced digital technologies, such as artificial intelligence (AI) for machine learning and predictive analytics, blockchain (BC) for secure and transparent data management, cloud computing (CC) for scalable storage and processing, big data (BD) for advanced analytics and decision-making, and digital technology application (DTA) for integrating innovative solutions into organizational workflows, in redefining organizational operations and stimulating innovation (e.g., Guo et al., 2022; Simsek et al., 2019). These studies collectively demonstrate that these technologies enable firms to optimize innovation processes, strengthen R&D decision-making, ensure the sustainability of R&D efforts, and effectively mitigate agency-related challenges.
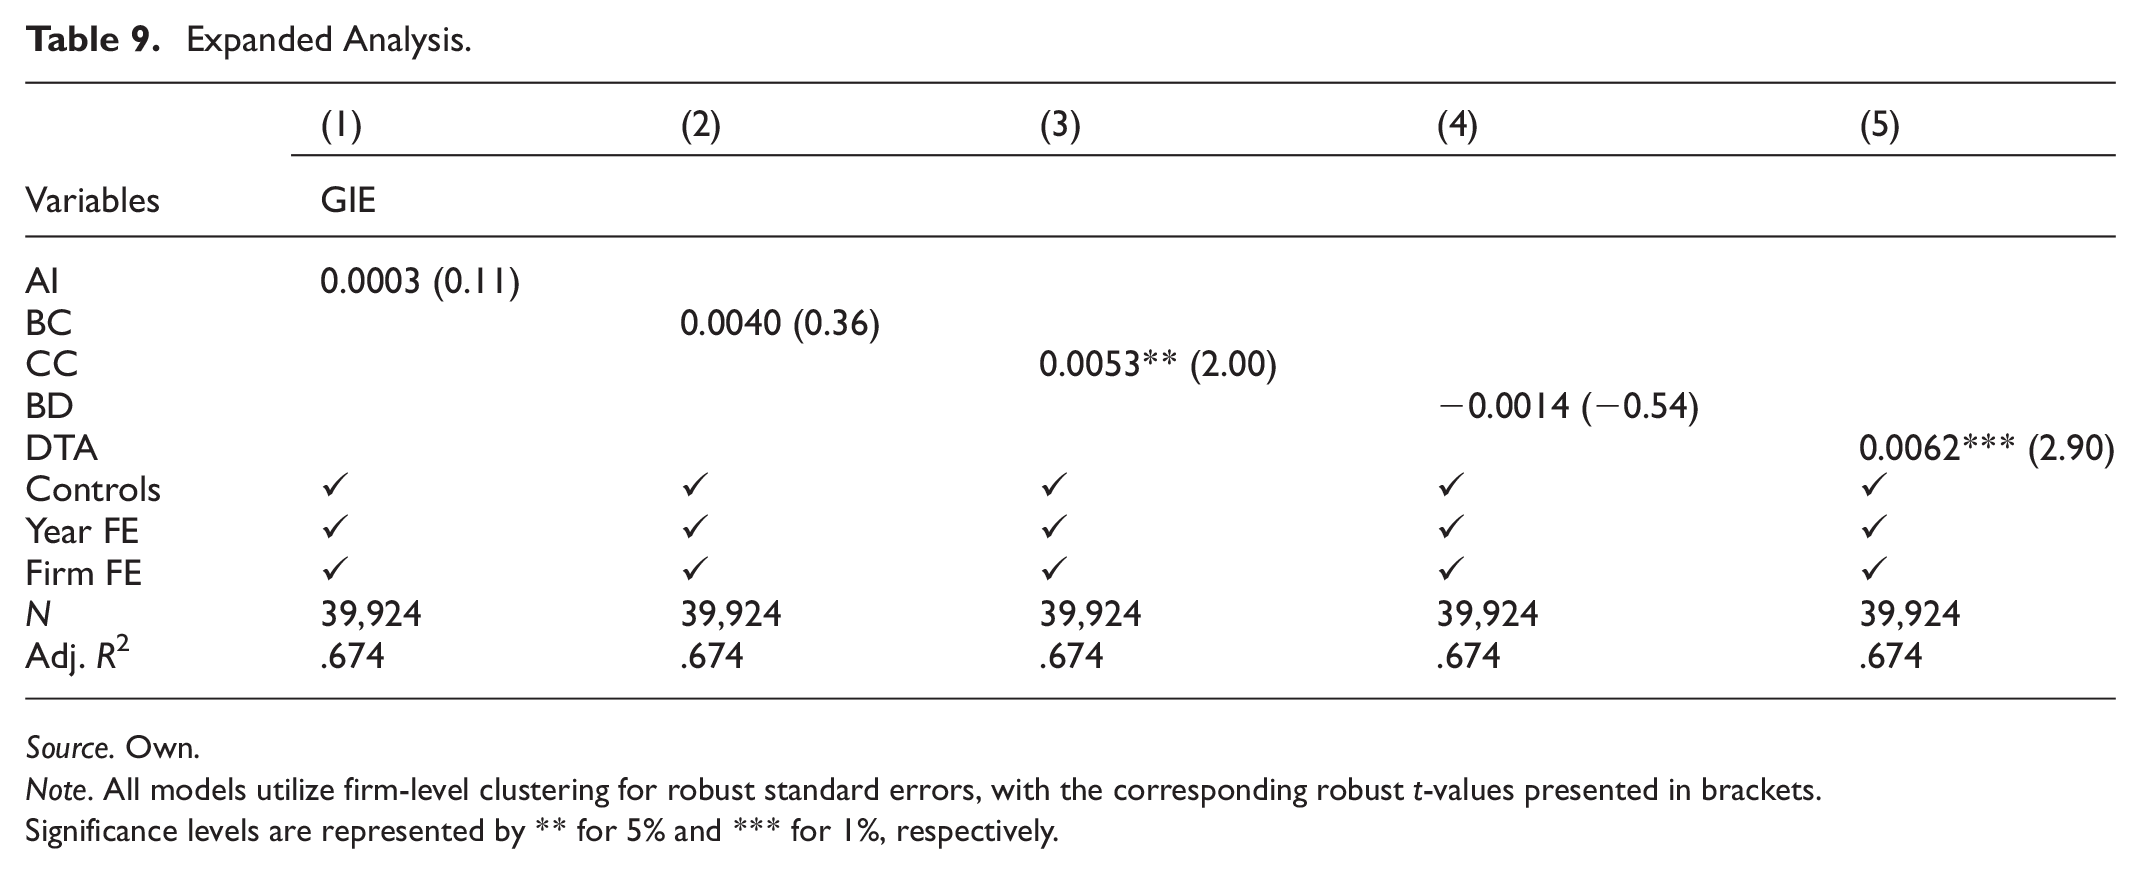
Despite these insights, the literature has yet to establish which specific dimensions of DI are most effective in navigating complex technological landscapes and driving improvements in GIE. To address this gap, we decompose the DI index into five distinct dimensions—AI, BC, CC, BD, and DTA. Table 9 presents the results of regressions for each dimension in columns (1) through (5). The results reveal heterogeneity across DI dimensions in influencing GIE. While AI, BC, and BD show no significant effects, CC demonstrates a significant positive impact at the 5% level, highlighting its role in optimizing green innovation processes. DTA emerges as the most impactful dimension, with a strongly significant positive effect at the 1% level, emphasizing its critical importance in fostering sustainable green innovation and adaptability.
Expanded Analysis.
Source. Own.
Note. All models utilize firm-level clustering for robust standard errors, with the corresponding robust t-values presented in brackets.
Significance levels are represented by ** for 5% and *** for 1%, respectively.
These findings align with the conclusions of Wang et al. (2023), who argue that digital technologies not only provide the necessary tools and infrastructure to support innovation activities but also create conducive paradigms for continuous improvement and exploration of novel solutions. Collectively, the results underscore the heterogeneous contributions of DI dimensions to GIE, with CC and DTA standing out as pivotal drivers in leveraging DI for GIE.
Speed of Digitalization
The pace of DI influences the allocation of resources within a firm (Jiang & Li, 2024). On the positive side, companies that quickly adapt to digital changes may gain a competitive edge, potentially stimulating increased green R&D expenditures to maintain this advantage. On the negative side, rapid digital transformation can introduce significant risks, such as disruptions to existing green R&D processes, integration challenges, and potential misalignment between new digital capabilities and ongoing green R&D activities. However, existing research has not adequately considered the speed of digitalization (SDI) in relation to green innovation-related processes.
To determine whether SDI is more beneficial than detrimental, we further test whether a higher SDI leads to increased GIE., we further test whether a higher SDI leads to increased GIE. We measure SDI using relative speed, specifically defined as SDI = (DI i,t − DIi,t − 1)/DIi,t − 1, where DI i,t represents the degree of firm digitalization in the current year, and DIi,t − 1 represents the degree of firm digitalization in the previous year. A higher SDI value indicates a faster pace of DI.
We reran model (1) with SDI as the independent variable and analyzed the relationship between SDI and GIE both with and without control variables. In the visualized data, Figure 2a (without control variables) shows that the coefficient for SDI is 0.0074, with significance at the 1% level. Similarly, Figure 2b (with control variables) supports the conclusion that SDI is a significant driver of GIE, as the coefficient and significance levels remain robust.

(a) Coefficients of SDI (no control variables). (b) Coefficients of SDI (with control variables).
Cross-Sectional Analysis
To elucidate the varied impacts of DI on GIE, this study conducts a cross-sectional analysis that accounts for industry differences and regional heterogeneity within China.
Industry Heterogeneity
The effect of DI on GIE may differ between industries due to variations in technological intensity, operational processes, and market structures. To examine this heterogeneity, cross-sectional analyses were conducted separately for manufacturing and non-manufacturing firms, with the results presented in columns (1) and (2) of Table 10.
Cross-Sectional Analysis.

Source. Own.
Note. All models utilize firm-level clustering for robust standard errors, with the corresponding robust t-values presented in brackets.
Significance levels are represented by ** for 5% and *** for 1%, respectively.
For manufacturing firms, the coefficient of DI is positive but statistically insignificant (α1 = .0025, t = 0.97), suggesting that DI has not yet yielded a measurable impact on GIE in this sector. In contrast, the coefficient for non-manufacturing firms is significantly positive at the 5% level (α1 = .0071, t = 2.23), indicating that DI plays a more prominent role in enhancing GIE outside the manufacturing sector. These findings highlight industry-specific differences in how DI drives GIE, with non-manufacturing firms benefiting more significantly.
Regional Heterogeneity
The extent of regional development and the accompanying digital infrastructure significantly influence how DI impacts GIE. Firms in developed regions often have greater access to advanced technologies, skilled labor, and policy support, which can enhance the effectiveness of DI in fostering GIE. Conversely, developing regions may face infrastructural and institutional constraints that limit the potential benefits of DI.
Using regional classifications, this study explores the heterogeneity in the impact of DI on GIE across developed and developing regions. As shown in columns (3) and (4) of Table 10, the results reveal substantial regional disparities. In developed regions, the coefficient of DI is positive and highly significant at the 1% level (α1 = .0062, t = 2.68), indicating that DI significantly promotes GIE in these areas. In contrast, the coefficient for developing regions is negative and statistically insignificant (α1 = −.0011, t = −0.29), suggesting that DI does not contribute to improving GIE in developing regions.
These findings highlight a pronounced regional imbalance in the relationship between DI and GIE, underscoring the critical role of regional development and infrastructure in enabling the green benefits of DI. Addressing these disparities requires targeted policy interventions to enhance digital capabilities and infrastructure in developing regions.
Discussion
This study provides robust evidence that DI significantly enhances GIE, with notable contributions from the CC and advanced DTA dimensions. These findings align with the broader literature highlighting the transformative potential of digital tools in reshaping innovation ecosystems (e.g., Elia et al., 2019). By contrast, AI, BC, and BD dimensions, while theoretically promising, show no substantial effect on GIE in this study. This outcome is consistent with prior research indicating that the application of these technologies often requires extensive infrastructural, organizational, and regulatory alignment before yielding tangible innovation benefits (Bygstad & Øvrelid, 2020).
The observed prominence of CC and DTA reflects their practical and immediate applicability in optimizing resource allocation and facilitating collaborative innovation. CC supports scalable infrastructure and data-sharing capabilities, essential for green innovation, while DTA directly integrates digital solutions into production and service processes, driving efficiency and sustainability (Bolón-Canedo et al., 2024). In contrast, AI and BD, despite their theoretical utility, often involve high costs and complex implementation challenges that may limit their effectiveness in resource-constrained or less technology-intensive settings (Cadden et al., 2023; Leng et al., 2024; Ma et al., 2022). The application of AI and BC, in particular, requires a high degree of technological maturity and organizational alignment, factors that are not readily available in many sectors (Bygstad & Øvrelid, 2020). One potential reason for this limited effect could be the high initial investment and the long-term commitment needed to fully integrate these technologies into existing systems, particularly in industries where digital infrastructure and skilled labor may be lacking.
Moreover, the speed of DI emerges as a critical driver of GIE. Firms that rapidly adopt digital technologies gain a competitive edge by reducing operational inefficiencies and aligning their practices with sustainability goals. This finding underscores the importance of digitalization strategies that emphasize agility and the swift integration of digital tools (e.g., Da Silva Nascimento et al., 2024; Goraya et al., 2024; Lu et al., 2023). However, it is also worth considering that the pace of adoption may not be uniform across all firms. It is conceivable that firms in industries with high innovation potential or those with greater access to digital resources may be able to adopt technologies more rapidly, thus further amplifying the positive effects on GIE.
The cross-sectional analysis further reveals that the impact of DI on GIE is more pronounced in non-manufacturing sectors and developed regions. Non-manufacturing firms, characterized by higher service intensity and lower capital rigidity, may more readily leverage digital platforms to innovate sustainably (Y. Li et al., 2020; Lu et al., 2023). In contrast, manufacturing firms, which often have higher capital investment requirements, may find it more challenging to implement digital solutions at scale. Furthermore, the relatively high capital expenditures involved in adopting advanced technologies may divert resources from other sustainability initiatives, limiting the overall impact on GIE ( H.Fu et al., 2023).
Similarly, developed regions benefit from advanced digital infrastructure, skilled labor, and favorable policy environments (J. Zhou et al., 2022), which collectively amplify the green innovation benefits of digitalization. The presence of robust digital ecosystems in these regions enables firms to harness the full potential of DI more effectively. However, it is important to note that this effect may not be as pronounced in developing regions, where infrastructure and skill gaps may hinder the adoption and effectiveness of digital technologies. These regional and sectoral disparities are consistent with the literature emphasizing the contextual factors influencing the efficacy of digital technologies (Pu & Zulkafli, 2024). These findings suggest that DI’s impact on GIE is not universal, but rather shaped by a complex interplay of industry characteristics, regional development, and digital infrastructure.
In summary, this study underscores the heterogeneous impact of DI on GIE, highlighting the pivotal roles of CC and DTA, the critical influence of SDI, and the pronounced effects in non-manufacturing sectors and developed regions. Table 11 summarizes all the findings of this study. These findings contribute to a nuanced understanding of how DI drives sustainability-oriented innovation and provide actionable insights for firms and policymakers aiming to maximize the environmental benefits of DI.
Summary of Hypotheses and Findings.

Source. Own.
Conclusions
Using data from Chinese firms, this study investigates the impact of digitalization on green innovation efficiency. The findings reveal that digitalization significantly enhances green innovation efficiency, driven predominantly by two dimensions: cloud computing and advanced digital technology application. These technologies streamline resource allocation, enable real-time data integration, and support eco-friendly innovation processes, underscoring their transformative potential. In contrast, technologies such as artificial intelligence, blockchain, and big data show no substantial effect on green innovation efficiency. This may be due to their higher implementation costs, complex integration requirements, and limited scalability within green innovation frameworks.
Additionally, the speed of digitalization emerges as a critical factor in driving green innovation efficiency. Firms that rapidly adopt digital technologies can better align their operations with environmental imperatives, reducing inefficiencies and achieving sustainability goals more effectively. Cross-sectional analysis further highlights that the impact of digitalization is more pronounced in non-manufacturing sectors and developed regions. Non-manufacturing firms, with their flexibility and service-oriented focus, are better positioned to leverage digital platforms, while developed regions benefit from advanced infrastructure, skilled labor, and supportive regulatory environments, amplifying the green innovation benefits of digitalization.
In light of these findings, this study makes several significant contributions to the literature on digitalization and green innovation efficiency. First, it provides empirical evidence highlighting digitalization as a pivotal driver of green innovation efficiency, with its impact predominantly mediated through the dimensions of cloud computing and advanced digital technology application. These findings extend the existing body of knowledge by demonstrating that not all digital technologies contribute equally to green innovation efficiency, offering a nuanced understanding of how digital transformation fosters sustainability-oriented innovation. This distinction underscores the need to focus on scalable, practical digital tools rather than costly or complex technologies like artificial intelligence, blockchain, or big data, which may currently face implementation challenges in green innovation contexts.
From a policy perspective, the findings provide key insights for policymakers and corporate leaders seeking to maximize the benefits of digital transformation for green innovation. Policymakers should prioritize digital infrastructure investments, particularly in underdeveloped regions and manufacturing sectors, which have been slower to embrace green innovation. Emphasizing technologies like cloud computing can support firms in balancing economic competitiveness with environmental sustainability. Moreover, accelerating digital adoption through targeted incentives and skill development can help achieve national sustainability objectives. For businesses, aligning digital transformation efforts with sustainability goals is crucial, particularly by integrating digital platforms that enhance resource efficiency and foster green innovation. This study offers both theoretical advancements and practical strategies for leveraging digitalization to drive global sustainability agendas.
Despite the valuable contributions of this study, several limitations warrant consideration. First, the findings of this study are primarily based on data from China, and their applicability to other regions or international contexts may be limited, which should also be addressed in future research. Second, examining the interplay between digitalization speed and other industry-specific factors could provide a deeper understanding of its role in driving sustainable innovation globally. Third, while green patents are an important measure, the number of patents may not necessarily equate to technological commercialization or environmental benefits, as patent approvals could be influenced by government policies. Fourth, while companies may emphasize digitalization applications in their reports, the actual level of digitalization implementation may vary, potentially leading to discrepancies.
Footnotes
Author Contributions
Tingqian Pu: Conceptualization; Data curation; Formal analysis; Investigation; Methodology; Resources; Software; Visualization; Writing—original draft; Writing—review & editing.
Funding
The author received no financial support for the research, authorship, and/or publication of this article.
Declaration of Conflicting Interests
The author declared no potential conflicts of interest with respect to the research, authorship, and/or publication of this article.
Data Availability Statement
The original contributions presented in the study are included in the article, further inquiries can be directed to the corresponding author/s.