
Abstract
This paper investigates the impact of green products/services and their drivers on the increase in the turnover of SMEs. The paper aims to fill the gap in the literature and create a clear picture for SMEs managers related to the impact of green products on SMEs turnover, as well as for policymakers related to the most impactful drivers for introducing green products by SMEs. The logit regression models were applied to a sample of 1,221 SMEs (for which green products/services represent more than 50% in annual turnover) in 36 European countries (EU + Western Balkans). The possible contribution of three groups of drivers (SMEs green technical expertise, SMEs own financial resources, and external support) was analyzed. The countries were divided into four clusters according to the current level of green economy development in the SME sector. The results show that all drivers will lead to an increase in turnover of green products/services brought to the market by SMEs in Europe only in countries with a moderately high level of green economy development. However, external support has insignificant impact on the turnover of SMEs offering green products in countries with an extremely high level of green economy development. Contrary, own financial resources are statistically insignificant for the increase in turnover of SMEs in countries with the lowest level of green economy development. Finally, the influence of own technical expertise is not statistically significant for the increase in turnover of SMEs only in countries with the lowest level of green economy development.
Keywords
Introduction
The massive use of fossil fuels during the 20th century has caused the “greenhouse effect,” and raised concerns about environmental problems. Climate change, environmental degradation, and financial constraints have become major challenges for the economy. The negative impact of climate change on people and the consequences of environmental problems on the living world lead to increased awareness about the necessity for the transition toward a green economy. Green-oriented companies have a vital role in a green economy. However, green orientation of companies involves redesigning and redefining their business models, products, and services in the direction of increasing energy efficiency, bringing green products and services to the market, re-manufacturing, repairing, maintaining, recycling, and eco-designing in a greener value chain, accessing the markets in areas such as climate change, etc. This paper will focus on companies bringing green products/services to market.
Previous research has shown that products/services are mainly brought to the market by large companies, while the involvement of SMEs in a green economy is much lower (Rodrigues & Franco, 2023). On the other hand, the impact of SMEs on the green economy is great (the individual impact of SMEs is small, but their cumulative impact on the environment is significant, due to SMEs’ significant participation in the global economy; Feng et al., 2018). The key reasons for the small involvement of SMEs in the green economy are limited resources and a large number of barriers (Abdesselam et al., 2024; Hoogendoorn et al., 2019; Karman & Pawłowski, 2022). The key research questions of this paper are the following: What could drive SMEs to introduce green products/services in the future? What would be the contribution of green products/services and their drivers to the turnover of SMEs?
The qualitative research indicates a large number of drivers of green orientation that have a positive impact on the performance of SMEs (Boutry & Nadel, 2021; Rodrigues & Franco, 2023). However, empirical evidence is broadly scattered across diverse cultures, disciplines, research domains, and journals (Oduro, 2024). To this end, we lack a clear picture related to key drivers of SMEs to introduce green products/services and their impact on performances. The main motivation of this research is to create a clearer picture for managers of SMEs and macroeconomic policymakers, as well as fill the gaps in the literature, related to impactful drivers of SMEs for green products/services.
The paper examines the possible impact of different drivers for introducing green products/services in SMEs on their turnover. We selected the following drivers, based on the literature review and Report of Flash Eurobarometer “SMEs, green markets and resource efficiency” (EC, 2022): own financial resources, own technical expertise, and external support. Logit regression with data from Flash Eurobarometer 498, on a sample of 1,221 SMEs in Europe is applied to examine how each of these drivers will affect the change in the turnover of SMEs offering green products/services where green products/services represent more than 50% in annual turnover. The paper aims the following: (a) to develop a theoretical basis for further empirical research, to fill the gaps in the literature related to the link between green products/services and SMEs performance; (b) to develop a clearer picture for SMEs managers about the contribution of green products to the turnover of SMEs, (c) to build a clearer picture for economic policymakers related to the drivers that have the greatest impact on SME performance to predict and implement incentive measures for increasing the involvement of SMEs in the green economy.
The paper first gives an overview of the literature that investigates the green economy, and performance drivers of SMEs offering green products/services. The next part of the paper presents the methodology, the obtained results, the discussion of results, and recommendations to managers and policymakers. The final part of the paper presents concluding remarks.
Literature Review and the Hypotheses Development
The green economy refers to an economic system that focuses on sustainability and reducing environmental impact while promoting social and economic well-being. It aims to achieve a balance between economic growth, environmental protection, and social progress. The core principles of the green economy include (Ciocoiu, 2011; Tucci, 2018; Tursunalievna, 2020; UNEP, 2024): environmental sustainability, low carbon and clean energy, resource efficiency, green jobs and social equity, economic resilience, green innovation, and technology.
Given the fact that SMEs make up the majority of business ventures – specifically within the EU, a lot of governments are focused on green action of SMEs in their environmental strategies and action plans. An additional reason is that SMEs create a large number of environmental problems. Although their individual impact is small, their cumulative impact on the environment is significant. For example, SMEs are responsible for between 60% and 70% of total pollution, at least in Europe (Gorgels et al., 2022). Also, the participation of SMEs in total CO2 emissions is high, at the level of 63% (average SME emits very little CO2– 67 tons, especially compared to emissions of 20,027 tons for the average large company, but due to the large number of SMEs, their collective share is high) (Muller et al., 2022). On the other hand, the participation of SMEs in green practice is relatively low (Bassi & Guidolin, 2021).
To increase participation of SMEs in green economy the European Commission announced the SME Strategy in 2020 and the Green Action Plan for SMEs. The Action Plan presents a series of SME-oriented actions proposed at European level to help exploit the business opportunities that the transition to a green economy offers, by improving resource efficiency of European SMEs, supporting green entrepreneurship, exploiting the opportunities of greener value chains, and facilitating market access for green SMEs (EC, 2014).
An increasing number of scientific researches have been conducted in recent years to facilitate the implementation of these strategies. According to bibliometric research conducted by Maesaroh et al. (2024), articles on the green economy in SMEs show an increasing trend over the last 20 years (from 1997 to 2022), while the most significant progress has been made in the last 3 years. According to their research, there are significant differences in research impact and research areas. India and the United Kingdom are countries with the greatest influence on this topic. The most recent areas of research are related to environmental management and business performance, while topics related to green entrepreneurship, based on green products/services, are still rarely used in previous research (green entrepreneurship is a new topic with few studies). This paper focuses on the examination of the contribution of green products/services (as a form of green corporate entrepreneurship) to the performance of SMEs. Also, the drivers of SMEs in introducing green products/services and their impact on the SMEs turnover will be examined.
The Importance of Green Products/Services for Business Performances and the Green Economy Development
A green product is a sustainable product based on green (eco) innovation. It is designed to minimize its environmental impacts. Green product is manufactured using toxic-free ingredients and environmentally friendly procedures and is certified by recognized organizations (Deif, 2011; Geng et al., 2021). Some of the characteristics of a green product are: grown without the use of toxic chemicals and within hygienic conditions, can be recycled, reused, and is biodegradable in nature, comes with eco-friendly packing, uses the least resources, is eco-efficient, has reduced or zero carbon footprint, has reduced or zero plastic footprint (Dangelico & Pontrandolfo, 2010). The aforementioned characteristics of green products enable the development of a green economy by offering new ways of solving environmental problems (C. H. Chang, 2011; Rennings & Rammer, 2009). For example, the adoption of green products mitigates the risk of resource overexploitation and dependence on fossil fuels, while promoting energy generation from natural sources. These products also contribute to environmental preservation by utilizing organic, biodegradable materials and minimizing the use of non-renewable resources and toxic chemicals in energy production (Fehrer & Wieland, 2021). Consequently, this curtails the emission of greenhouse gases such as ozone and methane, thereby mitigating pollution and averting the adverse effects of climate change (Confente et al., 2020; Hall et al., 2010).
In addition to their enormous ecological importance, green products also contribute to economic development to a certain extent. The introduction of green products in existing companies or by establishing new ones, has a great contribution to sustainable development thanks to the creation of jobs, the prevention of excessive use of resources, and the protection of the environment (Bansal, 2005; Garg & Sharma, 2017; Kammerer, 2009; Le & Ikram, 2022; Malesios et al., 2018). As per research conducted by the International Energy Agency (IEA, 2023), the renewable energy sector witnessed the creation of nearly 7 million new job opportunities in 2022, marking a 6.3% increase compared to 2021. Projections suggest that this figure could potentially surge to 16 million by 2027 if the demand for green products continues to escalate. Consequently, the advancement of green products not only improves environmental conditions but also enhances economic prospects (Hall et al., 2010).
Enterprises play a key role in the development and commercialization of green products (Luo & Zhang, 2021). Company managers decide to introduce green products to fulfill their obligations to society, however, to justify their decisions to shareholders, green products must contribute to the improvement of business performance (Luo & Zhang, 2021). Numerous qualitative studies explain the positive impact of green products on business performance. For example, Rodrigues and Franco (2023) explained that the development of green products opens the doors to an all-new market of green consumers who buy only green products and even pay more for them. Entrance into new markets leads to an increase in turnover, income, and profit of SMEs, in the short term. At the same time going green may have a positive impact on the long-term performances of SMEs such as following: improving competitive advantage, building a positive public image, acquiring brand loyalty of customers who prefer green products, etc. (C. Chang et al., 2022; Dangelico & Pontrandolfo, 2010).
Despite the numerous explanations of the positive influence of green products on business performance, pertinent issues remain open to research. First, we lack a clear picture and an organizing framework due to empirical evidence of the correlation between green products and business performance is broadly scattered across diverse cultures, disciplines, research domains, and journals (Oduro, 2024). Second, research on the impact of green products on business performance has yielded inconsistent results, with some demonstrating strong positive associations (Singh & Chakraborty, 2021), some negative relationships (e.g., Jové-Llopis & Segarra-Blasco, 2018), and others showing the non-significant relationship (e.g., Chege & Wang, 2020; Geng et al., 2021). One reason is that many studies are conducted in different cultures and sectors (Zubeltzu-Jaka et al., 2018). Another important gap in the literature that needs consideration is that the existing reviews on the relationship between green products and performances arise from conceptual studies and qualitative reviews. The results of the latest meta-analysis employing a psychometric meta-analytic approach with a random effects model, examining a sample of 134,841 companies covering 99 studies and 233 research) conducted by Oduro (2024) have shown that the average impact of green products on sustainable performance is positive and significant.
However, the development of green products assumes innovation, which requires a large investment in research and development (R&D), which is not available to every company (Bouraoui et al., 2019). In addition, green innovation very often increases the cost of developing the products, which results in making them a bit more costly than the available alternatives in the market. The cost factor usually discourages consumers from buying them. The general public is still ignorant about the importance and benefits of going green (Rodrigues & Franco, 2023). Many companies cannot meet these conditions. As SMEs are smaller in size compared to large companies they encounter numerous challenges when incorporating environmentally friendly practices into their operations.
Several studies have explored the challenges associated with the adoption of eco-friendly business practices within SMEs, uncovering various hurdles. For instance, Gupta and Barua (2018) categorize seven clusters of potential obstacles that SMEs might encounter when implementing green products: organizational or managerial, technological, financial and economic, external partnership and stakeholder engagement, government support, market and customer, and knowledge and information-related barriers. They argue that the limited resources frequently observed in SMEs are primarily attributed to technological, as well as knowledge- and information-related obstacles (O. H. Chang & Slaubaugh, 2017). Also, a serious obstacle for SMEs is the lack of knowledge and skills to design, produce, and commercialize green products (O. H. Chang & Slaubaugh, 2017).
Bearing in mind the mentioned and numerous other challenges and limitations, as well as the fact that SMEs do not suffer a lot of environmental pressure from external stakeholders, many of them find it very difficult to decide on bringing green products to the market. On the other hand, the negative cumulative impact of SMEs on the natural environment is significant and is getting bigger. It is desirable to encourage the participation of SMEs in the green economy (including the offer of green products), which many countries are working on. In this direction, it is necessary to identify the drivers of SMEs to bring green products; to predict their possible impact on the SMEs performance in the future, and to implement supporting measures.
Drivers of SMEs to Bring Green Products to the Markets
The largest number of previous research on drivers of SMEs in introducing green products has analyzed the following three groups of factors: technology push, market pull, and regulation (Abdesselam et al., 2024). Some of them go further in their analysis by taking into account the factors of cooperation and the diffusion of knowledge (Castellacci & Lie, 2017; Doloreux & Kraft, 2019). Also, Anik and Sulistyo (2021) indicate that a significant driver of SMEs bringing green products is the “green knowledge and skills” of entrepreneurs and employees.
More recent empirical research, conducted by Abdesselam et al. (2024) identified four categories of drivers of SMEs to introduce green products/services: (1) firms’ resources and characteristics, (2) the entrepreneur, or more precisely the interaction between the entrepreneur and his/her firm, (3) contextual factors surrounding the firm, (4) products and services as well as the target market. A similar classification of factors (except for the last one – market), acting as both motivators and obstacles in the adoption of green products by SMEs, is stated in Flash Eurobarometer Report (EC, 2022, pp. 104–110). It includes the following factors: own financial resources, own technical expertise, and support from external stakeholders.
A great number of studies have highlighted firms’ resources and characteristics as key drivers of green practice (Castellacci & Lie, 2017; Doloreux & Kraft, 2019; Triguero et al., 2016). Among those drivers, the availability of resources (technology, finance, people, and know-how) stands out as a critical determinant (de Jesus Pacheco et al., 2018). The technology push factor is associated with technological capabilities which mainly combine human capital and physical capital (Horbach, 2008; Triguero et al., 2013). SMEs usually do not have a large technological capacity, so this factor is characteristic of large enterprises. On the other hand, financial resources can be a very significant driver/constraint for SMEs (Scarpellini et al., 2018).
Previous research indicates that the lack of financial capital represents one of the most significant barriers for SMEs and entrepreneurs, particularly in the context of introducing green products (Triguero et al., 2013). For instance, a survey conducted in the UK by Social Enterprise reveals that insufficient funding is perceived as a major hindrance to the implementation of green product innovation in SMEs (Baldock & Mason, 2015; Munari & Toschi, 2015). One of the reasons is the reliance of SMEs on internal sources. The first source of financing available to SMEs investing in a green project is internal liquidity (Cecere et al., 2020). If SMEs have insufficient internal funds to allocate, they need to find external funding, in the form of bank loans, equity capital, or public financial support. Banks and creditors, very often, are not interested in investing in eco projects of SMEs, due to investment in green products is highly risky and extremely uncertain, since the outcomes are unknown (Mina et al., 2013). New financial sources such as green venture capital funds and crowdfunding offer additional opportunities (Bocken, 2015; Dhayal et al., 2023; Lehner & Nicholls, 2017; Polzin, 2017). But, keeping in mind that returns on green innovation projects are extremely skewed, a small number of green projects get the possibility of financing from these sources (Kerr & Nanda, 2015). It points to the conclusion that SMEs invest in new green products only when they have a cash surplus. We assume that own financial resources are a significant driver for introducing green products in SMEs in that case (when there is a surplus of cash). Since the introduction of new products opens new markets and brings new consumption, we expect that it will lead to an increase in the turnover of SMEs. This leads us to propose our first hypothesis:
Apart from financial obstacles, SMEs encounter numerous non-financial drivers, such as entrepreneur’s values and culture, “green skills” and full-time employees in “green jobs” (Muñoz & Dimov, 2015). The entrepreneur’s specific values and culture have an extremely important role in green initiatives in SMEs (Gast et al., 2017). Sustainable entrepreneurs have specific motivators that encourage them to develop and offer green products (Bocken, 2015).
On the other hand, designing, manufacturing, and commercializing green products requires green knowledge and skills (Bassi & Guidolin, 2021). Moreover, many “green jobs” are also relevant (Patzelt & Shepherd, 2011). A “green job” is defined as a position directly involved with information, technologies, or materials aimed at preserving or restoring environmental quality (Kirchherr et al., 2017). The effective performance of “green jobs” necessitates specialized expertise, knowledge, training, or experience in environmental compliance verification, resource efficiency monitoring within the company, as well as the development, promotion, and sale of green products and services. Previous studies have highlighted that the lack of “green skills” and environmental proficiency can pose challenges when initiating a “new green (eco) business” (Bassi & Guidolin, 2021). Additionally, a limited workforce engaged in green jobs represents a significant barrier for existing SMEs aiming to develop or introduce green products/services (Rodrigues & Franco, 2023). We contend that enhancing the green skills of SME workers and increasing the number of full-time employees in green jobs could drive SMEs to bring green products/services and impact the turnover of SMEs. This leads to our second hypothesis:
Finally, previous research shows, that context-related determinants could be very important, for the relationship between green products and SMEs performance, due to the strong interaction between SMEs and their environment (Guo et al., 2022). For example, the environmental policy factor can encourage green practice through access to public instruments and the regulatory push/pull effect (Gast et al., 2017).
Access to public instruments such as public funds and fiscal incentives seems to be an important driver for the development of eco-innovations (Demirel & Kesidou, 2019). The available empirical evidence shows that subsidies (and tax incentives) are very important for the introduction of green products, but their effectiveness depends on the size of the funding gap, that is, the difference between the project costs and the available private funds, the capacity of the technology to compete for public funds with others, the likelihood of technology failure, and the type of investor (Cecere et al., 2020).
Also, many countries have imposed regulations on individuals, companies, and organizations to safeguard ecosystems from damage. Environmental regulations can play a crucial role in stimulating public concern and driving shifts in consumption patterns toward more eco-friendly alternatives, thus driving demand for green products by companies (Liao & Tsai, 2019). Regulations imposed on companies to protect the environment, coupled with the rising demand for eco-friendly products, have spurred the development of innovative techniques to improve environmental performance (Achmad et al., 2023).
“External knowledge” might be a very useful driver of SMEs to bring green products to the market (De Marchi, 2012). A crucial driver for green product introduction is very often cooperation between heterogeneous partners such as firms (De Marchi, 2012), clients, distributors, suppliers (Buttol et al., 2012; Cainelli et al., 2012; Cainelli & Mazzanti, 2013), universities (Triguero et al., 2013), and governmental partners (Doblinger et al., 2019).
We can conclude that for SMEs, lacking resources and political influence, a very important driver can be a favorable business environment. External support can, in different ways facilitate the creation, production, and commercialization of green products in SMEs, which leads to continuous improvement of their business performances and turnover growth (Agrawal & Hockerts, 2021; Pinkse & Groot, 2015). We anticipate that this pattern will persist in the future. Thus, our subsequent hypothesis is:
Data and Methodology
Research Context
Europe’s 23 million SMEs serve as the cornerstone of the European economy, comprising over 99% of all enterprises and 95% of private-sector firms. Employing approximately 90 million individuals, they contribute to roughly half of Europe’s gross domestic product (GDP) and play a pivotal role in value addition across every sector of the economy. Consequently, SMEs hold significant economic importance. However, they also exert environmental significance. Hence, many European nations have initiated the implementation of green action plans, leading to an enhanced contribution of SMEs to sustainable development. Nevertheless, there are considerable variations among countries in the efficacy of these initiatives. This paper aims to analyze the disparities in the prevalence of SMEs offering green products across European countries.
European Commission has monitored companies that offer green products/services since 2012 and published the Report Flash Eurobarometer SMEs, green markets, and resource efficiency. According to the last Flash Eurobarometer Report 498 (EC, 2022), about one of three (32%) SMEs in Europe offer green products or services, with a further 11% planning to do so in the next 2 years. The number of SMEs offering green products increased in almost all European countries in the observed period from 2012 to 2021. Certain progress was also achieved in 2021 compared to 2017 when the previous research was done. This is shown in Table 1.
SMEs Offering Green Products/Services in 2021 Compared to 2017, by Countries.
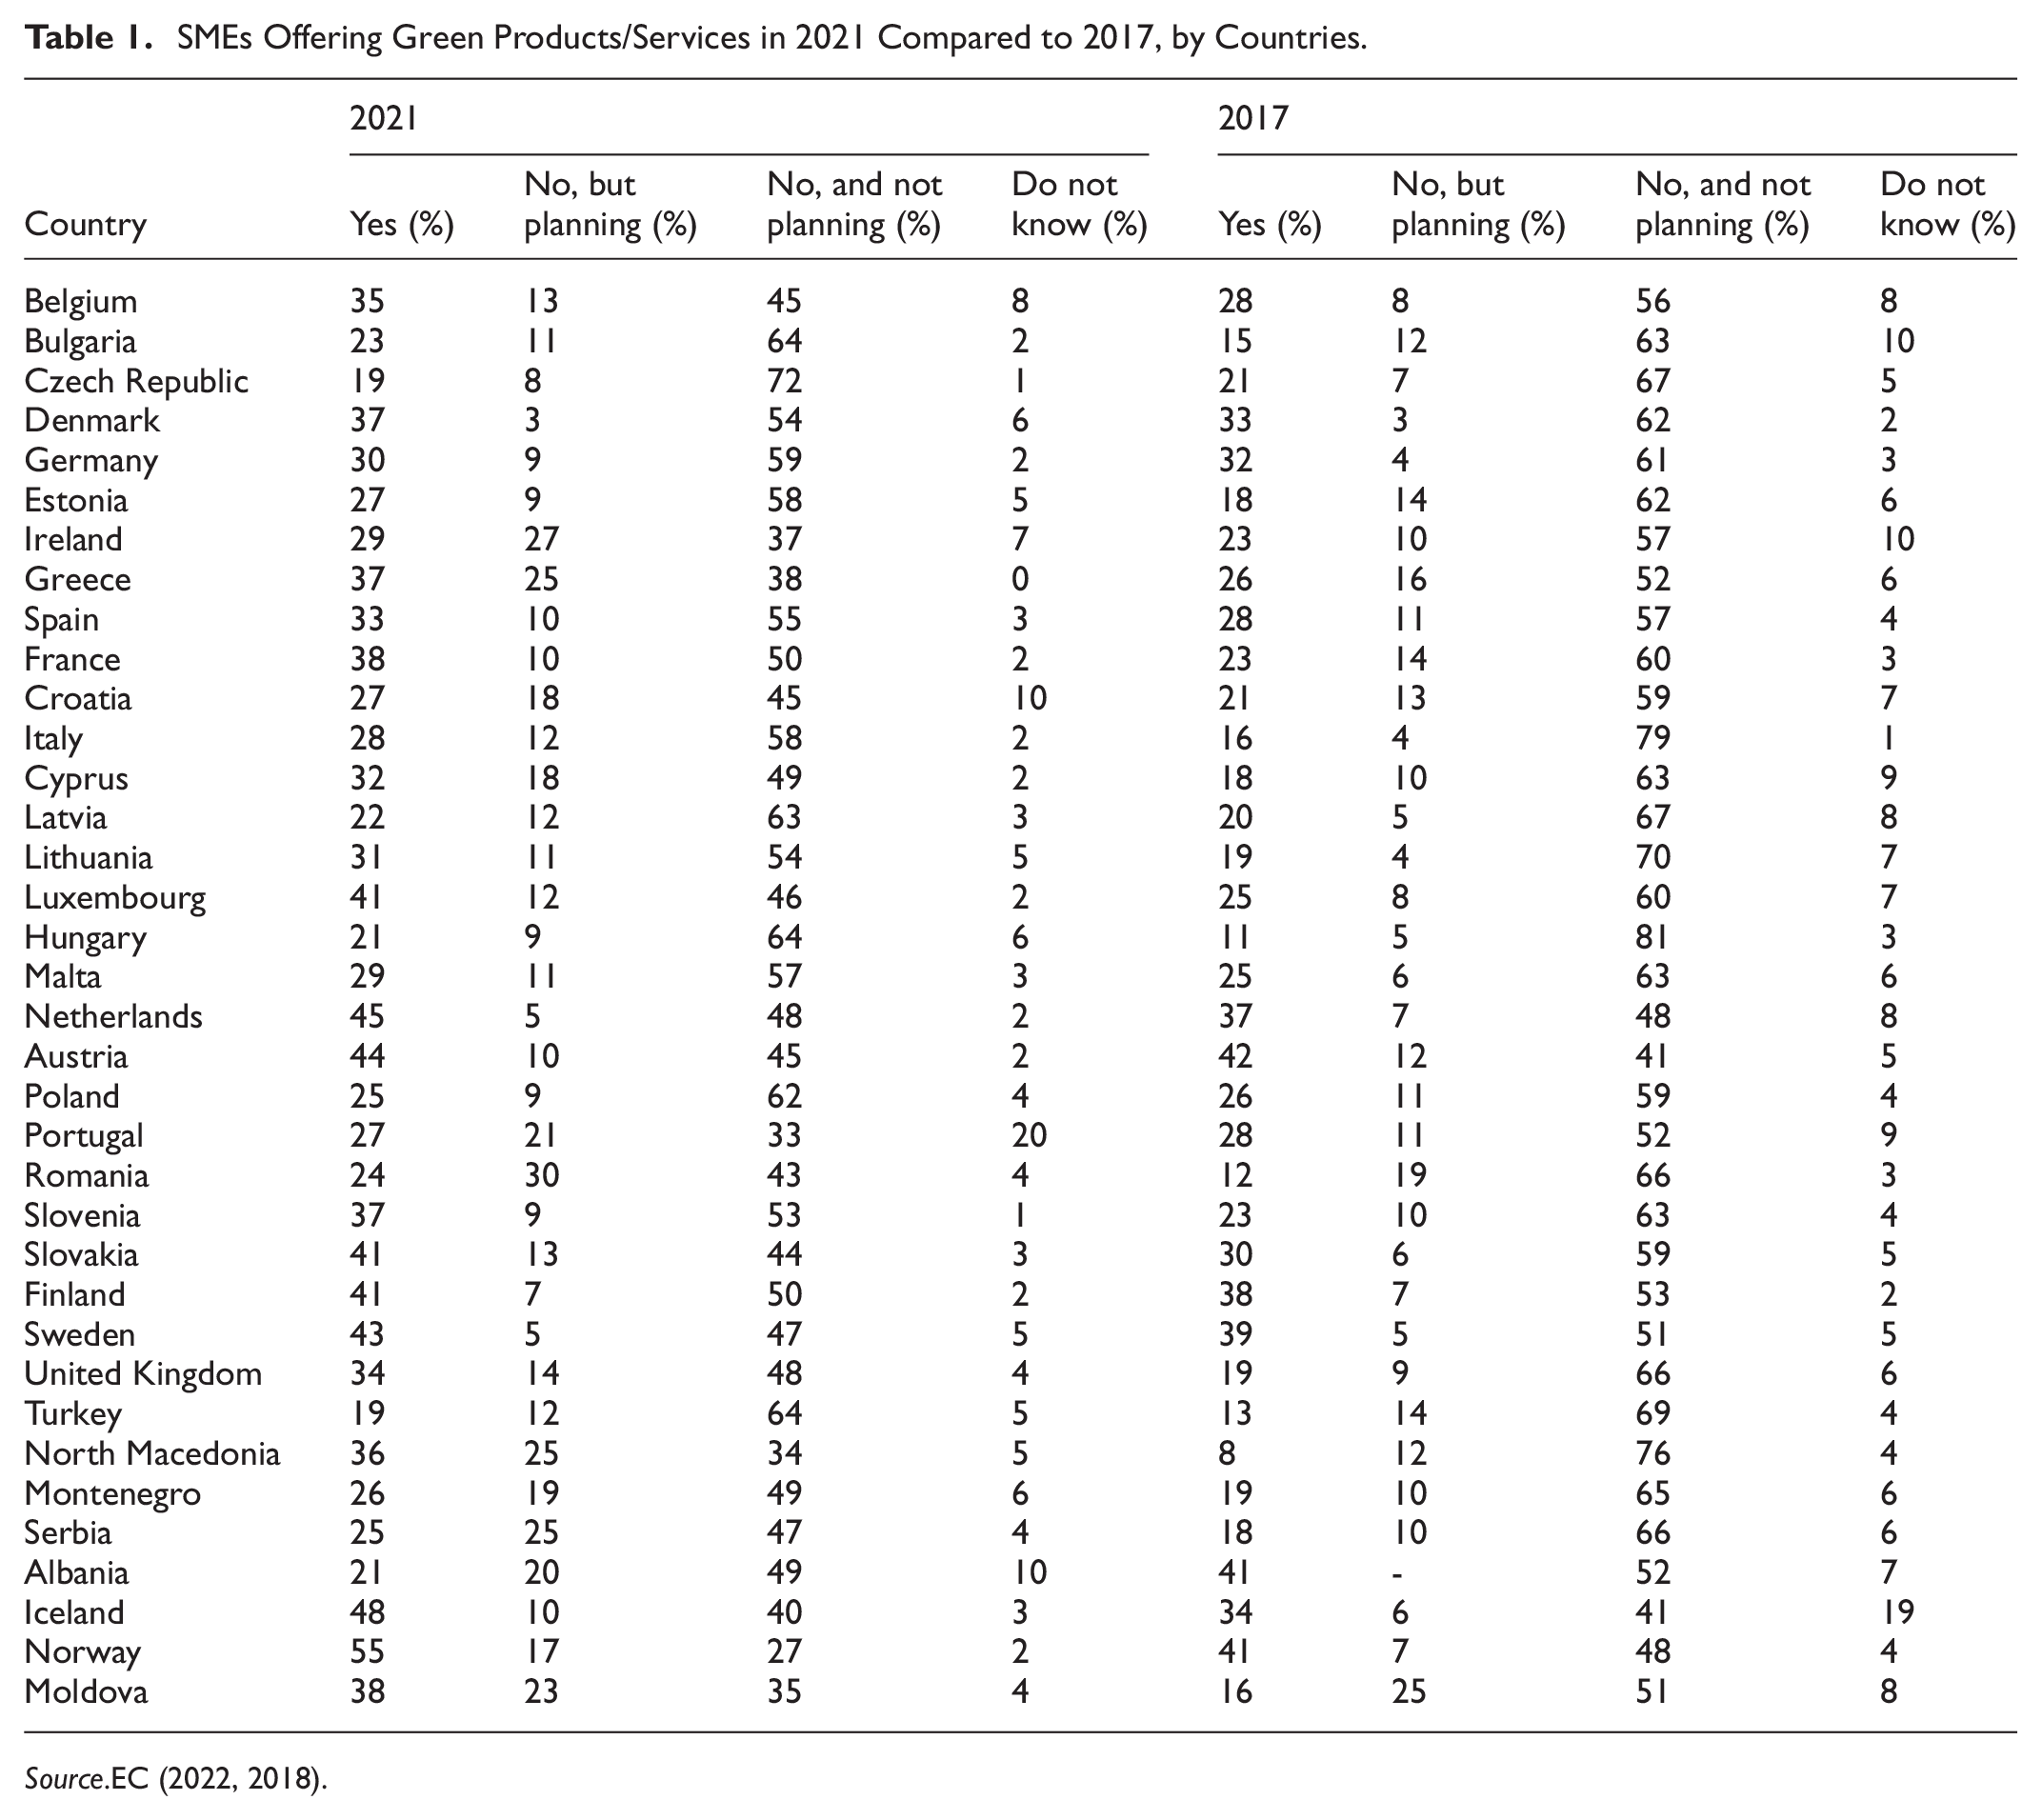
Although the positive trend is obvious, Table 1 shows that there are big differences in the number of SMEs offering green products by country in Europe. Also, there are significant differences in progress from 2017 to 2021 in offering green products/services. For example, SMEs in Norway (55%), Iceland (48%), Sweden (43%), Austria (44%), and the Netherlands (45%) are the most likely to have green products/services in their offer. At the same time, the same countries, except Austria, had great progress in the number of SMEs offering green products compared to 2017. On the other hand, the proportion of SMEs offering green products/services is the smallest in Turkey and the Czech Republic (19%), Albania and Hungary (21%). A lot of SMEs in Romania (30%), Greece, and North Macedonia (25%) are not currently offering green products or services but are planning to do so in the next 2 years.
Sample Characteristics
The data used in this study come from the Flash Eurobarometer 498 (SMEs, green markets, and resource efficiency). Characteristics of the sample comprising 12,657 SMEs operating across the 34 European countries are presented in Table 2.
Characteristics of the SMEs in the Sample.
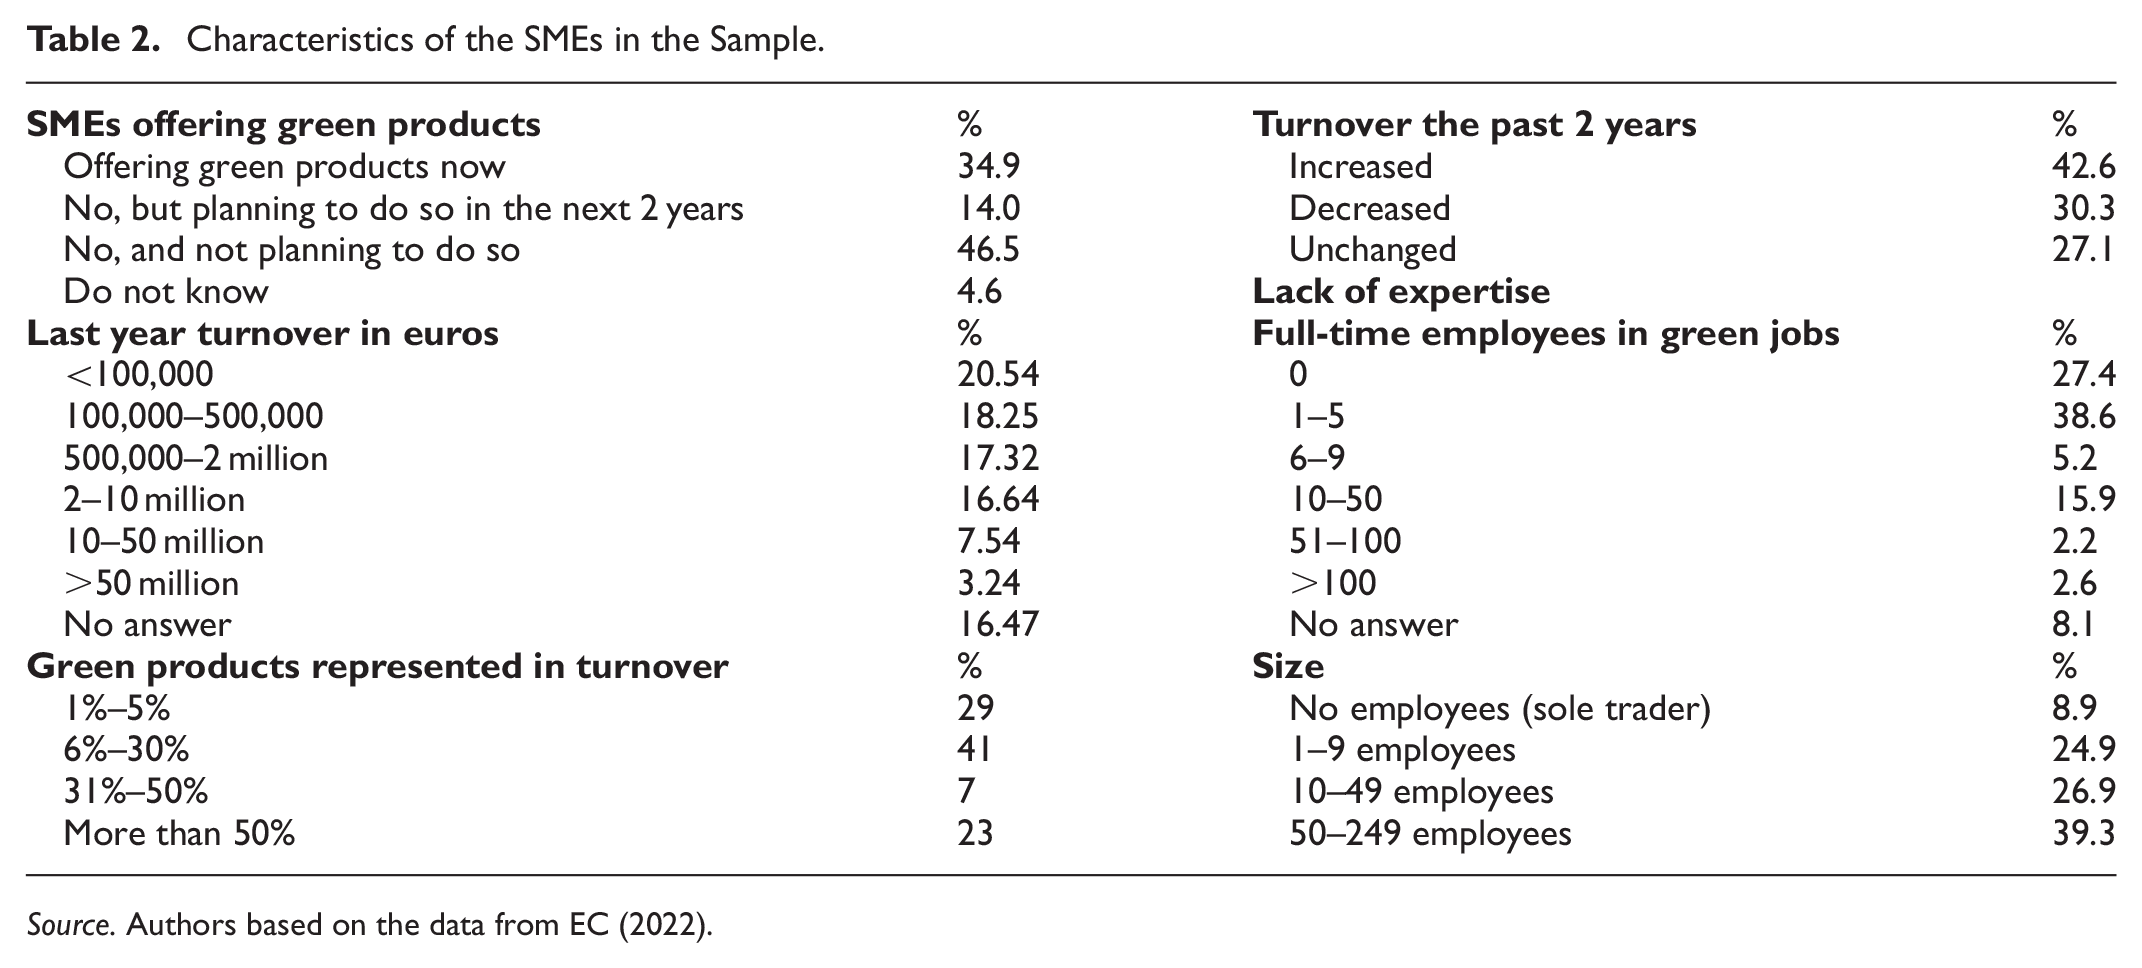
Source. Authors based on the data from EC (2022).
Table 2 shows that 34.9% of SMEs are offering green products/services currently, while 65.1% do not do it. Just over half (51%) offer products or services with environmental features, such as eco-labeling, or organic production. More than one-third (35%) offer recycled material, while 19% offer solid waste management and 17% offer products or services in the area of renewable energy. Almost one quarter sell food and beverages (24%), while 22% sell electronic and mechanical machinery and equipment. One-fifth of SMEs offer furniture, wood and paper products (20%) while 9% offer textiles, wearing apparel and leather products. SMEs are most likely to be offering green products or services due to customer demand (50%). One-third offer them as a result of the company’s core values (33%), while 31% do so because of the company’s image. One quarter offers green products or services to create a competitive advantage or business opportunity, whilst 23% do so to comply with national, regional, or local laws. At least 1 in 10 (14%) are trying to catch up with their main competitors, 5% mention tax incentives, and 4% mention subsidies or public support. About a third (27.4%) of SMEs do not employ workers in green jobs and 38.6% employ 1 to 5 workers in green jobs. These evidences refer to the entire sample of SMEs.
Seven out of 10 SMEs in the sample are very small with between one and nine employees and with last year’s turnover of less than 2 million EUR (72.75%). For the largest share (43%) of SMEs selling green products and services, these products and services make up not more than 10% of their annual turnover. About one in five (21%) reply that green products and services represent between 11% and 50% of their annual turnover and a slightly higher proportion (23%) answer that the sale of such products and services makes up more than 50% of their turnover. Turnover increased in the past 2 years in 40.6% of SMEs. SMEs whose turnover has decreased in the past 2 years are more likely to say up to 5% of turnover came from green products or services, compared to those whose turnover has increased (37%) or remained the same (36%). SMEs whose turnover has increased are more likely than those whose turnover has decreased had more than 50% of turnover from green products or services.
Among SMEs offering green products and services 62% rely on their own financial resources and 56% on their own technical expertise for the production of these products and services. About a quarter (24%) of these SMEs rely on external support. In some countries, such as Norway (43%) and Austria (42%) a lot of SMEs rely on external support. On the other hand, in countries such as the Czech Republic, Estonia, Croatia, Lithuania, Romania, Poland, Slovenia, and Montenegro the majority of SMEs are driven by their own financial resources and technical expertise (more than 50%), while external support is less than 20%. These results present no significant change compared to 2017 as can be seen in Table 3.
Types of Support for the Introduction of Green Products/Services in SMEs in Europe 2021/2017.

One of five SMEs relying on external support for the production of green products or services say they receive public funding, such as grants, guarantees, or loans (+8 pp compared to 2017). Another one in five of these SMEs receive private funding from a bank, investment company, or venture capital fund, and just about 8% receive private funding from friends and relatives. The largest share (35%) of SMEs relying on external support for the production of green products or services receive advice or other non-financial assistance from supply chain partners, followed by 23% mentioning this type of support from business associations and clusters, and 21% from private consulting and audit companies. Just over 1 in 10 (13%) of SMEs receive advice or other non-financial assistance from public administration.
This research includes only SMEs that offer green products/services where green products or services represent more than 50% of annual turnover (all SMEs that offer green products and services were initially included in the analysis). However, the obtained results showed that none of the drivers has a significant impact on the increase in chosen SMEs turnover. We assumed that the cause of the poor research results is a large number of SMEs that have a small share of the sale of green products in total turnover. That is why we excluded all SMEs whose turnover from the sale of green products is less than 50%). It is in total 1,221 SMEs (number of observations).
Research Model and Variables
To help SME managers and economic policy makers develop effective strategies and policies related to green products it is necessary to predict the possible influence of green products and their drivers on the business performance of SMEs. We chose Latent class (LC) analysis to succeed in this (Latent class analysis provides models that consider explicitly the effect of one or more latent variables when studying relationships between observed variables, and accounts for the categorical nature of these variables (Vermunt, 2003). Bearing in mind the fact that our sample includes a large number of countries with a large number of SMEs multilevel latent class modeling was chosen. Multilevel latent class modeling is an approach based on the assumption that some model parameters can vary across groups, clusters, or level-2 units (Bassi, 2017). To verify defined hypotheses, the multilevel logit regression model was applied. Multilevel logistic regression models ensure that when estimating the effect of subject and cluster characteristics on the dependent variable, the clustering of subjects within clusters of higher-level units is taken into account. In this specific case, the higher-level units are the countries included in the analysis, and the subjects are companies from those countries (Snijders & Bosker, 2012).
We attempt to predict the impact of three groups of drivers on the increase in turnover in SMEs offering green products. The average increase in annual turnover of SMEs over a 2-year period (dependent variable) is explained by drivers of green product introduction and various control variables. As independent variables, we used three forms of support (SMEs own financial resources, SMEs own technical expertise, and external support) identified in Flash Eurobarometer 498, as a type of support for the production of green products and services. The sample includes only SMEs that offer green products/services where green products or services represent more than 50% in annual turnover. The model control variables are: the date of birth of the SME, the size of the SME measured by the number of employees, last year’s turnover in euros, and full-time employees in green jobs. All data are taken from the database Flash Eurobarometer 498.
Bearing in mind the fact that all variables have significantly different distributions across Europe, they are grouped into clusters based on the level of development of the green economy in the SME sector measured by the following indicators: (a) SMEs offering green products, (b) green products or services represented in SMEs annual turnover of the latest fiscal year, and (c) full-time employment in green jobs. To perform hierarchical cluster analysis, based on selected indicators, IBM SPSS Statistics Version 22 has been used.
The first cluster includes six countries. The level of development of the green economy in SMEs in the first cluster is the lowest. The second cluster includes 10 countries, the level of development of the green economy in SMEs in this cluster is slightly higher compared to the first cluster. The third cluster includes 11 countries, the level of development of the green economy in SMEs in this cluster is significantly higher compared to the first and second clusters. The fourth cluster includes nine countries where the level of development of the green economy in SMEs is the highest. Analyzed countries by cluster, and their geographical location, are shown on the map in Figure 1.

Analyzed countries by clusters and their geographical location.
Clusters and their characteristics are shown in Table 4.
Cluster profiles for undertaken actions.
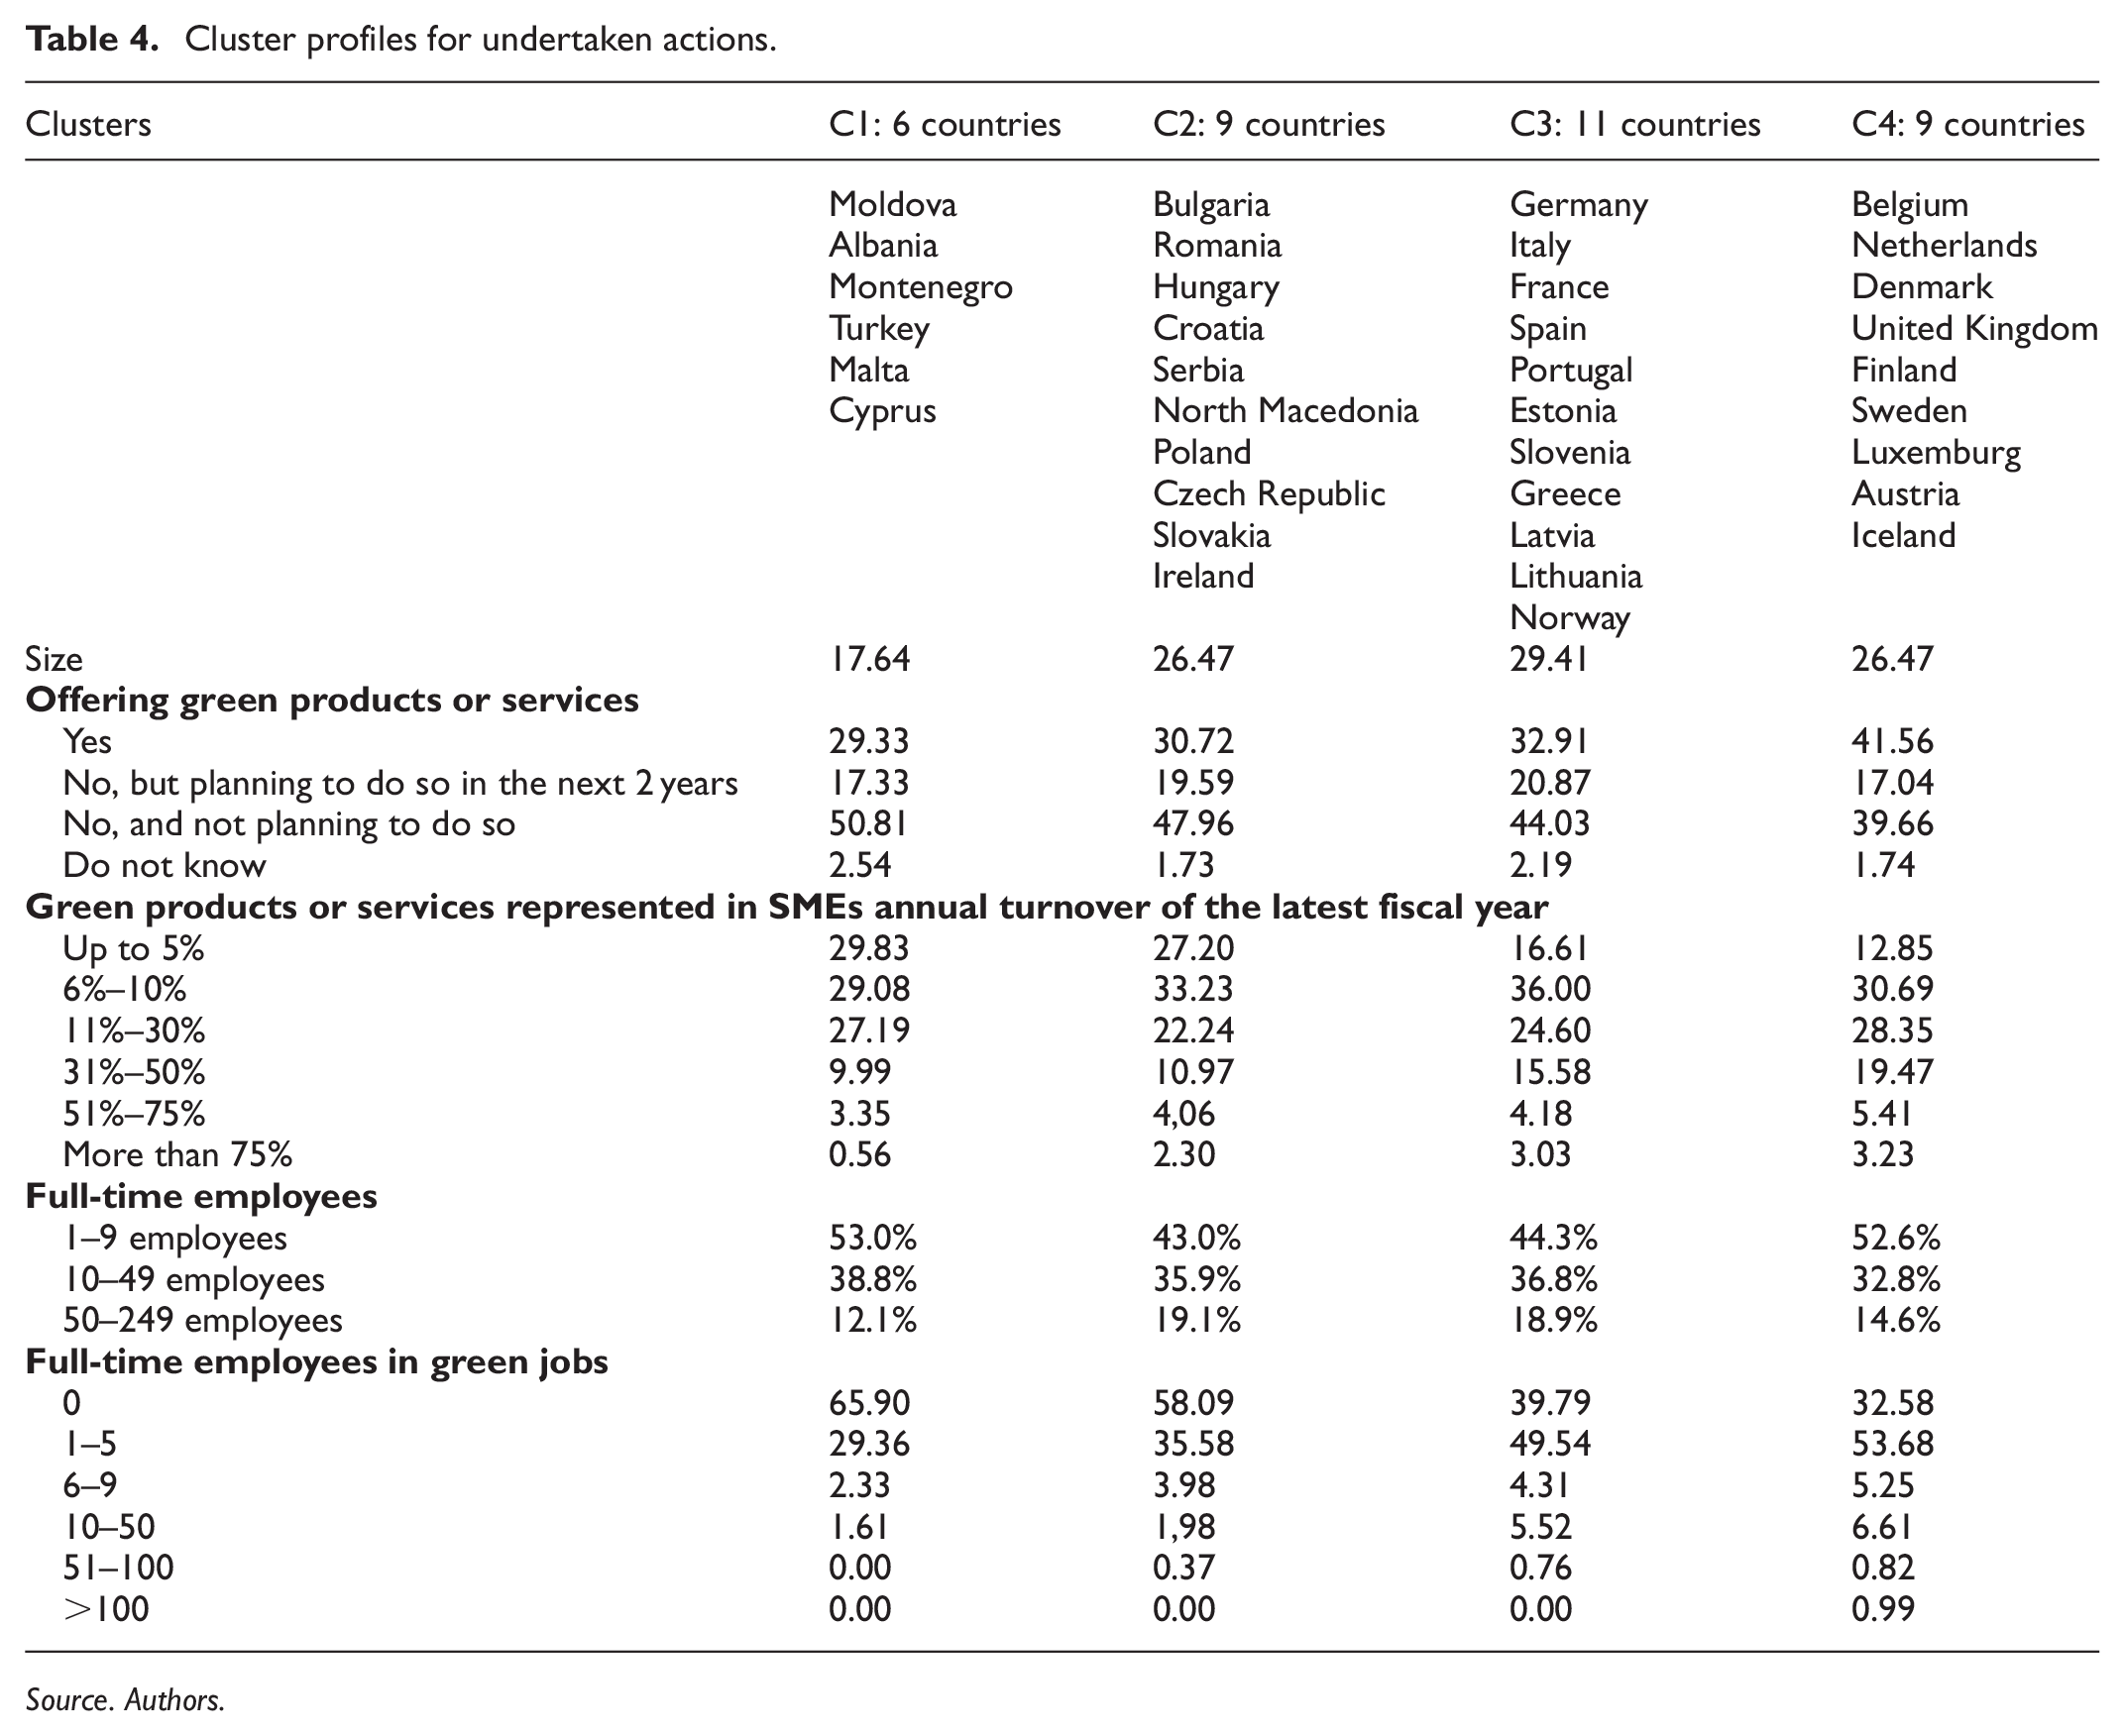
Source. Authors.
Results and Discussion
Results
The multilevel logit regression model was applied to assess the probability of the possible impact of each form of support on the increase in the turnover of SMEs offering green products in the future, by clusters. Collinearity diagnostics have been performed through variation inflation factor by running regression analysis with the same list of predictors (own financial resources, own technical expertise and external support) and dependent variable as they used in logistic regression. The value of this indicator for all independent variables is close to 1 (Table 5). Given that in logistic regression only values of variance inflation factors above 2.5 may be a cause for concern (Midi et al., 2013), this assumption of the selected models is fulfilled.
Collinearity Statistics.

Since the level of development of green economy is much higher in cluster 4 compared to other clusters, a dummy (dummy4) is included to examine whether there are differences between cluster 4 and other clusters. The cluster 4 is selected as a reference value. The variable Dummy 4 is a dichotomous variable where the value 1 indicates belonging to the fourth cluster (the company originates from the country i.e., classified in the fourth Cluster), and 0 refers to all other companies. Therefore, regression analysis by clusters with a dummy4 is applied. The results of the conducted regression analysis are presented in Table 6.
Regression Results by Clusters.
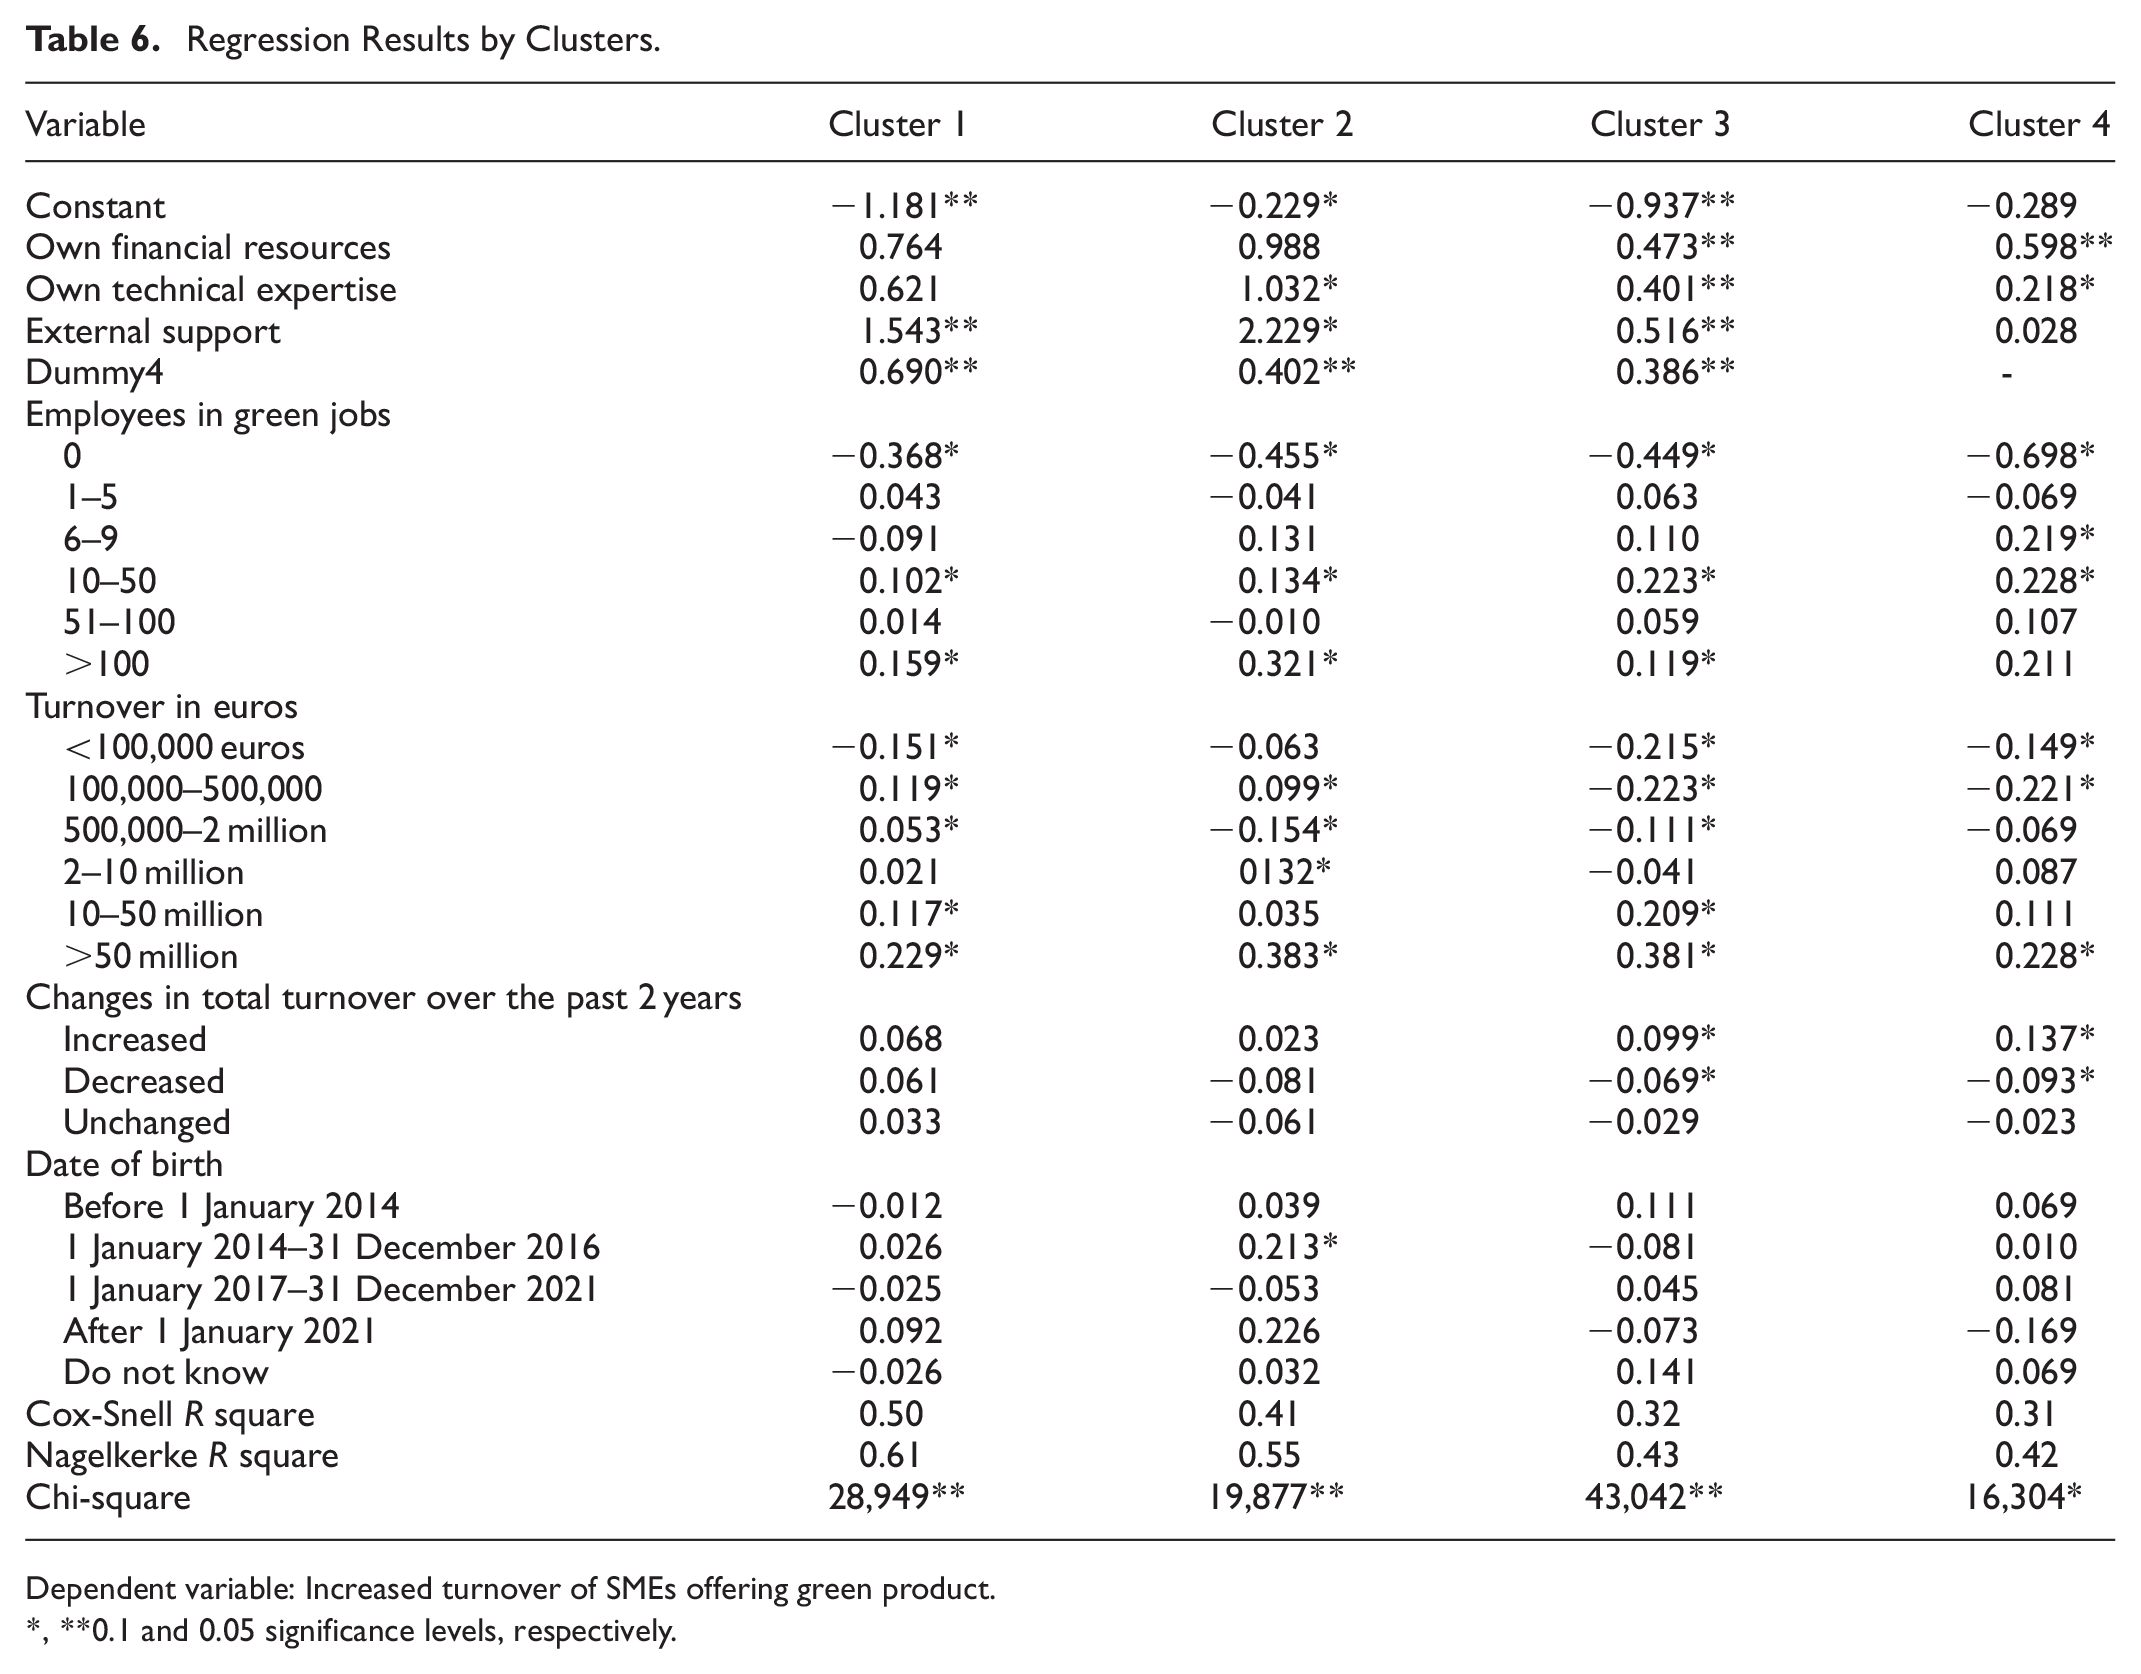
Dependent variable: Increased turnover of SMEs offering green product.
, **0.1 and 0.05 significance levels, respectively.
In the first cluster, there is the highest statistically significant probability (at a 5% level of significance) that external support will lead to an increase in the number of SMEs offering green products and their turnover (1.543). The probability of the influence of SMEs own financial resources and SMEs own technical expertise is statistically insignificant. The situation is similar in the second cluster. There is the highest statistically significant probability (at 10% level of significance) that external support will lead to an increase in the number of SMEs offering green products in Europe and their turnover (2.229), while the probability of the influence of SMEs own financial resources is the smallest and statistically insignificant. The specificity of this cluster, in comparison to the first cluster, is a statistically significant probability (at a 10% level of significance) that SMEs own technical expertise will lead to an increase in SMEs turnover (1.032). For cluster 3 probability that all three forms of support will lead to an increase in the number SMEs offering green products in Europe and their turnover, is statistically significant at the 5% level. The greatest impact can be expected from external support (0.516). The contribution of SMEs own financial resources is slightly lower (0.473), while the probability of the influence of own technical expertise (0.401) is the smallest. The situation is completely different in cluster 4. There is the highest probability that own financial resources will lead to an increase in the number of SMEs offering green products in Europe and their turnover (0.598), which is statistically significant at the 5% level. The probability of the influence of own technical expertise is lower (0.218) and statistically significant at the 10% level. While probability of the influence of external support is the smallest and statistically insignificant.
The results show that the age of SMEs has no influence on the growth of turnover in SMEs that offer green products in any cluster. Another interesting result that is common to all clusters is that the lack of employees in green jobs (0) negatively affects the growth of the turnover of SMEs that offer green products, while the presence of more than 10 employees in green jobs has a statistically significant positive impact in all clusters. Annual turnover greater than 50 million euros has a positive effect, while turnover less than 500,000 euros has a negative effect. The change in turnover has a significant impact on the turnover of SMEs that offer green products only in the third and fourth clusters.
To check whether there are significant differences between the clusters, a dummy variable was introduced. The fourth cluster is chosen as the reference category (dummy4) because it includes the largest number of SMEs offering green products. The log odd for Dummy4 in first cluster is 0.69. Converted log odd into “regular” odd equals 1.993. This means that the probability of turnover growth in the fourth cluster is 1.993 times greater than the probability in the first cluster. According to the equation, the probability that there will be an increase in turnover in the companies belonging to the fourth cluster is 0.661, while the probability for companies from the first cluster is 0.332. This difference is statistically significant at the 5% level. The difference in the probability of turnover growth between cluster 2 and cluster 4 is also statistically significant at the 5% level. Converted odd for dummy4 (0.402) is 1.496. It means that the probability of turnover growth in the SMSs in the fourth cluster is 1.496 times that of the companies in the second cluster. Finally, the difference in the probability of turnover growth between cluster 3 and cluster 4 is also statistically significant at the 5% level. The converted odd for dummy4 (0.386) is 1.470. It means that the probability of turnover growth in SMEs in the fourth cluster is 1.47 times higher than in companies in the third cluster.
The model fit test is used to examine the causality of the dependent variable by the independent. In logistic regression, there is no true R2 value as there is in OLS regression. Several pseudo-R2 values have been proposed using this general logic, including the Cox and Snell, Nagelkerke, McFadden, and Tjur indexes, among others (see Allison, 2014, for a review).
The Cox and Snell R Square coefficients can be interpreted the same as the coefficient of determination (R2) in ordinary multiple linear regression (Sugiyono, 2018). Table 4 shows that the first model explains 50% changes in increased turnover of SMEs offering green products/services, while it is slightly smaller in the second model – 41%, in the third – 32%, and in the fourth – 31%. The modification of Cox and Snell square is Nagelkerke R Square to ensure the value varies from 0 (zero) to 1 (one). Table 6 shows the results of Nagelkerke R Square, which is 0.61 for the first model, 0.55 for the second, 0.43 for the third, and 0.42 for the last cluster. These values mean that the independent variable can explain the variability of the dependent variable by 61% for C1, 55% for C2, 43% for C3, and 42% for C4, while the rest is explained by other variables not included in the model.
To test the differences between models F statistics is used mainly. In logistic regression, we use an incremental chi-square statistic instead of an incremental F statistic (more commonly, you see phrases like chi-square contrasts). The difference between the deviances of constrained and unconstrained models has a chi-square distribution with degrees of freedom equal to the number of constraints.
Discussion and Recommendations
With the increasing concerns over climate change and environmental consequences of the operations of businesses, coupled with the pressure from the government and market toward sustainable development and green economy, the contribution of SMEs to green transformation has garnered tremendous interest from scholars and practitioners over the last two decades. The latest meta-analyses and bibliometric research (Maesaroh et al., 2024; Oduro, 2024) show that the biggest gaps in the literature are related to green entrepreneurship, including the introduction of green products/services in SMEs (as a form of corporate entrepreneurship). We have focused on the introduction of green products in SMEs (barriers/drivers and related performance effects) in this paper, to fill a gap in the literature. We were driven by the intention to create a clear picture for SMEs managers related to the impact of green products on SMEs turnover. Finally, we tried to identify key drivers of green products introduction and predict their impact on SME’s turnover in the future, to make it easier for economic policymakers to decide what measures should be implemented to increase the involvement of SMEs in the green economy.
We identified three groups of drivers (SMEs green technical expertise, SMEs own financial resources and external support) and investigated their possible contribution to the increase in the turnover of SMEs. The analysis of the data from Flash Eurobarometer 498 (SMEs, green markets and resource efficiency) on a sample of 34 countries (EU + Western Balkan) and 1,221 SMEs shows that there is the highest probability that external support, SMEs green technical expertise, and SMEs own financial resources will lead to an increase in turnover of SMEs offering green products in Europe, but its impact depends on the development of the green economy of the country from which the SMEs originates.
We also found statistically significant differences in the level of development of green economy in certain countries in Europe and for this reason, we grouped them into four clusters (based on: the number of SMEs offering green products, participation of green products or services in SMEs annual turnover of the latest fiscal year, and full-time employees in green jobs).
The first cluster includes the six countries (Moldova, Albania, Montenegro, Turkey, Malta, Cyprus) with the lowest level of development of the green economy in SMEs (the lowest number of SMEs offering green products, the lowest participation of green products or services in of annual turnover and lowest number of full-time employees in green jobs). The results of logit regression show that there is the highest statistically significant probability (at a 5% level of significance) that external support will lead to an increase in the number of SMEs offering green products in Europe and their turnover. The probability of the influence of own financial resources and own technical expertise is statistically insignificant.
To encourage SMEs in countries in this cluster to introduce green products/services, various support structures may be needed. Governmental support could be very useful. Assistance via favored tax incentives, as well as programs that provide financial and advisory assistance, were also noted as key types of support (Abdesselam et al., 2024). To design suitable green policy and to organize the provision of direct support for the development of green products, it could be desirable to offer public external funds and simplify access to regional and national funding. In addition, measures such as assistance with identifying potential investors, technical support, and consultancy services could be very useful.
Another important result for the policy is the improvement of environmental regulation. Government regulations force companies to follow rules, thereby changing their business model toward a green economy. In that direction, the creation of environmental regulations and their implementation can significantly encourage SMEs to introduce green products.
The second cluster includes 10 countries (Bulgaria, Romania, Hungary, Croatia, Serbia, North Macedonia, Poland, Czech Republic, Slovakia, Ireland) with higher levels of development of the green economy in SMEs compared to the first cluster (number of SMEs offering green products is slightly higher compared to the first cluster, but turnover earned by green products and number of full-time employees in green jobs, are significantly higher compared to the first cluster). The results of logit regression show that there is a statistically significant probability that external support and own technical expertise will lead to an increase in the number of SMEs offering green products in Europe and their turnover. To encourage SMEs in countries in this cluster to introduce green products/services, various governmental support structures may be needed, as well as strategies for managers. In addition to the measures listed for Cluster 1, state governmental agencies can foster the implementation of green business practices by providing additional information and raising awareness about these practices. Such an educational strategy may be useful in diminishing misconceptions that green practices are complex, costly, and overly burdensome.
Also, SMEs can form partnerships and collaborate with other companies, universities, and organizations to share knowledge and experience in introducing green products/services. It could be very useful to improve SMEs knowledge, which is developed through networking with business actors, and with research centers and universities. Also, it would seem appropriate to encourage co-entrepreneurship, in particular by setting up associations and private and public support structures that will be able to match up SMEs and entrepreneurs, or by creating networking platforms to enable sharing experience in the development and commercialization of green products. Facilitating the transfer of good practice, but necessarily accompanied by capital infusion, could be an integrated mechanism for stimulating green product introduction in less developed green economy countries.
Cluster 3 includes the 11 countries (Germany, Italy, France, Spain, Portugal, Estonia, Slovenia, Greece, Latvia, Lithuania, Norway). The level of development of the green economy in SMEs in this cluster is significantly higher compared to the first and second clusters (including the number of SMEs offering green products, SMEs green products or services participation in turnover, and number of full-time employees in green jobs). The results of logit regression show that there is a statistically significant probability that all 3 forms of support will lead to an increase in the number of SMEs offering green products in Europe and their turnover. All the aforementioned measures can be useful for increasing the participation of SMEs in the green economy in these countries as well.
Cluster 4 includes the nine countries (Belgium, Netherlands, Denmark, United Kingdom, Finland, Sweden, Luxemburg, Austria, Iceland) where the level of development of the green economy in SMEs is the highest (there are a great number of SMEs offering green products, participation of green products or services in annual turnover is significantly higher compared to the first and second cluster and there are SMEs which have 100 and more full-time employees in green jobs (it is not case in any of previous clusters). It means that the number of entrepreneurs and managers of SMEs with ecological awareness is high. The results of logit regression show that there is a statistically significant probability that SMEs own financial resources and SMEs own technical expertise will lead to an increase in the number of SMEs offering green products and their turnover, while the probability of the influence of external support is statistically insignificant.
The insignificant influence of external support points to the fact that the environment is already sufficiently stimulating so that entrepreneurs and managers of SMEs with ecological awareness play a key role in increasing the participation of SMEs in the green economy. It is desirable to encourage entrepreneurs and managers of SMEs with ecological awareness to continue developing green products, especially green products based on innovation.
Also, our results show that the introduction of green products/services could increase the turnover of SMEs. For managers of SMEs, the following strategies may be useful. For SMEs at the beginning stage, it may be easier to start with lower-cost strategies, such as using recycling materials to produce green products or for packaging traditional products. These types of strategies are more easily implementable, with benefits that are more readily realizable, and these practices have been found to directly contribute to a company’s financial profits (Broccardo & Zicari, 2020; Topleva & Prokopov, 2020). For more advanced SMEs that have already implemented some level of green business practices, more progressive (and costly) actions, such as the design and production of new green products (implement green innovation) by recycling waste or reusing old, unusable products. SMEs may want to further pursue formal green certification. This certification can have several benefits, such as an increase in product demand and popularity from consumers (Tseng et al., 2018), as well as an increase in turnover.
A very interesting finding of our research is related to the number of employees in green jobs. Our result shows that in all countries lack of employees in green jobs negatively affects the growth of the turnover of SMEs that offer green products, while the presence of more than 10 employees in green jobs has a statistically significant positive impact in all clusters. Accordingly, we can suggest to SME managers to introduce green jobs and employ people who possess green knowledge and skills.
Our starting hypotheses that external support, SMEs green technical expertise, and SMEs own financial resources will lead to an increase in turnover of green products/services brought to the market by SMEs in Europe is confirmed in general. It is in accordance with the previous research (Abdesselam et al., 2024; Bassi & Guidolin, 2021; Fernández et al., 2021; Kirchherr et al., 2017) and reports of Flash Eurobarometer (EC, 2018, 2022), as well as with our expectations. However, this assumption was confirmed only in countries with a moderately high level of green economy development in Europe (cluster 3 in our case). However, external support does not have a significant impact on the turnover of SMEs that offer green products in countries with an extremely high level of development of the green economy. It is in line with the research conducted by (Cecere et al., 2020). They explained that the effectiveness of subsidies (and tax incentives) depends on the size of the funding gap. If the gap is bigger, more support is needed. The high level of development of the green economy implies small gaps, so the support does not have a significant impact.
There are also specific patterns in groups of countries with the lowest level of development of the green economy. Own financial resources of SMEs are statistically insignificant for the increase in turnover for them. This is contrary to the results of most previous research, which prove that own financial resources are a significant driver of turnover of SMEs offering green products (Maldonado-Guzmán & Pinzón-Castro, 2022; Scarpellini et al., 2018). This can be explained by the fact that in these countries there is not a strong enough pressure from the state and consumers, related to the development of green products. For these reasons, SME owners invest their available financial resources in other areas and only think about green products if they receive some incentives from the state or support from business partners.
When it comes to the own technical expertise, their influence is not statistically significant for the increase in turnover of SMEs only in countries with the lowest level of development of the green economy, while with the increase in the level of development of the green economy, their contribution to the turnover also increases. It can be explained by the lack of green knowledge and skills in SMEs from undeveloped countries. It is in line with the research conducted by Bassi and Guidolin (2021). They proved that the number of workers in green jobs is related to the development of the green economy. In countries with low level of development of green economy, the number of green workers is low, and the importance of green technical expertise is not a significant driver. It is in line with research conducted in developing countries by Fernández et al. (2021). They concluded that the most important drivers of eco-innovation, which have an impact on SMEs performance are the following: collaboration with partners, alliances and networks, the public support, while market factors and technical expertise are weakly significant. In contrast, in countries with high level of development of green economy, the number of green workers is high and the importance of green technical expertise becomes significant. It is in line with research conducted in developed countries (France and SAD), by Abdesselam et al. (2024) and Purwandani and Michaud (2021). They emphasize the importance of green knowledge, skills, and internal motivation (two main drivers for deciding to engage in such practices are internal motivations and the opportunity to obtain a better public image).
The originality of our paper is that we grouped all countries into 4 clusters, that are characterized by different levels of development of the green economy, and we formed a separate logit model for each of them. We gave different recommendations for the creators of economic policies and managers of SMEs in certain groups of countries, following the obtained results for each cluster.
Conclusion
This paper contributes to the literature on the relationship between the business performances of SMEs on the one hand and green products/services and their drivers on the other hand. At the same time, the paper has practical implications, because it helps managers of SMEs and macroeconomy policymakers to create a clearer picture of the contribution of green products/services to the turnover of SMEs as well as to recognize key drivers of the introduction of green products by SMEs.
First, based on the literature review and previous research targets, we have shown that the introduction of green products/services has a significant impact on the development of the green economy, but at the same time on the business performance of SMEs. We also identified the following drivers of SMEs for introducing green products/services, based on previous scientific research and report Flash Eurobarometer “SMEs, green markets and resource efficiency”: SMEs own financial resources, SMEs own green technical expertise and external support. We conduct empirical research to test our hypotheses. By applying logit regression, we examined how the aforementioned drivers can influence the increase in turnover of SMEs offering green products in Europe in the future. Bearing in mind the fact that the level of development of the green economy in the SME sector is significantly different distributions across Europe we grouped them into four clusters and applied logit regression, by clusters. We contributed to the literature on drivers of SMEs to introduce green products/services by focusing on the factors that have the biggest contribution to SMEs turnover.
Secondly, we created a clearer picture, related to drivers/constraints of SMEs to introduce green products/services and proposed measures to economic policymakers to support SMEs to introduce green products/services in the future. The results of our research showed that the contribution of individual drivers to the turnover of SMEs differs depending on the degree of development of the green economy. External support has a significant impact on the increase in turnover of SMEs offering green products only in countries where the level of development of the green economy among SMEs is the lowest. On the other hand in countries where the level of development of the green economy among SMEs is the highest own technical expertise and SMEs own financial resources have a significant impact on the increase in turnover of SMEs offering green products. For the countries in the middle (moderated level of development of green economy) it can be expected that all three groups of drivers will lead to an increase in turnover of SMEs offering green products. The greatest impact can be expected from external support, while the contribution of SMEs own financial resources and SMEs own technical expertise is lower.
Third, we have shown that the introduction of green products/services can have a positive impact on the business performance of SMEs. This created a clearer picture for SME managers. Also, our result shows that the number of employees in green jobs is directly connected to the turnover of SMEs in the green economy.
This study has some limitations, which nevertheless offer interesting directions for future research. First, the results are static, data from the Flash Eurobarometer Report, for only 1 year (2021), were used. The availability of longitudinal data would allow us to study the long-term evolution of relationships between drivers of SMEs introducing green products/services and turnover.
Second, our study focuses on the case of 36 European countries. A limitation in the analysis is the great heterogeneity of the analyzed countries. In addition, the limitation represents the way in which the independent variables in the model were measured. Quantifying the type of support on an interval scale would contribute, to a large extent, to increasing the representativeness of the obtained conclusions. Because of the possible differences in environmental policies between Europe, SAD, Asia, Africa, and Australia more evidence from various continents, and especially a multi-country analysis, would be interesting.
Third, in our sample, we observed only SMEs that offer green products/services where green products or services represent more than 50% of annual turnover. However, given the scarcity of studies on the funding of drivers of SMEs to introduce green products/services, a deeper investigation of the drivers/obstacles of SMEs that do not offer green products or green products or services represent less than 50% in annual turnover is desirable.
Fourth, this paper did not examine the influence of market factors (consumer pressure), which was identified in many previous studies as a significant driver of SMEs to introduce green products/services, because there was no data. In the future, research can be directed in that direction. Finally, important areas of future research include the influence of the mentioned and other drivers of the introduction of green products/services on other business performance, sustainable performance, examination of a sample of emerging markets, etc.
Footnotes
Acknowledgements
This paper is part of the research under the project HORIZON-WIDERA-2022-TALENTS-03-01, “Up-skilling researchers for sustainable entrepreneurship based on innovation process management”, supported by Horizon Europe (Agreement No. 101120390 — USE IPM).
Ethical Considerations
Not applicable.
Author Contributions/CRediT
Maja IvanovićĐukić: study conception and design, material preparation, analysis, and writing the original draft. Vesna Janković Milić: study conception and design, material preparation, methodology, analysis, and writing the original draft. Tamara Rađenović: study conception and design, material preparation, methodology, analysis, writing the original draft, writing review and editing. Marija Radosavljević: study conception and design, analysis, and writing the original draft. All authors read and approved the final manuscript.
Funding
The authors received no financial support for the research, authorship, and/or publication of this article.
Declaration of Conflicting Interests
The authors declared no potential conflicts of interest with respect to the research, authorship, and/or publication of this article.
Data Availability
The data that support the findings of this study are available from the corresponding author upon reasonable request.