
Abstract
Although micro companies overpower the small and medium enterprise (SME) segment, generalizations are often with medium size companies, and therefore, there are many unknowns, especially when it comes to its buying behavior. Conformist studies and industry practices assume SMEs to be “normative” or “conservative” buyers; however, this hypothesis is untested. This article aims to scrutinize the reality, and proposes a unified model that rejects pre-containerization in buying behavior typologies, as well as selectiveness in terms of audience type, whether it is corporate, SME, or consumer. While replacing researchers’ perceptions with the audience’s, the model yields actual knowledge that can lead to audience’s beliefs in lieu of the opposite, which is used to mislead stakeholders. The study shows that SMEs also buy like individuals and spend in a similar way to consumers’, including not only “normative” and “conservative” but also “negligent” and “impulse” zones. From the research-implications perspective, future studies by behaviorists can explore why SMEs purchase in this way. Marketers may benefit from the finding that SMEs buy like individuals. In addition, SMEs may want to be conscious of their purchasing habits, and—utilizing the newly introduced “risk score” frontier—policymakers should assess the consequences of these habits at the macro level.
Introduction
Small and medium enterprises (SMEs) have historically been the basis of economic activity, and micro companies dominate the SME segment. Micro companies are often characterized as facing resource limitations (Kaynak, Tatoglu, & Kula, 2005; Muñoz-Bullón & Sanchez-Bueno, 2011; Palmer, Ellinger, Allaway, & D’Souza, 2011; Viljamaa, 2011) and are studied in light of network-based heuristic management approaches (Ceci & Lubatti, 2012; Tatiana, Bojidar, & Ivan, 2007; Kautonena, Zolinb, Kuckertzc, & Viljamaad, 2010). When it comes to their buying behavior, conformist studies and industry practices assume SMEs to be “normative” or “conservative” buyers. However, absence of evidence is not evidence of absence; therefore, other possible (unknown) typologies may affect stakeholders that behave with this incomplete knowledge set. Behavioral researchers can suffer from moving further in the wrong direction and can lose the base of the study. Marketers can fail to acknowledge the SME segment in full, meaning that they cannot technically address its needs in a navigated way, and this can cost them money. SMEs themselves can be unaware of their buying practices and therefore fail to question their approach, which can jeopardize their business. Although understanding customer potential is considered a compelling priority among many sectors, we have a limited body of knowledge in this regard.
The majority of literature in marketing, as well as its derivatives, including technology, analyzes two categories of customer buying behavior: business customers and individual customers. Moreover, business-to-business marketers focus only on big corporate customers, not SMEs. In fact, they act as though SMEs are not part of the business world. In light of this, if SMEs are not part of business-to-business marketing, nor part of business-to-consumer marketing, where do they fit in? In other words, who covers them as customers? Although Wilson (2000) attempted to summarize the possibly misleading distinctions behind preceding models, the empirical application side is still premature.
Research Aim
The aim of the present study is to develop a buying-behavior framework for SMEs in Turkey that suggests timeline actions for SMEs themselves, as well as behavior researchers, marketers, and policymakers.
Research Objectives
The study’s research objectives can be summarized as follows:
Examine the current factors affecting buying behavior.
Assess the current buying-behavior models and their associated attributes.
Establish a contextualized buying-behavior framework for SMEs in Turkey.
Develop a final buying-behavior framework that includes a strategy map for SMEs in Turkey.
Factors Affecting Buying Behavior
The vast majority of literature reviews, regardless of the type of study, attempt to assess SMEs according to either limitation or adoption domains. The former mostly view SMEs as entities that lack resources and procedures, are informal, and have poor management, whereas the latter mostly view SMEs as having unsuccessful strategy- and systems-adoption processes (Arend & Wisner, 2005; Gilmore & Grant, 2001). It is fair to state that this approach is also used when considering their buying behavior; this categorical perspective creates its own limitation and adds extra barriers that lead to more questions rather than answers (Ellegaard, 2009; Park, Kim, & Forney, 2006; Supyuenyong, Islam, & Kulkarni, 2009). Another common pitfall relates to using the term “SME” while limiting the research to only medium-sized companies (Kendall, Tung, Chua, Ng, & Tan, 2001). In the end, unlike small companies, medium-sized companies do not dominate SMEs, and the results cannot be generalized on behalf of SMEs. Statistically speaking, the opposite might be correct; however, there has been no significant attempt to validate this possibility.
As shown in Table 1, research that has questioned the dichotomy in buying behavior and highlighted the irrelevancies of certain factors (Items 1, 5, 9, 10, 13, 14, 15, and 16 in Table 1) is relatively recent. This study aims to test the relevancy of certain factors; therefore, factors that have faced objections (those shown with a gray background) about their relevancies have been excluded from the study. These items have mostly been framed in terms of adoption, limitation, or pre-categorization of buyers, where business buyers are compartmentalized within the—nothing but—rational domains. Other factors have been commonly identified; however, they have not been applied to SMEs, and therefore, the findings are limited. In light of the literature review, the boundaries of buying behavior can be grouped under external (environmental) stimuli, internal stimuli (SME characteristics), the nature of need (needs assessment), and the buying moment (buying attitude), as well as carrier-model perspectives; a summary of these aspects is provided below (Ozmen, Oner, Khosrowshahi, & Underwood, 2013).
Formation of Buying-Behavior Boundaries.

Note. SME = small and medium enterprise.
External Stimuli
The literature review suggests that there is a correlation between politics and the economy in Turkey, and at least the latter should be part of the research design, with its changing conditions, such as crisis and non-crisis status (Onur, 2004). Technology attributes underline the infrastructural limitations of SMEs in Turkey, such as very limited email usage, which also limit the research techniques that can be used.
Internal Stimuli
SME characteristics were introduced through the cultural domain (Sandhusen, 2000), and corporate culture models and typologies have also been examined (Goffee & Jones, 1996, 2006; Miles & Snow, 1978; Turner & Trompenaars, 1998). An application study in Turkey indicated that even if an owner’s employees take action, the owner decides on all matters (making title less important), trust is more important than knowledge in any field (leading them to prefer to buy from known vendors), less value is given to procedures (no set procedural systems in procurement), less confident than they look like (makes them potentially leisure buyers for some products), and—within the same context—there is a fear of losing prestige or appearing weak (Toprak, 2007).
Needs Assessment
Several needs-driver and purchase-significance (How often do customers buy? Is the need rare or returning?) domains have been examined (Robinson, Faris, & Wind, 1967; Wilson, 2000), along with investment characteristics (what they buy; Rushton & Carson, 1989; Shostack, 1982).
Buying Attitude
Elements of the buying moment that have been reviewed (Kotler & Armstrong, 2006) include brand-level, payment-model preference, and sales-point preference, and response time.
Carrier Model
Through numerous articles, specific models have been discussed under corporate, individual, alternate, and unified domains; however, none of these has covered the topic of SME buying behavior. However, only one has embraced all audiences (including individual and corporate, or any segment between them), but there was no application (Wilson, 2000). Within this perspective, hypothesis testing is used within this study, which is also aligned with earlier findings.
Assessment of Buying Behavior Model
An extensive literature review (Ozmen et al., 2013) led to Wilson’s Cube (Figure 1; Wilson, 2000), according to which, if rationality is the signature of organizations, how can the best examples of rationality (even if they are informal), for example, how housewives shop, be explained? If we accept that intangibility as a needs driver is also a factor of organizational buying behavior, then it may be that the distinctions between consumer and organizational buying-behavior models will be less prominent than previously assumed.

Factors affecting buying behavior.
Based on the work of researchers such as Shaw, Giglierano, and Kallis (1989), Wilson fostered the idea that one cannot simply categorize buying behavior as rational–irrational or tangible–intangible; there are tones between these extremes. Pickton and Broderick (2001) stated people’s reasoning schemes do not change much, or radically, whether they are at home or work. In the end, a person carries certain values that are applied to both daily personal life and work life.
Values can be about anything: purchasing action, people/family management, listening skills, loyalty, perceptions, and so on (Hilton & Jones, 2010; Siemieniako, Rundle-Thiele, & Urban, 2010). Coviello and Brodie (2001) suggested that the organizational–consumer buying-behavior dichotomy is not relevant when describing and analyzing purchase decision making.
Wilson (2000) not only offered an integrated model for this but also promoted the model’s broad usage. Although his model was designed to apply to organizational buyer behavior, Wilson suggested that it could also be applied to the context of consumer purchasing.
Even the reverse should be so, as Wilson (2000, p. 793) pointed out, “If a unified model of purchase classifications could be developed, there seem no compelling reason to perpetuate an unnecessary distinction between organizational purchasing and consumer purchasing.”
Figure 2 illustrates the points above. The model helps to illustrate an extended understanding of the needs assessment and buying-attitude questions we asked concerning each product. 1 It is up to SMEs to translate the boxes as either high-tangibility-need–low-tangibility-product, or routine-procurement–moderate-tangibility-product. Any combination among axes is possible; SMEs therefore need to choose the best answer.
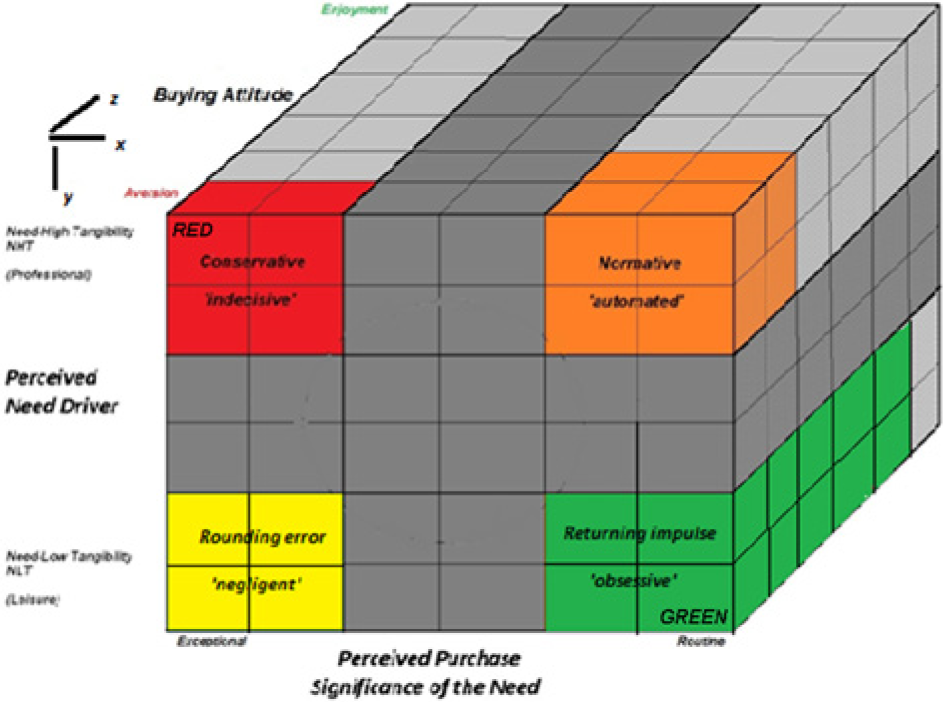
Cube.
In light of the SME segment, Wilson’s Cube can be summarized as follows:
Organizations buy within the low-tangibility needs driver (y-axis);
Higher purchase significance (x-axis) positively influences buyer attitude enjoyment (z-axis); and
Lower tangibility needs drivers (y-axis) positively influence buyer attitude enjoyment (z-axis; Wilson, 2000).
The cube has a positive correlation among x, y, and z axes; therefore, a combined hypothesis will be useful here:
Research Method
Research Philosophy and Approach
The research gap pointed out above relates to the lack of either a buying-behavior model for SMEs, or to its application in real-world scenarios. This also highlights possible gaps between corporate and individual buying models or frameworks. Ontology and epistemology discussions relating to the presence, knowledge, truth, and belief axes lead this study to the objective zone. In this manner, the problem lies in the positivist reasoning domain (Ozmen, Oner, & Khosrowshahi, 2012).
On the behaviorist side, the customer is the only actor with the ability to decide. In other words, the objectivity of behaviorists should rely on the subjectivity of the buyer. Behaviorists’ objectivity should be based on the subjectivity of the target audience (Sexton & Seneratne, 2004). In seeking new avenues for marketing to SMEs and understanding their buying behavior, SMEs’ beliefs play a crucial role. However, rather than creating new marketing hypotheses, the best-known buying-behavior models—although focused on a different audience here—are a starting point from which to probe SMEs. Therefore, this work hinges on hypothesis testing, rather than hypothesis building. From here, the quantitative results can enable some generalization that will validate itself, and therefore the subjectivity of the analysis will be reduced. Within the buying behavior context, SMEs are far from generalizable, because no research has been conducted to date on a subject/predicate basis. Considering specifics can be pertinent later; however, the qualitative base is likely to serve as a starting point for further research, which will focus on why, rather than what. Cova and Elliott (2008) assumed that both interpretivist and positivist approaches contribute to furthering consumer-behavior research; thus, these approaches can serve to bridge rich qualitative evidence—which is already available—and mainstream deductive research.
Despite the stance exchange between the two methodologies, because of the dominance of positivism and deductive reasoning in testing the hypotheses, besides the already-existing extensive qualitative basis, the research methodology can be seen as a better match for quantitative, rather than qualitative, approaches. Deshpande (1983) suggested that qualitative (looking for internal, causal reasons, and “how?”) and quantitative (looking for external facts and results, and “what?”) methodologies are not rivals; they both feed each other.
The literature review reveals significant qualitative research (Ellegaard, 2009); there is no lack of buying-behavior models. The focus of this study is on the quantitative application of a buying-behavior model to more thoroughly explore SMEs. However, all models except Wilson’s (2000) Cube are positioned in either the individual or corporate segment. Only Wilson’s model is not polarized, and is an attempt to unify different audiences.
Wilson’s (2000) Cube seeks to provide degrees of association among its axes. According to Morgan and Griego (1998), associational questions are tied with inferential statistics methods, which fall into the correlation analysis area. In terms of level of measurements, the criteria are either based on scores/ranks or counts. This relates to whether the data are interval-based or categorical (nominal), where the former better fits this study thanks to its Likert-type-scale structure. Morgan and Griego (1998) positioned this situation within the Pearson correlation matrix, where the pairwise exclusion (pwcorr) function of SPSS handles the calculations accordingly.
Questionnaire Design
The survey technique was selected, and a questionnaire with 100 questions was prepared.
The core of the survey was a product section, consisting of two Wilson and five Kotler questions asking about 12 products, including both tangibles and intangibles. Seven questions covered economic-crisis and non-economic-crisis environments based on perceptions. A 6-point Likert-type scale was used, consisting of a buying-attitude color-code index that ranged from red to green.
Needs assessment questions (Wilson, 2000) were as follows:
Is this a subject for routine procurement in the company? (Exceptional–Routine) [x-axis]
Is this a must for the company? (Professional–Leisure) [y-axis]
Buying-attitude questions (Kotler & Armstrong, 2006) [z-axis]:
Marcom tone noticed? (Rational–Emotional) [Adapted]
Brand preferred? (No name–Famous)
Financial model? (Low–High Liquidity)
Sales point? (High–Low Relationship)
Response time (Not sure–as soon as possible [ASAP])
The pre-product section of the survey included descriptive questions such as company size (number of employees) and industry sector. Although we targeted only three sectors, nine are possible based on KOSGEB’s (Küçük ve Orta Ölçekli İşletmeleri Geliştirme ve Destekleme İdaresi Başkanlığı [Government Initiation for SME Development in Turkey], the government body of SMEs in Turkey) definition for checking entry correctness. The pre-product section also included year of establishment, headquarter’s location, place of birth, position in the company, age bracket, education, current technology setup, and marital status. Purchase frequency was the transitional question for the product section. The post-product section only included the capture of email address and name/surname items.
Sampling
Sample size varies according to many factors; often, the type of data is a starting point (Bartlett, 1937). However, one group of researchers argued that Likert-based research should be treated as continuous data (Jamieson, 2004); another suggested that it can be considered as categorical data (Lubke & Muthen, 2004). Coshran’s sample size formula returns 83 and 264, respectively, for continuous and categorical data types, where the confidence level is 90% (alpha is 10%) and margins of error are 3% and 5% (Bartlett, 1937). According to these formulas, a population size larger than 10,000 is not a significant factor in terms of sample size determination. It is clear that there are millions of SMEs, and hundreds of thousands of these occupy certain subsets. Therefore, our total sample size of 270 is safe for generalizing SMEs—even under categorical data selection—with a 90% confidence level and 5% margin of error. Table 2 shows the distribution of the sample size. As a pilot, we conducted the part pertaining to manufacturing companies with 10 to 49 employees. We ran the analysis on the other cells using 270 surveys to see the big picture and enhance comparison possibilities.
Distribution of the Sample.

Note. SME = small and medium enterprise.
On-demand tools provide real-time monitoring and input controls when designing an online survey. In the present research, an agency conducted the field survey using its own database. Due to the unreliability of the postal service and low return rates resulting from cultural facts, post mail distribution was not a viable means by which to collect data. The survey was completed through face-to-face meetings.
The return rate for the pilot study was 100%, so return-rate contingencies were not planned for future phases. The return rate for the primary study was 96%.
Due to a lack of funds, we could not run the field survey in Istanbul as planned. Therefore, the majority of company headquarters included in the study were located in Eskisehir. Although this is a limitation, according to the Institute of Governmental Planning’s report, Eskisehir is very close to the capital city, Ankara, and ranks seventh in the development index and third in education; thus, it can be seen as having provided a representative sample of Turkish SMEs that is generalizable (Devlet Istatistik Enstitusu [Government Institute for Statistics]–Statistics Institute of Turkey, 2011).
Results
A negative correlation between Wilson’s 1 and 2 axes was found, as shown in Table 3. Supporting this, the figures show the breakdown for the number of respondents; respondents chose different zones, including leisure (Wilson 1) and routine (Wilson 2). This supports the hypothesis
Correlation Analysis of x–y Axes.

Note. WE = Wilson–Economic crisis; WN = Wilson–No economic crisis.
Correlation is significant at the .05 level (two-tailed).
Correlation is significant at the .01 level (two-tailed).
The correlation analysis shows that there is a correlation among Kotler questions (Table 4). The mean figures of Kotler’s five questions are usable to probe the buying-attitude levels in the sample. Table 5, which shows the status in zones, offers a better understanding. Kotler’s means increase from the red to the green zones, where the orange and yellow zones are between the red and green zones (Table 6). This also supports the hypothesis.
Correlation Analysis of z Axis.

Note. KE = Kotler-Economic crisis.
Correlation is significant at the .05 level (two-tailed).
Correlation is significant at the .01 level (two-tailed).
Analysis of Attributes (x–y Axes).

Note. WE = Wilson–Economic crisis. Y=Yellow, G=Green, R=Red, O=Orange.
Correlation is significant at the .05 level (two-tailed).
Correlation is significant at the .01 level (two-tailed).
Products–Zone Breakdown.

Note. IT = information technology.
Especially between red and green zones, there are different levels of correlations for staff, position, age, intention to combine office and home needs, and products. Correlation analysis also shows that sector is not a relevant attribute. There is a hierarchical magnitude order for buying-attitude indices among zones. Green is greater than yellow and orange, and red is the lowest. The majority of answers came from the first six products, in which 60% of the unanswered questions belong to only four intangible products. This suggests that intangible products negatively influence buying attitude in the red zone. Although they have the lowest numbers of any zone, intangibles make the biggest jump from the red (2) to the green zone (3.2), with an increase of 60%. When it comes to leading products with the highest numbers, communication/information technology (IT) devices and vehicles are first. The gaps among zones are not significant, but mean values provide a point of comparison for all other products. In addition, tea is the one product in the top four of the buying-attitude list for any zone.
Findings and Discussion
Figure 3 summarizes the results by product. The red zone is the most aversive/conservative, whereas the green zone indicates the most enjoyment. The orange and yellow zones reside between these extremes hierarchically. Therefore, the hypothesis is supported. Due to the 30% greater incidence of aversive buying attitudes for intangible products in the red zone, a correlation exists between tangibility of products and needs characteristics.

Contextualized buying-behavior framework.
From an application viewpoint, this study is unique. Its greatest contribution is that it urges researchers to consider the possibility that SMEs are a subject for individual buying-behavior models, rather than for popular organizational/corporate buying-behavior models. It also suggests various buying attitudes for different products. Communication/IT devices and vehicles lead in all zones, showing that participants do not compromise for those products as they do for others. They also do not seek rationality, because they choose communication devices least aversively in the red zone.
To explain the findings further, a graph was created with regard to the orange normative zone (Figure 4). Fewer than 10% of the answers in the red and orange zones came from first modes. Two normal distributions are bimodal only if their means differ by at least twice the common standard deviation (Schilling, Watkins, & Watkins, 2002). The means of the first modes of the red and orange zones are 0.5 and 0.6, respectively. The differences between their means and the first modal mean are 2.0 and 2.1, respectively. These figures are lower than the doubled standard deviations of the same zones, 2.4 and 2.6. The confidence level applied to the mean values of the zones is 95%. The results show variation of between 3.3% and 5.4%, making the system reliable (Figure 4).

Response breakdown.
δ-N symbolizes the standard deviation between a non-normative (green, red, and yellow) zone and a normative zone. Accordingly, δ-N of the normative zone remains at zero, where the others vary from 0.14 to 0.57. These figures are derived from the mean values of the buying-attitude survey results for the zones. Smaller variation in δ-N represents a smaller buying-attitude factor, which suggests greater aversive buying attitudes compared with others; this is closer to the normative reference that is supposed to be favored. In other words, δ-N figures are risk factors, where lower is better for a purchaser. However, magnitudes are not always enough to summarize this value as the impact of risk. For example, as a risk factor, this is true for 0.57 and 0.14. δ-N in the red zone is smaller than in the green zone, as well as being more aversive and closer to the normative reference. In spite of this, the risk impacts of the red and green zones are equal. In other words, risk factor and risk impacts are different metrics, the latter of which is useful here. The histogram (Figure 4) shows the response breakdown of the answers that should support risk information.
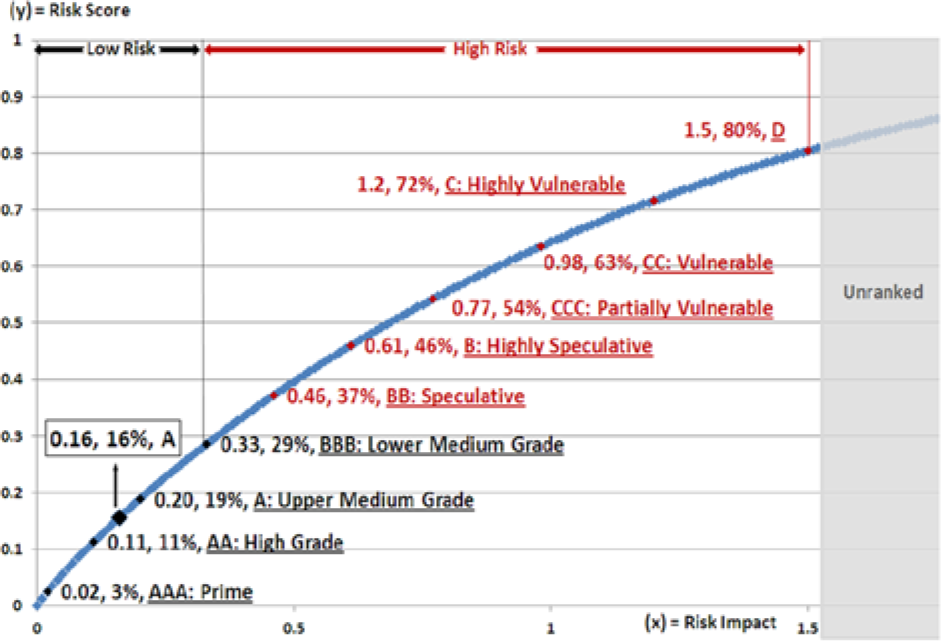
To widen the discussion, a risk impact map was derived from the percentage breakdown of responses and risk factors (Figure 5). The dark-gray areas with white dots represent the weighted risk factors, in other words the risk impact. This graph also shows a new color order, ending with the orange zone’s zero-risk impact and representing absolute procurement maturity. The statement made in the previous paragraph was about the risk impact of the green and red zones. They are both 0.06 and bigger than the yellow zone’s risk impact, which is 0.04. This makes the yellow zone next to the orange zone. The factor that places the risk impact of the red zone after the green zone is risk type. The risk type of the red zone is different from that of both the green and yellow zones.
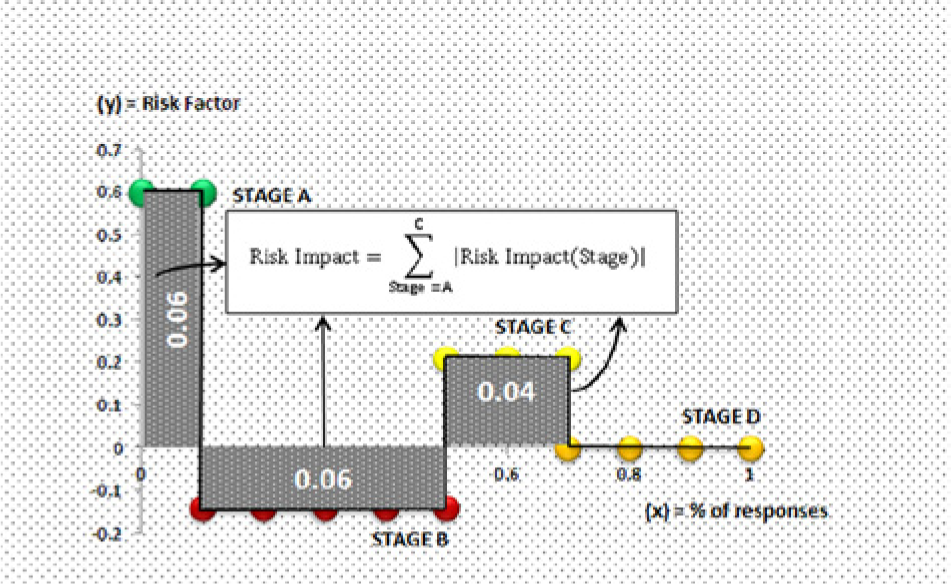
Risk impact map (maple view).
According to the hypothesis, the difference occurs in the direction of the buying attitude. The red zone’s buying attitude should always be smaller than that of the orange zone, whereas others should be bigger than the same normative zone. Using buyers as an example, upper-normative risk impacts show negative risk, whereas the lower-normative risk impact (red zone) shows positive risk. For marketers, the conflict of interest between buyers and marketers results in opposite risk types. To improve procurement or marketing strategy, they should both mitigate the negative risks and enhance the positives, but at different levels. The green zone, coded as impulse buying behavior in early sections, is a threat (negative risk) for buyers, but an opportunity (positive risk) for marketers.
This approach places the red zone at the second rank. Carrying this further, even if the red zone’s impact factor is bigger than that of the green zone’s, because of its reactive nature, the place should remain the same. The reason for this is that the reactive nature has either an opportunity or opportunity cost, rather than an already-accrued direct cost, as in the green zone. This new color order is an important step to prioritizing both losses and potential gains; it summarizes the stages that should be considered first. Because it can be expected that this path remains the same for other possible regions of the world, the name “Sugar Maple View” is assigned to make it easier to remember (the name is derived from the fact that despite its different cultivars, the majority of sugar maple tree types have leaves that turn from green to red first, unlike many other trees, and a yellowish orange before they fall [Lockhart, Matus, Schwager, & Czech, 1998]).
The epsilon of the zonal risk impacts’ absolute values is the risk impact of the system. This was calculated as 0.16 with the absolute values of Stages A, B, and C. However, this most likely value, 0.16, needs to be compared with the entropy of the system. The maximum risk impact of the system can be calculated with the maximum possible σ, which arises when 100% of respondents choose non-normative zones, in which case the orange zone does not exist. The Likert-type-scale-based axis maximum and minimum were 6 and 0, respectively. The σ of these values gives 4.2 as the risk entropy of the system. In the end, we know that at 0-point risk impact, the risk possibility is 0%, whereas at 4.2-point risk impact, the risk possibility is 100%.
To estimate the risk possibility that comes with the most likely value, 0.16, we used triangular estimation to lead to a beta distribution. Hypothetically, beta distribution may lead to a linear demonstration, or to curves with various shapes and scales. Especially when the skewness is expected to be high, either positive or negative, beta distribution is widely used to model probability densities in risk analysis, as well as strategic planning (Moitra, 1990). We applied the formula set below to attain
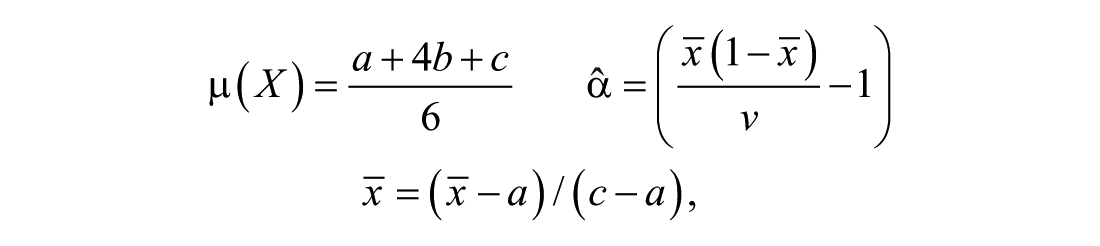

Using the above-mentioned four variables within the following probability density function of beta distribution, where

Probability density.
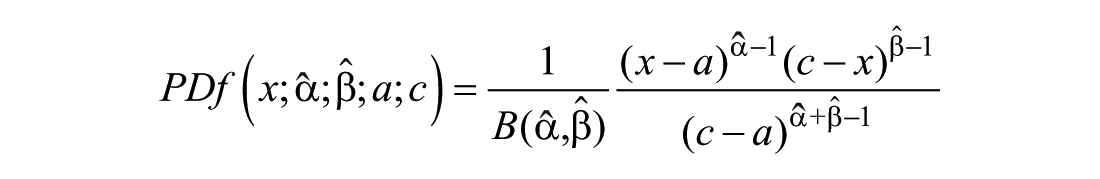
Figure 6 shows that 80% of the possibility density appears under the standard deviation area. When we use this probability density formula to construct a cumulative distribution, we find that the percentage demonstration, out of 100% of the sample, is most likely to be the value 0.16, representing the risk score of the sample. Because there is no cumulative distribution function with real numbers for beta distributions, we use a scale number of 0.01 to derive both the equation and the graph.

The risk score of the sample under economic crisis is 16% (Figure 7). We replicated all formulas, starting from the Sugar Maple View for non-economic crisis samples, and calculated the risk-impact and the risk-score values as 0.21% and 20%, respectively. Due to the relatively small difference, a change in
Risk-score grid.
Knowing that even a deviation of a few percentage points from targets may hurt business in this current competitive era, two-digit variation is one of the most crucial operations in a company and should definitely be considered a yellow flag by stakeholders. For larger procurement-risk scores in particular, to protect national capital value, policymakers or SME segment bodies may trigger further research to understand why SMEs do this. They can also initiate an awareness campaign to promote wiser spending among SMEs. Where conflicts of interest arise, marketers to SMEs should reevaluate their current marketing plans and make sure they cover non-normative buyers, as they may lead to an unmanageable strategy with revenue losses of up to 16%.
Inspired by credit agencies such as Standard & Poor’s, Fitch, and Moody’s, we developed a grading system (Standard & Poor’s, 2011). Knowing there is no absolute objectivity with these offerings, we challenge the current body of knowledge. As shown in Figure 6, we excluded the right side of the standard deviation, which means 20% of the risk scores—the tail—were not graded. The remaining 80% were divided into 10 equal parts for 10 grades (Figure 7). Each grade resulted in 8% intervals. Given the positive skew, the risk-impact delta increases as risk scores increase. For example, while the delta of the risk impact is 0.3 between CCC and D, it is only 0.09 between AAA and AA. According to the risk score, two different samples show 16% and 20% risk scores as A and BBB grades, respectively. It is notable that BBB is only a grade better than the high-risk area.
Research Implications
Behaviorists
There is always unpredictability in customer behavior (Day, Gan, Gendall, & Esslemont, 1991), and attributes do not always provide adequate explanations. As the correlation analysis shows, the sector does not seem to be a factor. Staffing numbers and age are not absolute attributes either. The 30 to 39 mode is dominant in both the red and green zones. Therefore, perceptions are more telling than attributes. Analyses of perceptions and their causes are part of the cognitive psychology field, which includes complex studies by nature. Questions such as “why some needs are perceived to be more important than others” are not scrutinized here. Therefore, behaviorists may conduct further research to understand the reasoning behind this map. They should also explore inner (implicit) factors such as assumptions and values for all stages, and yield results related to the current picture. More qualitative questions may help within this context, for example,
Why is brand/model more important than the product’s functionality?
What is the real reason why customers pay more for information and communication technology (ICT) or TVs in the office, compared with other needs?
Does the company really have the luxury to pay more for certain products, either financially or in terms of opportunity costs?
Does the country in question have the luxury of tolerating this type of buying behavior?
Once researchers provide further answers to questions such as those above, SMEs can question the current stance and revisit the value assessment. Behaviorists can also generate different sub-products to determine more detailed perspectives. For example, the IT sector may be divided into many components, including cloud computing, desktop applications, and security. It can also be applied to various countries and regions to probe differences and similarities. This provides a chance to see whether SMEs around the world talk the same purchasing language/have the same purchasing attitudes. Are they really smaller versions of large corporations and, like individuals, do they impulse buy outside of rational reasoning?
If we accept that risk impact increases more in Middle Eastern countries, and assume that the survey includes a risk impact of 0.8 instead of 0.16 after replicating all formulas used in this study, we observe a more negatively skewed probability density (Figure 8).

Probability density and risk score grid (non-crisis status).
The cumulative distribution shows that 0.8 ties with a 31% risk score with a BB grade, which is in the high procurement-risk zone. It is notable that with risk impact intervals of 0 and 4.2, the risk entropy and magnitude of the standard deviation do not change. Due to the grading scheme, the risk score and grading relationship remain the same. For example, 31% always falls into BB. What is changed is the risk impact figure tied to 31%—which is 0.8 here.
This will also serve to allow policymakers to ground their awareness campaigns to better reconcile functionality, rather than look, or tax the audience more. Policymakers can conduct research to understand the reasons for inefficient procurement practices in the region and take actions based on awareness and knowledge.
Managerial Implications
For marketers, it is about being aware of non-normative stages and planning a strategy according to the opportunity, but government bodies and SME owners would be interested to hear more about the reasoning.
Marketers
Technology marketers can explore whether SMEs seek a rational reason for buying technology, as individuals do. SMEs are more eager purchasers for some particular products than they are for other products. They compromise less for communication devices, vehicles, and tea. Once marketers realize this, they can adjust their strategies in terms of marketing communications and branding. They may not need to justify each campaign they design to sell IT, or position it for SMEs, who always favor low-cost products. As a matter of fact, the “non-normative” typology appears to be more lucrative to marketers in a pragmatic sense.
Marketers should note that small-company owners do buy for both the office and the home. When they buy a computer for the office, for example, they tend to buy the same brand and/or model from the same vendor for the home. Therefore, IT marketers may want to remember that once they win small-company owners, they win in relation to both office and household needs; the small-company owner is the natural purchasing manager of the household, especially in terms of big-ticket products such as computers and vehicles.
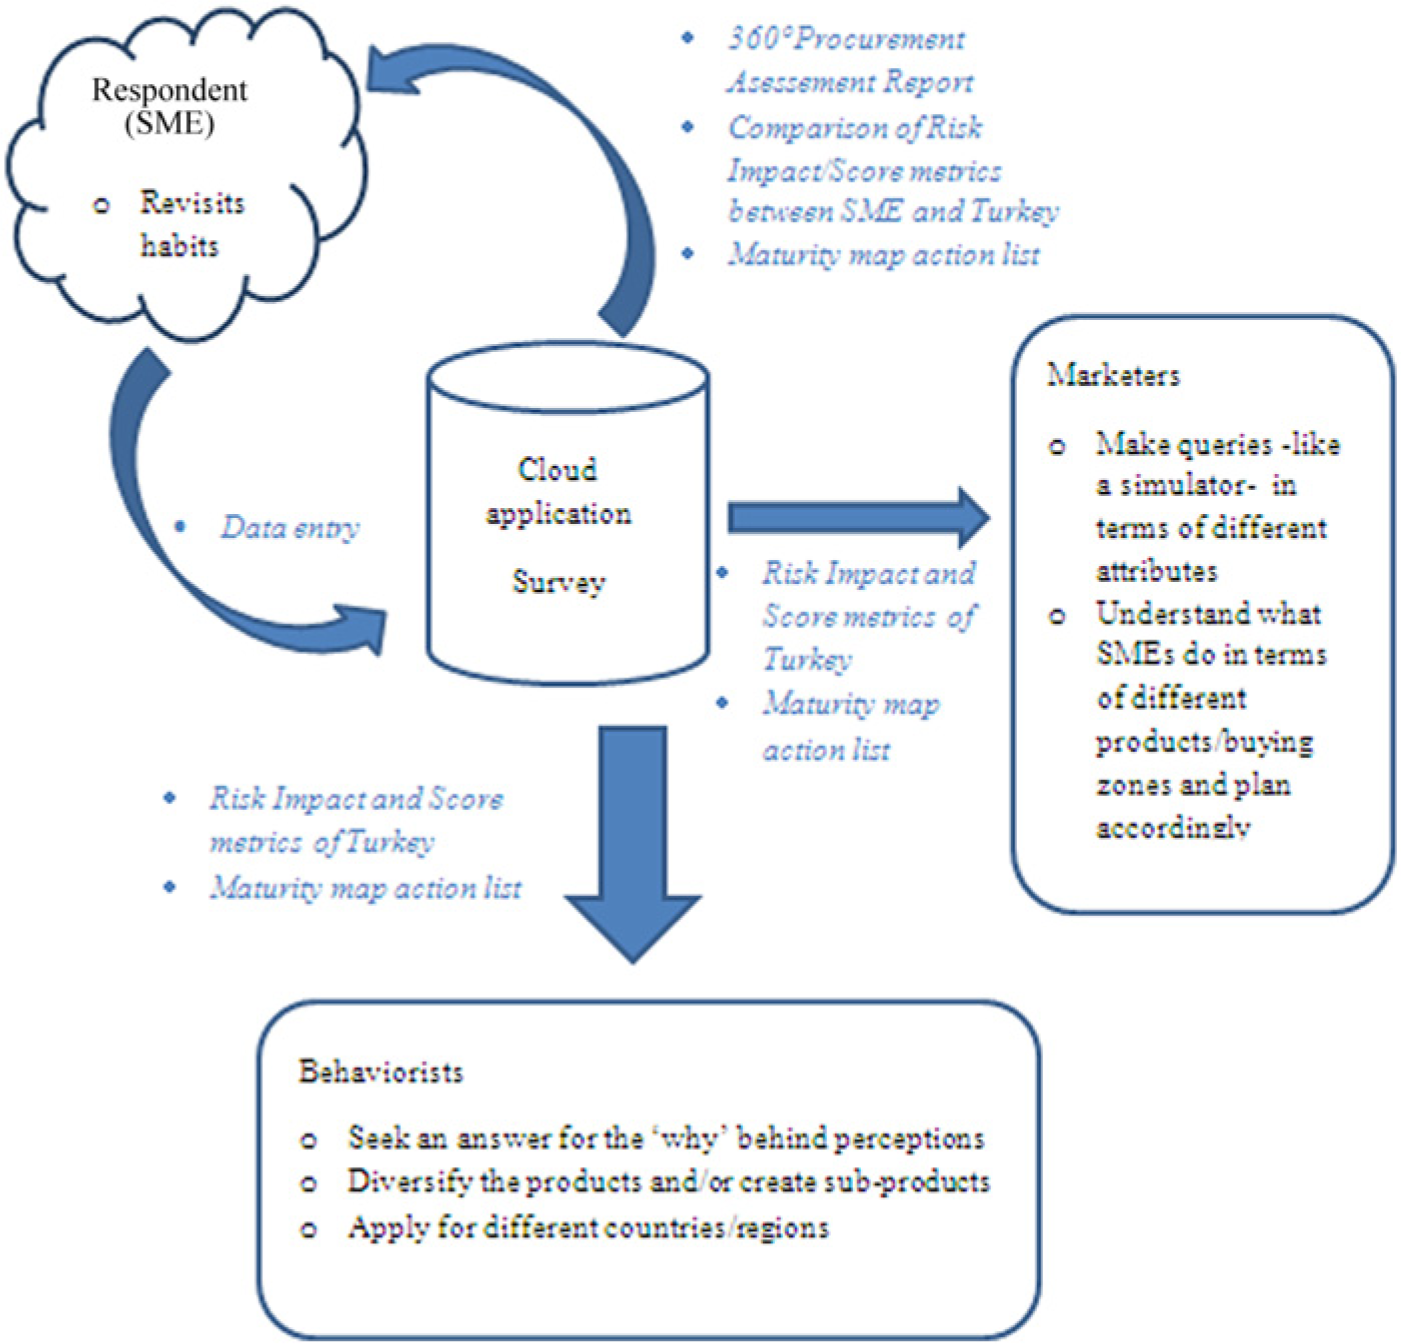
In practice, they can access a cloud system and conduct queries using situational simulators with different attributes to determine changing buying behaviors for different products in different zones. Except for some partial attributes such as company size, year of establishment, and education level of the company owner, there are no clear, absolute parameters to define stages. It can thus be challenging to conduct traditional marketing data queries and reach SMEs easily; however, we know that there are non-normative customers with three buying-behavior characteristics, and we also know what and how they buy in terms of preferred brands, marketing communications, payment methods, sales points, and response times. What marketers need to do is make sure they have a presence of all possible correct matches of price–product–place–promotion, with all possible combinations targeting non-normative stages.
SMEs
There is an opportunity for confrontation between SME managers and procurement practices. Practices such as 360-degree assessments are widely used in human resources and organizational development. A procurement version probes needs assessments, and hypothetical questions can be answered to benefit the owner of the company. A real-life example can be offered from one of the subjects of this study, selected randomly: The setting is an SME construction company with 10 to 49 employees. The respondent is a manager, male, married, 30 to 39 years old, with a community college degree. A one-page procurement analysis report may be generated on completion of the survey and sent to the particular respondent to provide a comparison of sector averages. Once we calculate the risk-impact factor with help of the Sugar Maple View, it results in 0.23 and 0.34 for economic crisis and non-crisis views, respectively. Turkey’s procurement-risk graph puts those scores into the BBB and BB grades, where both are a letter below Turkey’s average, and the latter is in the high-risk zone. What SMEs can do is start to think about possible effects and whether they should tolerate or not.
The economic crisis and non-crisis statuses show that products move to the green area (upper right corner), aligned with construction/10-to-49-employee companies, and with all responders. However, the magnitudes get 34% larger than average growth (Figure 9). Similarly, the non-crisis magnitudes of buying attitude are 11% and 13% larger than the construction/10-to-49-employee SMEs, and all respondents, respectively. The company owner may want to know this and consider explanations. The excitement breakdown for products is also different from the metrics mentioned above. For example, TV is becoming less aversive, whereas the communication/IT device category remains stable. Enjoyment of financial services is rated 5 out of 6, and 45% above the sector average. The latter can be explained with reference to the need to collaborate with banks and find good deals to sell houses.

Product breakdown report for an SME: Economic crisis (left) versus non-crisis status.
Final Framework
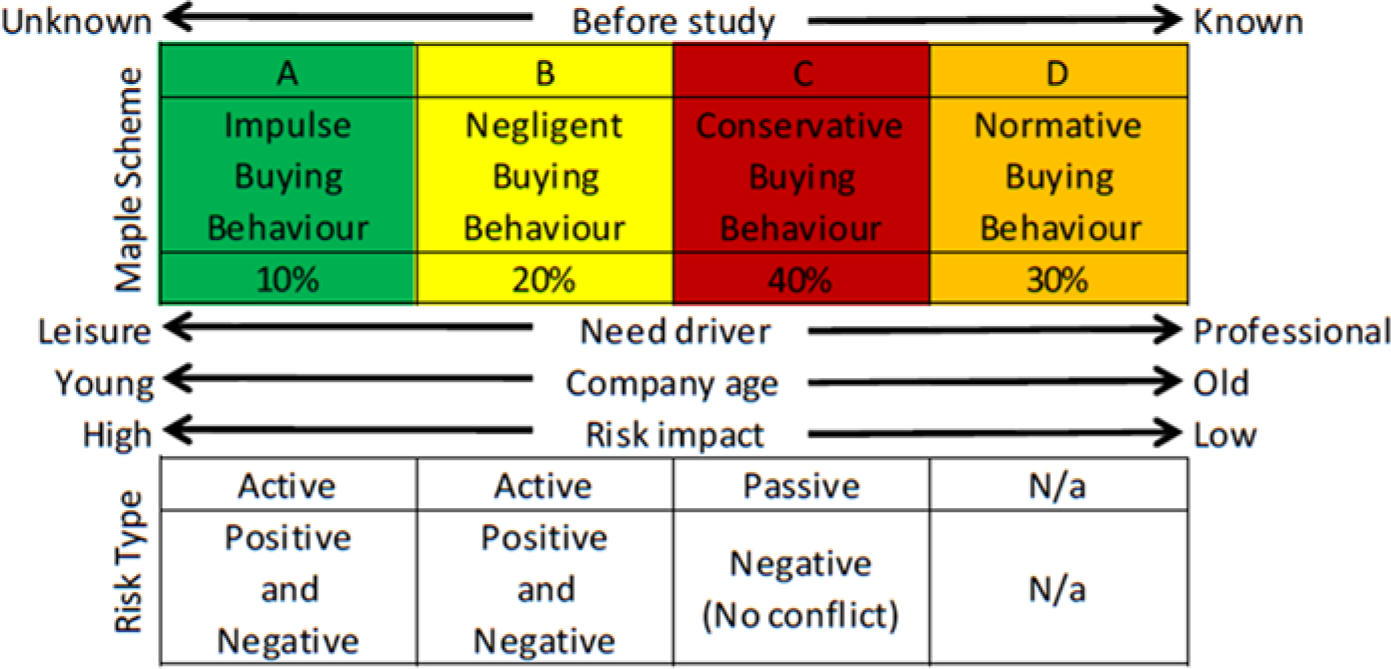
The final framework (Figure 10) can also be understood in light of the following points:
The unknown is no longer unknown.
Seventy percent of the audience are non-normative buyers.
The color codes show the buyers’ eagerness, where green is high and red is the low.
Unlike company age, the variables sector, employee size, title, education, and age are not significantly correlated with any typologies.
Buying eagerness is correlated with leisure buying, particularly for tangible products, popular technology, and vehicles.
Even in an economic crisis environment, SMEs in the green and yellow typology compromise less for tangible products.
Active: Negative risk is associated with SMEs and policymakers, whereas positive risk (opportunity) is related to marketers.
There exists a conflict of interest between marketers and other stakeholders.
Passive: Buying less than the normative zone (conservative) brings a potential risk of not investing enough.
There is no conflict in the conservative typology, because all stakeholders want to increase investments.
Final framework.
Discussion
A proposal was prepared to summarize the findings in terms of strategic improvement based on a timeline view in relation to risk impact (Sugar Maple View, Figure 5). This triple view included three different stakeholders: researchers as objective parties, marketers, and SMEs (Table 7). Although the latter two may carry a conflict of interest by nature, it should be noted that this is not always the case. Revisiting a real-life case with respect to Intel’s expansion in Turkey, unlike in developed countries, the expensive microprocessor Pentium dominated the vast majority of demand, as opposed to its cheaper counterpart Celeron. There was a relative mismatch between the need and the product, with several unused features; however, this was no secret for either party, and both were happy. In similar cases, policymakers can even consider applying incremental taxes to such “over-the-need” imported models, as they do for large-engine vehicles.
Procurement Action Maturity Framework for Different Stakeholders.

Note. SME = small and medium enterprise.
For instance, knowing that SMEs make up 50% of Turkey’s €500 billion gross domestic product (GDP), even with the 16% to 20% risk score found, the resulting economic value can be estimated at tens of billions of euros. Taxing the over-purchased part incrementally might either decrease the presence of over-purchased products, or increase the tax collected, where both may result in a value of billions of euros per year.
Deployment includes both positive and negative risk strategies. What is negative for buyers (Stages A and C) can be positive for marketers, and the opposite is also true—what is positive for buyers (Stage B) can be negative for marketers. However, there is one common factor for marketers: Both occasions come with opportunities. A summary of usage models is shown in Figure 11.
Summary of usage models.
Conclusion
SMEs have long been the basis of economic activity; however, this has only really been recognized in the 20th century. Many studies and industry practices assume SMEs to be “normative” or “conservative” buyers. Although understanding customer potential has been named as a top priority among many sectors, there is a limited body of knowledge on SMEs’ buying behavior.
Following an extensive literature review, this research was led to Wilson’s Cube (Figure 1). Wilson (2000) not only offered an integrated model for buying behavior but also promoted its usage in a broad manner: Although his proposal was intended to consider organizational buyer behavior, Wilson suggested that it can also be applied to the context of consumer purchasing. The reverse should also be possible, and Wilson therefore does not perpetuate an unnecessary distinction and promotes a unified model. However, it has not previously been applied to SMEs.
This study enabled a significant application to the SME context by conducting a study using 270 participants. The tested—as well as validated, using 10 SMEs—hypothesis proves that SMEs also buy within the leisure–routine axes of the cube, and that they spend more like individual consumers (Figure 3). In other words, the current practice, based on the assumption about their categorization in corporate buying-behavior models, is not correct.
It, thus, appears that SMEs—and even other stakeholders—are either
Unaware of—from a vantage perspective—this impulse-like purchase behavior;
Not accepting of this possibility, as they have already rationalized the behavior; or,
In a euphemistic way, do not care about the professional reasoning behind their purchase behavior.
This study makes the unknown—or tacitly ignored—buying-behavior typologies in SMEs clear. Known part was defined as the normative typology, where the unknown part was the non-normative stages where it covers 70% of the respondents. According to this breakdown, SMEs act like consumers.
In other words, the “non-normative” presence accounted for about 70%, and the current practice, based on semantics about their categorization in corporate buying-behavior models, is not supported. This has implications for stakeholders who base their behavior on this erroneous knowledge set, as well as behavior researchers, who could be heading in the wrong direction and thus basing their studies on incorrect assumptions. Marketers could also be affected by this new knowledge, as they have not previously acknowledged the SME segment or accepted its presence, so they have not technically been able to address the segment’s needs in a navigated way, and therefore end up wasting resources. SMEs themselves could also benefit from the research, because it provides new insights into their buying practices, which could be considered to be leisure-related, meaning that they would not have previously questioned whether they had the luxury to spend in such a manner.
Limitations and Future Directions
Within this study, following the primary observation and the secondary data, we conducted an extensive literature review. Due to budget issues, we conducted the field survey in the city of Eskisehir. Although the generalizability of the results can be justified, a parallel session conducted in Istanbul would be useful as well. For similar reasons, our validation did not cover aspects of the results such as risk impact and risk score. Although validation is not considered a technical necessity for empirical research (either for the survey results, or for the further formula-based findings), especially for the S&P simile frontier, the grading part of the risk score may be criticized as not being grounded enough. Therefore, it has been offered as a supplementary approach that can serve to policymakers as efficiency seekers in the country.
Procurement risk scores derived from the country’s procurement habits can play a significant role as one of the key efficiency components. However, based on the country’s potential maturity, policymakers can initiate a program through a think-tank institute rather than a governmental body, which can also spread to an international level. Turkey is considered BBB, which is a grade better than that of the “high-risk” zone. It is very possible that only a group of pilot countries would contribute meaningful validation to the proposed risk-score map. In the end, the acceptability of a comparative ranking system will depend on its being embraced worldwide.
Footnotes
Declaration of Conflicting Interests
The author(s) declared no potential conflicts of interest with respect to the research, authorship, and/or publication of this article.
Funding
The author(s) received no financial support for the research and/or authorship of this article.