
Abstract
Corporate governance remains a focal point for policymakers, investors, academics, and the public. While existing research has delved into the relationship between chief executive officer (CEO) compensation and firm stock performance, the findings have been inconclusive. Notably, the investor-owned public utilities sector faces distinct governance challenges due to private and public pressures. In this study, we examine CEO pay within publicly traded large-cap U.S. utilities from 2016 to 2020, aiming to gauge performance. Our research design incorporates statistical procedures involving correlations and t-tests to analyze these relationships comprehensively. Over the specified period, the utility industry generally underperformed the S&P 500 benchmark. Our findings affirm a positive correlation between CEO compensation and stock performance providing both practical and scholarly implications. Particularly, an increase in CEO total compensation corresponds to improved stock performance. Additionally, we identify significant associations between CEO pay increments and the firm's performance relative to the utility index (VPU). We advocate for further investigation to validate these relationships across diverse time frames and even industries, emphasizing their significance.
Introduction
From 1978 to 2018 compensation for chief executive officers (CEO) has grown 940% while typical worker compensation has only risen 12% (Mishel & Wolfe, 2019). In 2020, the CEO salary growth exceeded 1,322% from 1978 to 2020 (Mishel & Kandra, 2021). The CEO-to-worker compensation ratio stood at 21-1 in 1965 with the ratio at 351-to-1 in 2020. In 2020, a CEO at one of the top 350 firms was paid $24.2 million on average (Mishel & Kandra, 2021). Questions remain that in spite of the increase of compensation for CEOs if corporations and shareholders are achieving an adequate renumeration for the additional compensation rendered.
Today (in 2022), CEOs, often, continue to be the poster examples of excess. In many cases, CEOs take home millions where their workforce struggles to see their pay keep pace with inflation. CEOs are rewarded often while taking significant risks to the wellbeing of the organization. Frequently, they are championed to advance cost cutting measures like employee benefit cuts and layoffs. Still, executive compensation continues to rise.
As CEOs may be compensated favorably this study aims to explore the relationship in the utility industry between CEO pay and firm performance measured by stock performance providing valuable insights to the academy. Notably, the motivation for this study stems from the fact that utilities represent the broader community and play an important role in providing essential water, electric, and gas service. The study considers executive compensation through the natural gas and electric utility industry, one frequently ignored industry by scholars and the public alike. The industry, unique with its private and public components is one such industry to study the relationship between executive compensation and stock performance. Given its regulatory structure, the pay ratios for utility CEOs are significantly smaller multiples at 97 to 1 when comparing a typical worker with an average compensation of $12.9 million for those in the S&P 500 index (Executive Paywatch, 2022). While, this industry may not match other industries pay differentials in the S&P 500 such as consumer discretionary at 741 to 1 or information technology at 315 to 1, it still presents a distinctive opportunity to examine this further (Executive Paywatch, 2022). This examination presents opportunity to investigate CEO compensation and performance observing potential gaps in understanding this important relationship. Moreover, given the regulatory burden on utilities, government action may be quicker than other industries to restrict compensation rendered to CEOs if firm performance does not merit the increases achieved from the firm. This paper seeks to understand the research question does publicly traded utilities with higher executive compensation result in better stock performance? In conjunction with that research question, we hypothesize that CEO pay will be tied positively to firm performance.
In the forthcoming sections, the paper will first discuss briefly the utility industry. Next, the paper will consider pertinent literature in understanding dynamics at play for firm performance and executive compensation. The methodology section will follow, delineating the study's approach, including a detailed discussion of the data and variables utilized. Following, we provide an analysis of the findings obtained from our research. Lastly, we conclude by offering insights, implications, and recommendations for future studies.
Utility Industry
Utilities are granted the exclusive service right to operate in a given jurisdiction. Utilities can be thought of as natural monopolies (i.e., there is only one set of electrical power lines or one set of natural gas pipes), governments regulate public utilities to ensure that they provide a reasonable service at a fair price. As an industry, energy is a sizeable share of the U.S. economy, estimated at 9%of gross domestic product (Institute for Energy Research, 2010). In market capitalization, energy as a broad category comprises of 3% of the popular S&P 500 index market benchmark (Landsman, 2021).
In the United States, investor-owned utilities make up a small percentage of the total number of public utilities. However, these investor-owned utilities frequently serve a large customer base, with over 650,000 customers on average (Darling & Hoff, 2019). To put that in perspective, in 2017, these investor-owned utilities served over 72% of all US electric customers (Darling & Hoff, 2019). Distinctively, investor-owned utilities seek after profit for their shareholders compared to municipal utilities which act as an extension of a government agency.
The connection between society and public utilities can be considered a regulatory contract (McDermott, 2012). Within the regulatory contract, utilities create and implement public energy policy. This regulatory contract stipulates the mutual rights, obligations, and benefits that exist between both parties. Moreover, the regulatory contract strikes a balance between the needs of society versus the needs of the utility. Regulation creates a special bond between the owners of private property (the utility) and the agent of the state (the regulator). This contract strives to protect both the utility and the consumer. This arrangement grants a state agency i.e. public utility commission or public service commission the ability to dictate the utility’s activities and even so far as how much it can earn. In this arrangement, utilities accept the obligation to serve customers and charge regulated, cost-based rates, and correspondingly customers agree to limited choices, with protection from monopoly pricing (McDermott, 2012).
Literature
The literature on firm performance, and executive compensation is expensive. Our research contributes to the literature by providing an empirical analysis for the utility industry and executive compensation often an understudied area. Practically, firms wish to know if they are compensating CEOs appropriately to maximize firm performance while the literature on corporate governance remains varied on this critical relationship. Notably, Nobel laureate Milton Friedman (Friedman, 1970) proposed the Friedman doctrine or a stockholder theory. This normative theory argues that a firm’s sole responsibility is to its shareholders. Friedman contends that “there is one and only one social responsibility of business—to use its resources and engage in activities designed to increase its profits so long as it stays within the rules of the game, which is to say, engages in open and free competition without deception fraud.”
More broadly, corporate governance encompasses how stakeholders (i.e. equity holders, creditors, employees, consumers, suppliers, government) control corporate insiders for protecting interests. Theoretically, corporate governance may encompass the effort to align performance to compensation by making executive compensation tied to firm value. In that regard, if firms are successful compensation and firm performance should coincide. Financial aspects connected to governance identify how the board sets financial policy and oversees implementation as well as reporting back to shareholders on the company’s activities (Morris & Dunne, 2008).
In the realm of corporate social responsibility and corporate governance Zaman et al. (2022) provide insights on exploring the relationship (Zaman et al., 2022). Berber et al. (2019) identify that the problems, interests, and goals of stakeholders as part of a company’s business integral to corporate governance with a relationship between both corporate social responsibility and corporate governance (Berber et al., 2019). Kyere and Ausloos (2021) note that when the correct corporate governance mechanisms ae chosen, the finances of a firm also improve.
Still, others observe a lack of a link between governance and performance that is Young (2003). Jeppsen et al. (2009) examined CEO compensation for 200 large public companies in 2007 finding that there was not a strong relationship between CEO compensation and firm performance. Others found an increase in CEO compensation seems to improve the accounting-based firm performance, nevertheless it hurts the firm stock market value (Zoghlami, 2020) Fisher and Lindermoyer (2020) studied 200 firms in the U.S. with revenues over $1 billion in 2018 finding a disconnect between CEO compensation and firm performance. Additionally, previous studies have observed specific industries (i.e., hospitality (Yuan & Singal, 2018), insurance (Bhuyan et al., 2020)) or specific geographical locations (i.e., Asian Pacific (Kayani & Gan, 2022), China (Bin et al., 2020), India (Kaur & Singh, 2018)). Previous studies have also explored firm performance compared to environmental commitments (Peterson, 2022).
Notably, in manufacturing, Mehran (Mehran, 1995) found that firm performance (1979–1980) is positively related to the percentage of equity held by managers and to the percentage of their compensation that is equity-based. Bryan and Hwang (Bryan & Hwang, 1997) previously examined CEO compensation in a regulatory environment like that of public utilities. They found that increased political constraints affect both the level and structure of CEO compensation, after controlling for investment opportunity set and other firm characteristics, such as firm size, systematic risk, and performance. Agrawal et al. (1991) examined executive compensation for electric and gas utilities finding firm performance suffering if a CEO stays on over 15 years. Zhou noted in his study of Canadian firms from 1991 to1995 that executives in utilities earn lower pay, and their compensation is less responsive to performance than is true for their counterparts in other industries (Zhou, 2003). Brick et al. (2006) observe that excess compensation is associated with firm underperformance.
Methodology / Research Design
The investor owned utilities considered for this study were selected using Yahoo! Finance’s Stock Screener (Finance, 2021). We chose the stock screener because the study can easily be duplicated to measure the impacts or changes for the future. While more common for private investor research, previous academic studies have used Yahoo! Finance for studying firm performance (i.e., corporate governance and firm performance (Malik & Makhdoom, 2016), knowledge flows and corporate governance (Erden et al., 2014).
Yahoo! Finance’s built-in stock screener first revealed 316 utilities in the United States. Upon filtering this list, based off regulated electric and regulated gas utilities yielding we found 139 results. We next filtered to only include large caps as defined by popular investing web site, Investopedia as a market capitalization of $10 billion or more (Ross, 2021). We filtered based on the capitalization size of the organization for relative consistency in the firm operating procedures.
From the remaining list, we filtered companies that were listed more than once as exhibited by multiple series of stock such as with Dominion Energy’s preferred stock (DCUE) and its common stock (D), or National Grid being separated out with stock symbols as NGG and NGGTF. We only included the common stock in this analysis. We also eliminated companies identified in the stock screener that were not headquartered in the United States such as The Hong Kong and China Gas Company Limited. We also removed companies that may have U.S. operations but were not headquartered in the U.S. Figure 1 shows a diagram reflective of an inverted pyramid showing the selection process in Yahoo Finance!

A diagram demonstrating the selection process for large cap electric and gas utilities shown through three iterative steps.
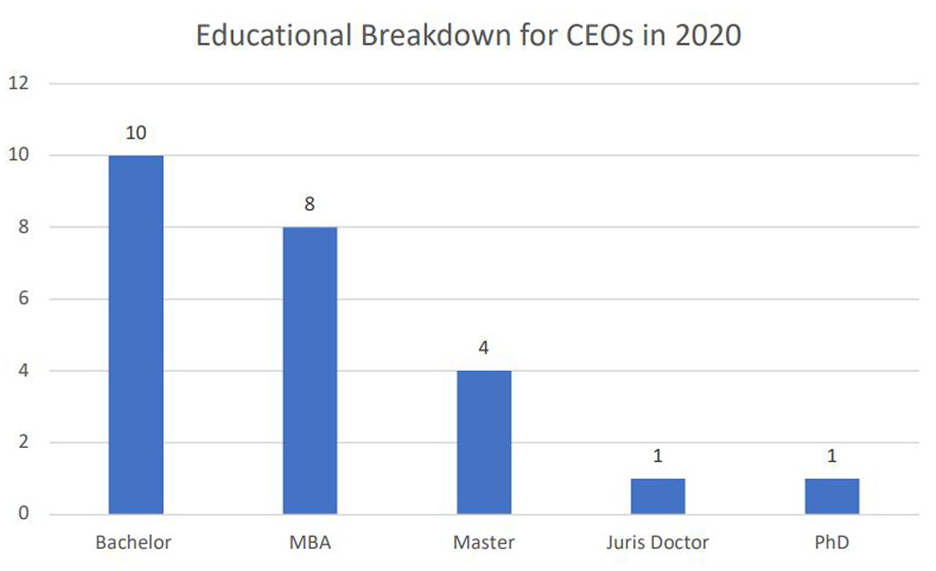
In total, from Table 1 there are a total of 24 investor-owned utilities selected for analysis. We included, UGI Corporation as its market capitulation at the time of the data gathering was determined as close enough to the $10 billion requirement to be considered a large cap stock. For confirmation, we verified that these utilities matched the North American Industry Classification System (NAICS) codes representative of a utility (Erden et al., 2014). While only selecting 24 firms may be a relatively small sample size, it still reflects a composition of large cap U.S. based utilities due to the market capitalization of each which makes them important determinants in this industry.
A List of the Utilities Considered in this Analysis Including Market Capitalization and PE Ratio as of December 13, 2021).
For the financial data for the companies, we went to Edgar, the Securities and Exchange Commissions’ data source for the companies. We subsequently gathered the financial performance for these companies from 2016 to 2020 due to the availability of data and the possibility of gathering insights over an extended period. We gathered stock data for these years to reflect the general growing U.S. economy measured by S&P 500 (67.77%). We also gathered from each proxy statement the CEO’s total compensation for the year. We used Yahoo! Finance to identify the stock performance for each of the years for the firms in questions. We compared the performance of the stocks.
In our research we examine the research question do publicly traded utilities with higher executive compensation result in better stock performance? To study this question, we examined firm performance from 2016 to 2020 for large cap utilities using quantitative data gathered from publicly available sources. To establish an understanding of the firm’s performance in relation to executive compensation, we consider this via t-tests and correlation analysis for grasping the relationship. We purposely sought to examine relationships with correlations and t-tests in our analysis given the harder advent to establish causality vis a vie, regression or other statistical techniques.
The data that support the study findings are publicly available through common stock exchange repositories. The specific data used for analysis are available from the authors upon reasonable request.
In this section, it is imperative to identify and describe each of the variables considered in the analysis. This section ensures that we are discussing shared concepts. Following is a list of those variables and a working definition for each of those for our analysis. We chose these variables as they are relevant in establishing a relationship between our hypotheses and the analysis for our data. Following is a list of the variables for consideration utilized in the analysis.
Market capitalization—for our analysis, we consider the market performance as “the value of a corporation derived by multiplying its stock price by the number of outstanding shares” (Etzel, 2003).
CEO compensation—we consider CEO compensation as the total compensation derived and presented on the respective corporation’s proxy statement as indicated via the Securities and Exchange Commission’s EDGAR web site. Moreover, detailed data of compensation and income of named executive officers for each fiscal year from 2016 to 2020 stands as the time frame of interest.
Firm performance—we calculate firm performance based on the increase or decrease in the respective corporation’s stock price depending on the time frame of interest. In our analysis, we do not include any dividends reinvested or paid out to investors as part of the analysis. Moreover, this performance is examined at the 1-year, 3-year, and 5-year interval. Our evaluation of firm performance entails collecting and calculating the data of stock price, income stated on 10K reported to SEC.
Total assets—for our purposes, we consider this sum of assets owned by person or organization the total value of all current and long-term assets owned by a person or organization (“Total assets” QFinance: The Ultimate Resource, 2014).
Income—the corporation’s income is derived from data from the respective firm’s 10K reported to SEC.
Standard & Poor’s 500 (S&P 500)—is a common benchmark index for investors to derive performance of a stock relative to the index. This is an inclusive index made up of 500 stock prices including 400 industrials, 40 utilities, 20 transportation, and 40 financial issues. The index is constructed using market weights (stock price multiplied by shares outstanding) to provide a broad indicator of stock price movements (Scott, 2003).
Vanguard Public Utilizes (VPU)—this seeks to track the performance of a benchmark index that measures the investment return of stocks in the utilities sector. This may further help identify utility/firm success in comparison to the index (Vanguard Utilities ETF, 2022).
CEO tenure—this measurement identifies the length of time that the CEO has been in office during the 2016 to 2020 time frame.
Analysis
As mentioned, in this analysis we examined the performance of 24 large cap, U.S. based utilities. These utilities ranged from UGI with a market capitalization of $7.28 billion to Nextera Energy with a market capitalization of $151.2 billion at the end of 2020 respectively. As reported in each utility’s books, these companies had an average total assets of $49.5 billion from 2016 to 2020. Average net income across the utilities over the 5 years totaled nearly $1.7 billion.
Stock performance varied greatly over these 5 years (2016–2020) ranging from a loss of 79.5% for Pacific Gas & Electric to a 158.37% gain for Nextera Energy. For reference, our analysis does not include performance with dividend reinvestment for utilities and comparable indices. Notably, Pacific Gas & Electric became ensnared in lawsuits filed for bankruptcy protection in January 2019 (Roth, 2020). Performance for Vanguard’s Public Utility index fund (VPU) saw an increase of 28.23%. This index still trailed the S&P 500 which rose 67.77% during this time period. Notably, only Nextera Energy outperformed the S&P 500 during this five-year time period. Ten utilities fared better than Vanguard’s utility index fund (stock ticker: VPU) during this time period. For five-years these utility stock symbols included: NEE, AEP, XEL, ES, WEC, AEE, ETR, CMS, LNT, and ATO.
We also explored stock performance over a three-year time horizon (2018–2020). A three-year analysis revealed stock performance range from 77.52% increase for Nextera and a loss of 47.5% for Pacific Gas & Electric. VPU saw a 16.46% over 3 years (2018-2020). During this time period, the S&P 500 increased 49.83%. during this time period, only Nextera outpaced the S&P 500, but eight utilities performed better than the VPU. For 3-years these utility stock symbols included: NEE, SO, XEL, ES, WEC, AEE, CMS, and LNT.
We also examined the one-year performance for these companies. A 1-year analysis for 2020 saw stock performance range a loss of 37.02% for Pacific Gas & Electric to a gain of 27.44% for Nextera for the year end. For the one-year analysis VPU declined by 3.97% while the S&P increased 16.26%. During this time period, only Nextera outpaced the S&P 500, while nine utilities outpaced the VPU. For one-year these utility stock symbols included: NEE, DUK, SO, XEL, WEC, PCG, AEE, CMS, and ES.
Considering that the focus for our analysis encompassed an interest of stock performance as compared to different variables highlighting the CEO compensation, we initially examined our data for potential outliers looking at the standardized values for our dataset. We considered the standardized values measuring the stock performance of 5, 3, and 1-year intervals. In this regard, we only found one value which could be construed as an outlier during this time-period. This included Nextera Energy’s five-year stock performance of 158.37%. The standardized value was still only 3.15 or barely above the general rule of eliminating outliers at a z-score of +/−3. To that end, we decided to keep that value in for most of the analysis unless otherwise noted throughout our discussion.
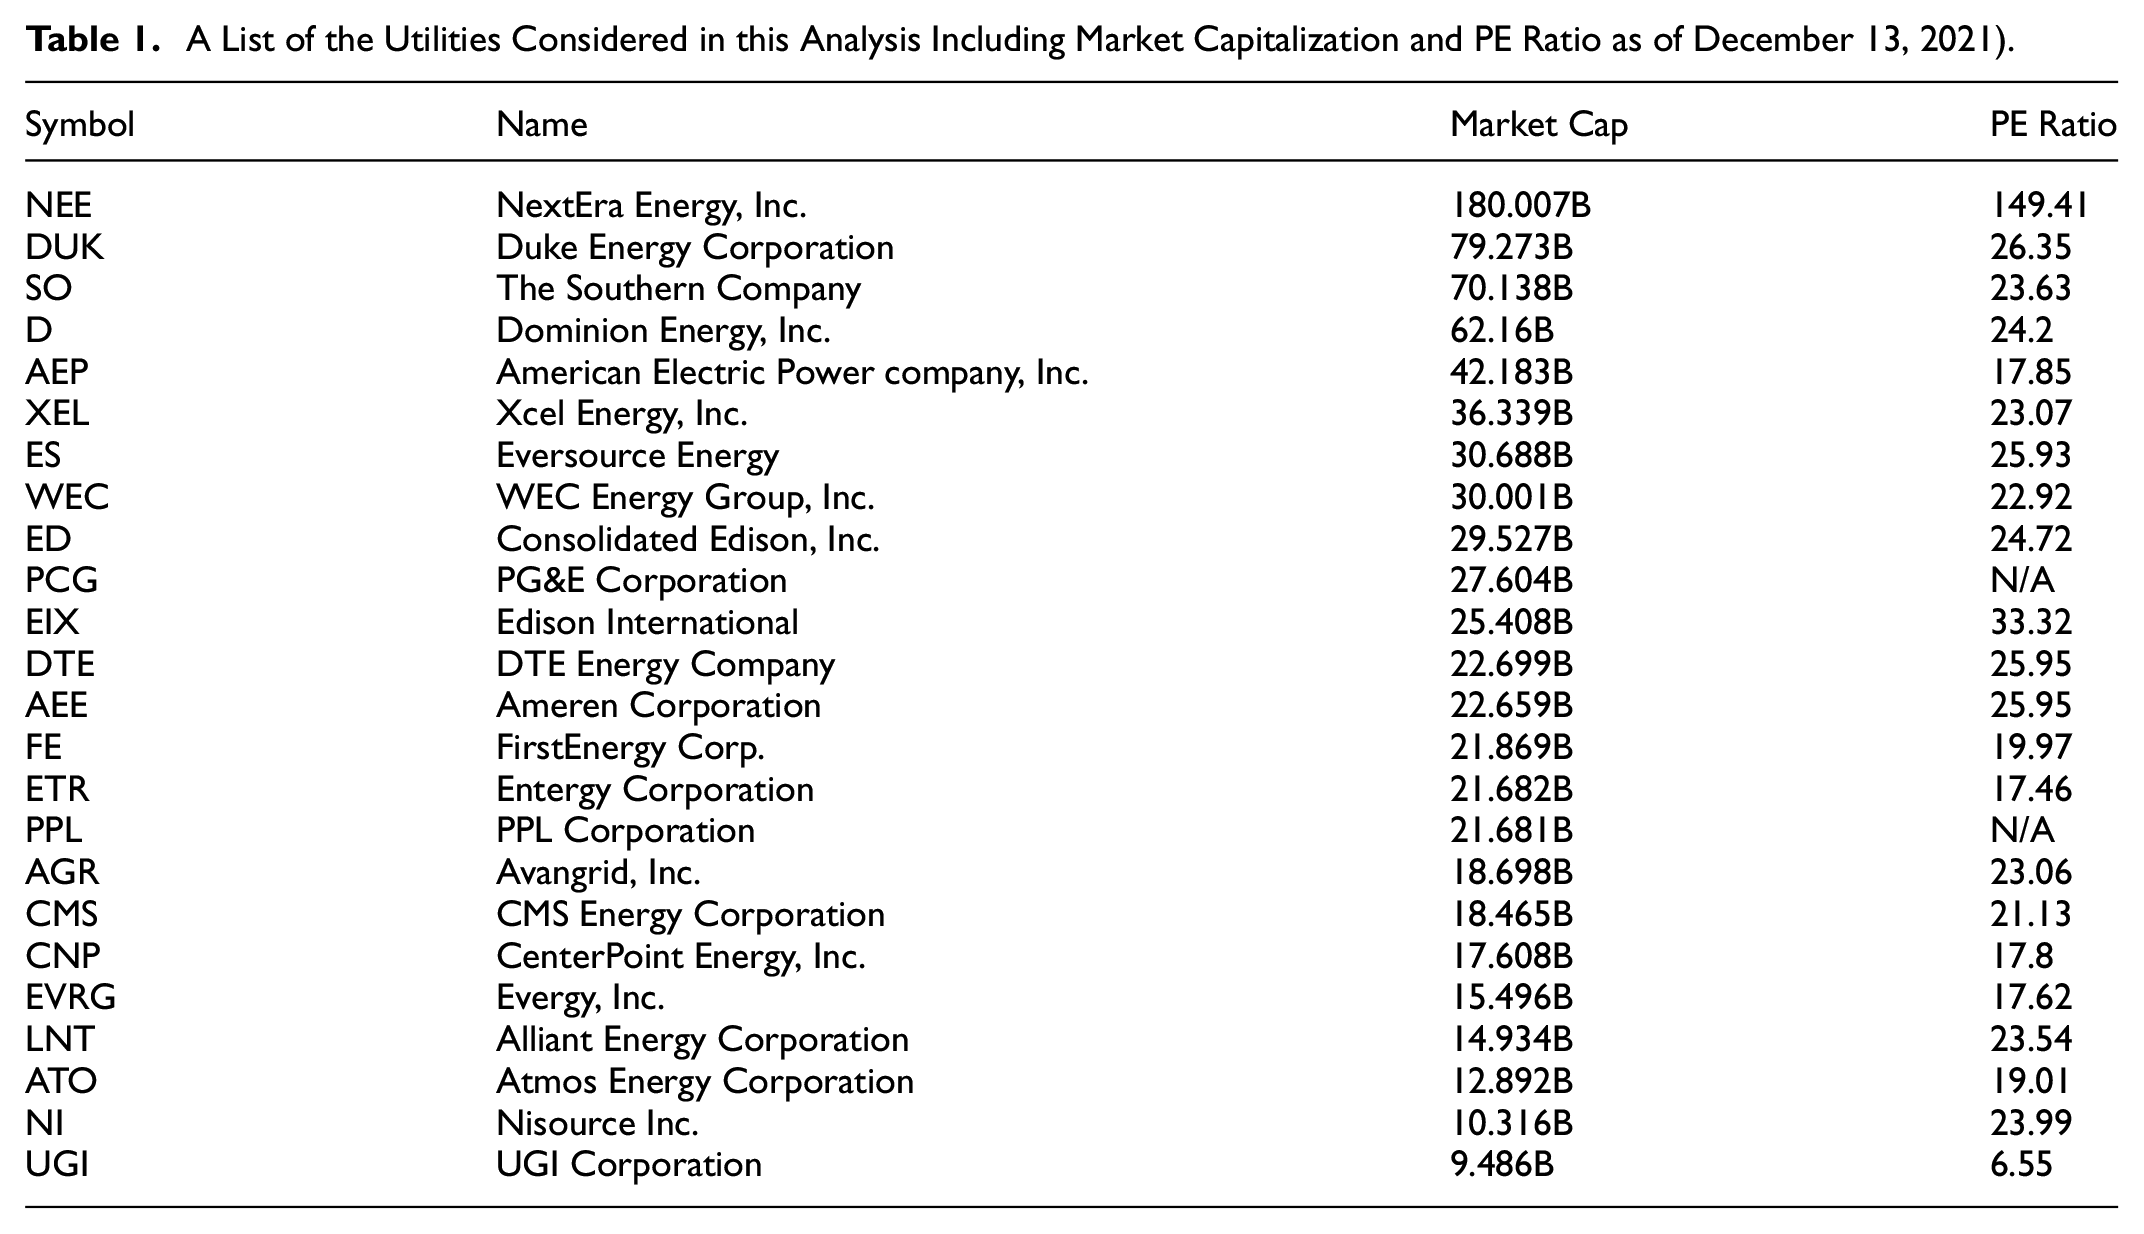
Across the utilities under consideration in 2020, CEO total compensation equated out to $10.9 million on average with a $10.47 million median compensation. In 2020, Nextera Energy paid its CEO at the highest level at $23.7 million compared to $1.78 million for AGR. The following table (Figure 2) compares CEO compensation in 2020 v. the performance of the stock over the last 5 years. Notable performance measures consider Nextera Energy on the high end and Pacific Gas and Electric on the low end. The average pay over 3 years for CEOs was $10,865,845 and $10,814,796 for 5 years. During this five-year time period, CEO saw pay increases of 15.20% on average, with that ranging from −81.52% to 135.72%. These pay increases outpaced the United States Consumer Price index of 10% over this same time period (CPI Calculator, 2020).
CEO compensation v. stock performance over 5 years.
Chief executive officers (CEO) representing these utilities were on average 58 years old as of 2020. The youngest CEO was 46 years old at CMS with the oldest at 67 CEO at CNP. As of 2020, most CEOs had been on the job an average of 4.5 years. The tenure on the job ranged from 1 year (i.e., Edison) to 11 years at Southern Company. The executives mentioned in each company’s respective proxy statement overwhelmingly were male. In 2020, a correlation analysis examination of CEO total compensation as compared to CEO age revealed a relatively strong correlation at 0.469 with a statistically significant p-value calculated at .027 (alpha < .05). In other, words, there seems to be a general positive trend between the age of the CEO and the compensation.
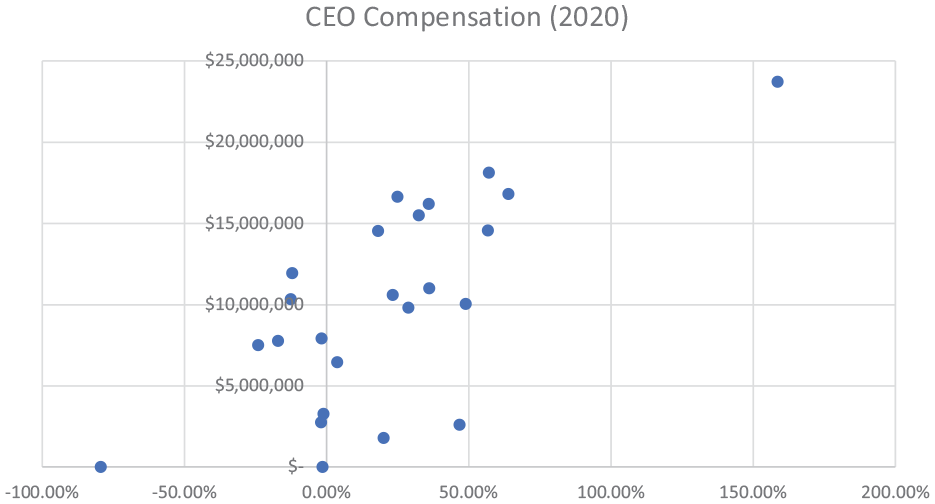
Examining this further, we looked at the CEO tenure on the job as compared to the CEO age. This revealed a positive correlation at 0.475 with a statistically significant p-value calculated at .025. Intuitively, this made sense that a CEO likely would stay on if performance was being achieved or exceeding respective benchmarks. Still, a 0.475 correlation coefficient suggests that this relationship is not as strong as investors may likely hope in that compensation performance normatively should be based on stock performance. The following graph illustrates the gender make up across each of these companies. In 2016, 87% of males made up the top leadership positions, in 2020, this total dropped to 84%, largely the same percentage over this time period. See Figure 3 for a gender leadership breakdown.
Gender breakdown for leadership positions per company proxy statements.
In fact, only one female occupied the top position at the at Duke Energy in 2020. The educational breakdown for the CEOs came included a variety of educational obtainment.
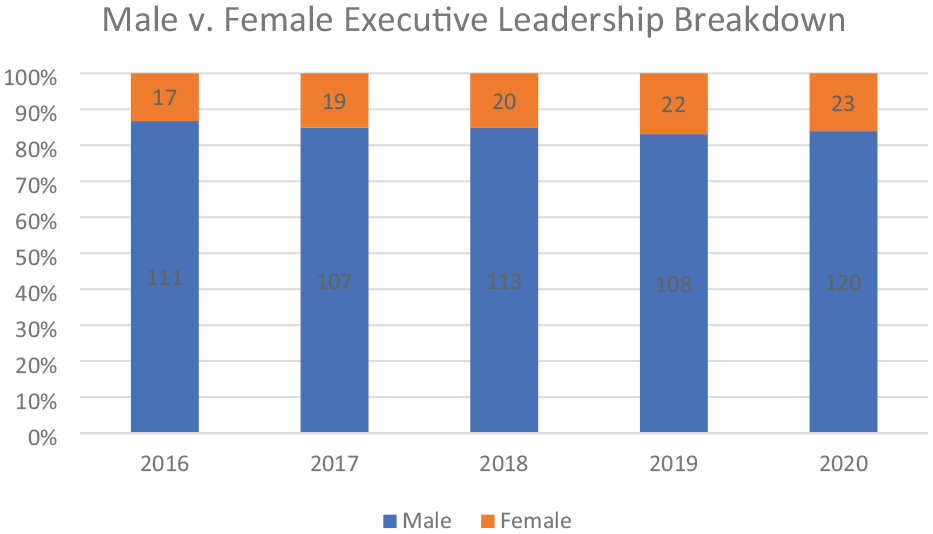
As shown in Figure 4, the majority of CEOs achieved at least a master’s degree or higher (58%). In 2020, 38% (nine) of the utilities split the chairman and the CEO role. Earlier, in 2016, four companies split the chairman and CEO role whereas 19 companies had the same person fulfill both roles.
Educational obtainment breakdown for CEOs in 2020.
We next examined the CEO age in 2020 compared to the stock performance at the past 5-, 3-, and 1-year intervals. We found a correlation coefficient of 0.06 over 5-years (p-value: .756), −.03 over three-years (p-value: .861), and .09 over 1-year (p-value: .687). Given the small calculated correlation coefficient the p-values all showed a statistically insignificant relationship.
We also studied the tenure of the CEO on the job in 2020 as compared to the stock performance of the company for the 5-, 3-, and 1-year intervals. We calculated a correlation coefficient of .409 for 5years (p-value: .002), .452 for 3-years (p-value .027), and .347 for 1 year (p-value: .097). These all were statistically significant with p-values less than alpha of .05.
An analysis of 5-year stock performance compared to CEO pay in 2020 revealed a 0.65 correlation. This relationship was statistically significant with a p-value of .0006. A correlation examining CEO pay in 2020 v. 3-year stock performance witnessed a correlation of .72. The corresponding p-value for this relationship is 7.64E-05 being statistically significant. A correlation examining CEO pay in 2020 v. a 1-year stock performance showed a .66 correlation, this was also statistically significant with p-value .000395.
An analysis of stock performance as compared to the year over year percentage increase in CEO pay revealed an average 15% pay increase for CEOs versus an average 21% stock performance increase over 5 years. The CEO pay average increase totaled for 3 years 23% versus 8% average increase in stock price. For 1-year, the CEO average pay increased dropped 4% compared to an 8% average decline in the stock performance. Extending out this relationship, we calculated the correlation coefficient of 0.333 for 5 years (p-value .742), .287 for 3 years (p-value: .777), and 0.320 for 1 year (p-value .752). However, each of these relationships were found to be statistically insignificant given that the p-values all exceeded .05.
Considering that the magnitude of these organizations mattered, we examined the relationship between CEO compensation and total assets, total income, and market capitalization. We looked at these for 2020, the correlation for CEO compensation in 2020 v. total assets in 2020 is 0.483, it is with p-value of .017. This proved to be statistically significant. The correlation for CEO compensation in 2020 v. total income in 2020 is 0.536, it is with p-value of .007. This proved to be statistically significant. The correlation for CEO compensation in 2020 v. market capitalization in 2020 is 0.631, it is with p-value of .0009. This proved to be statistically significant.
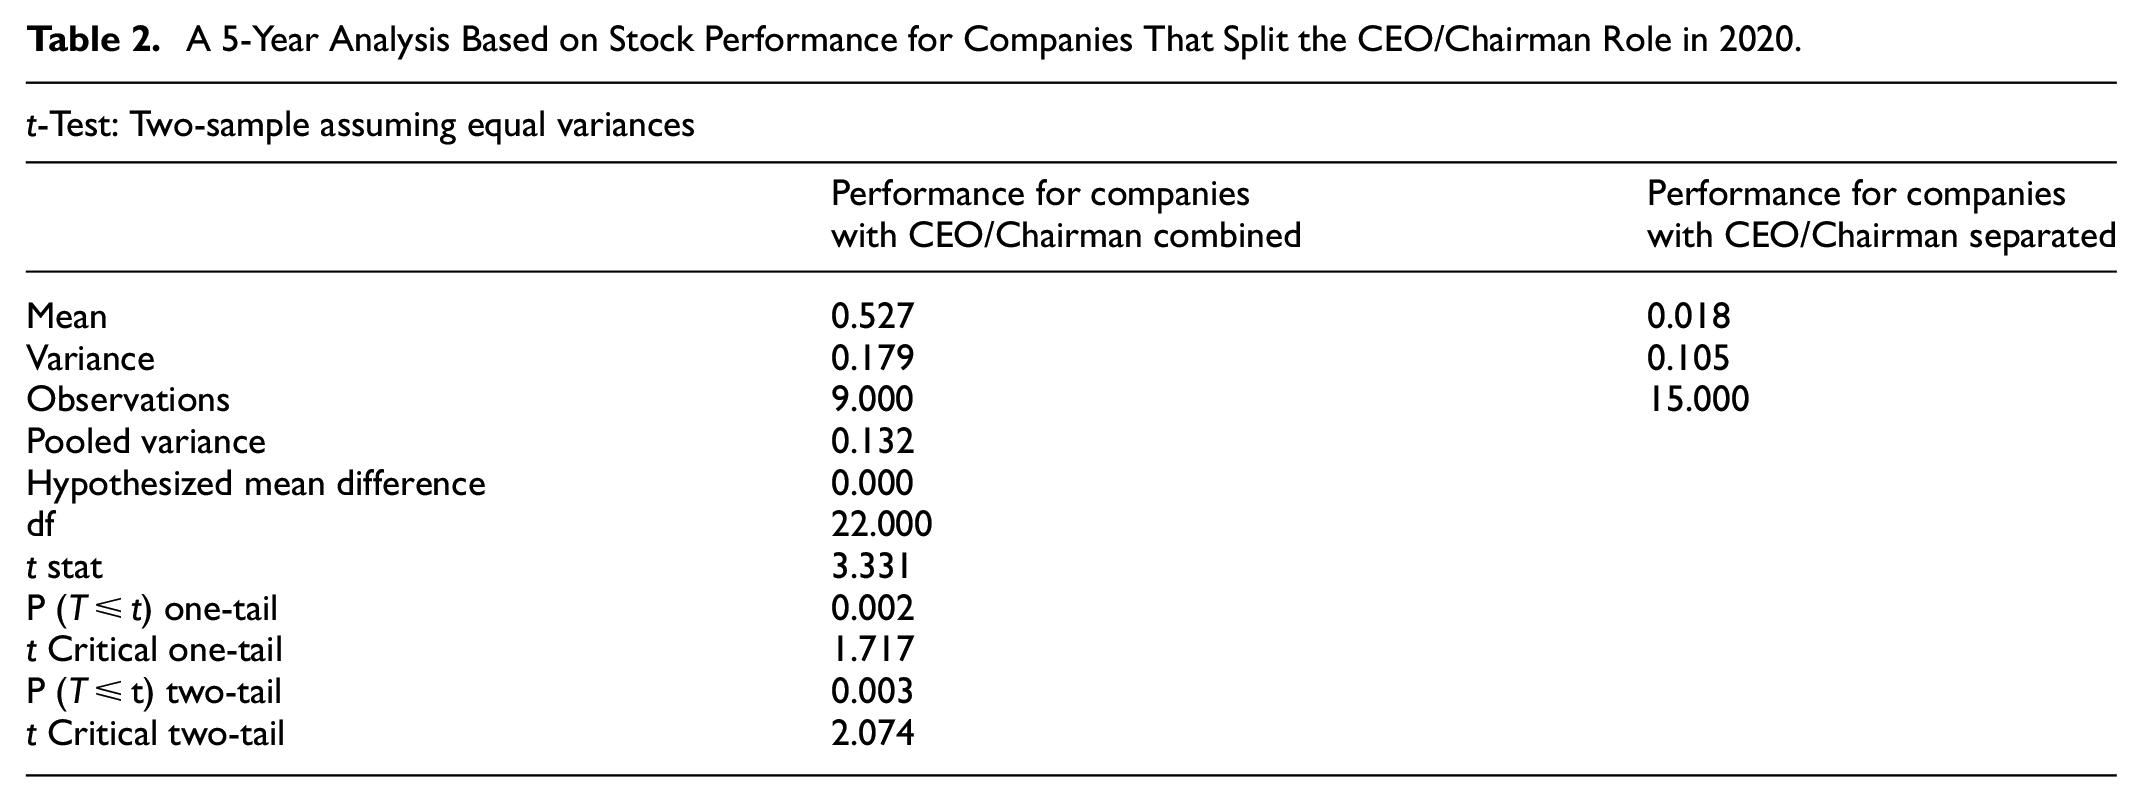
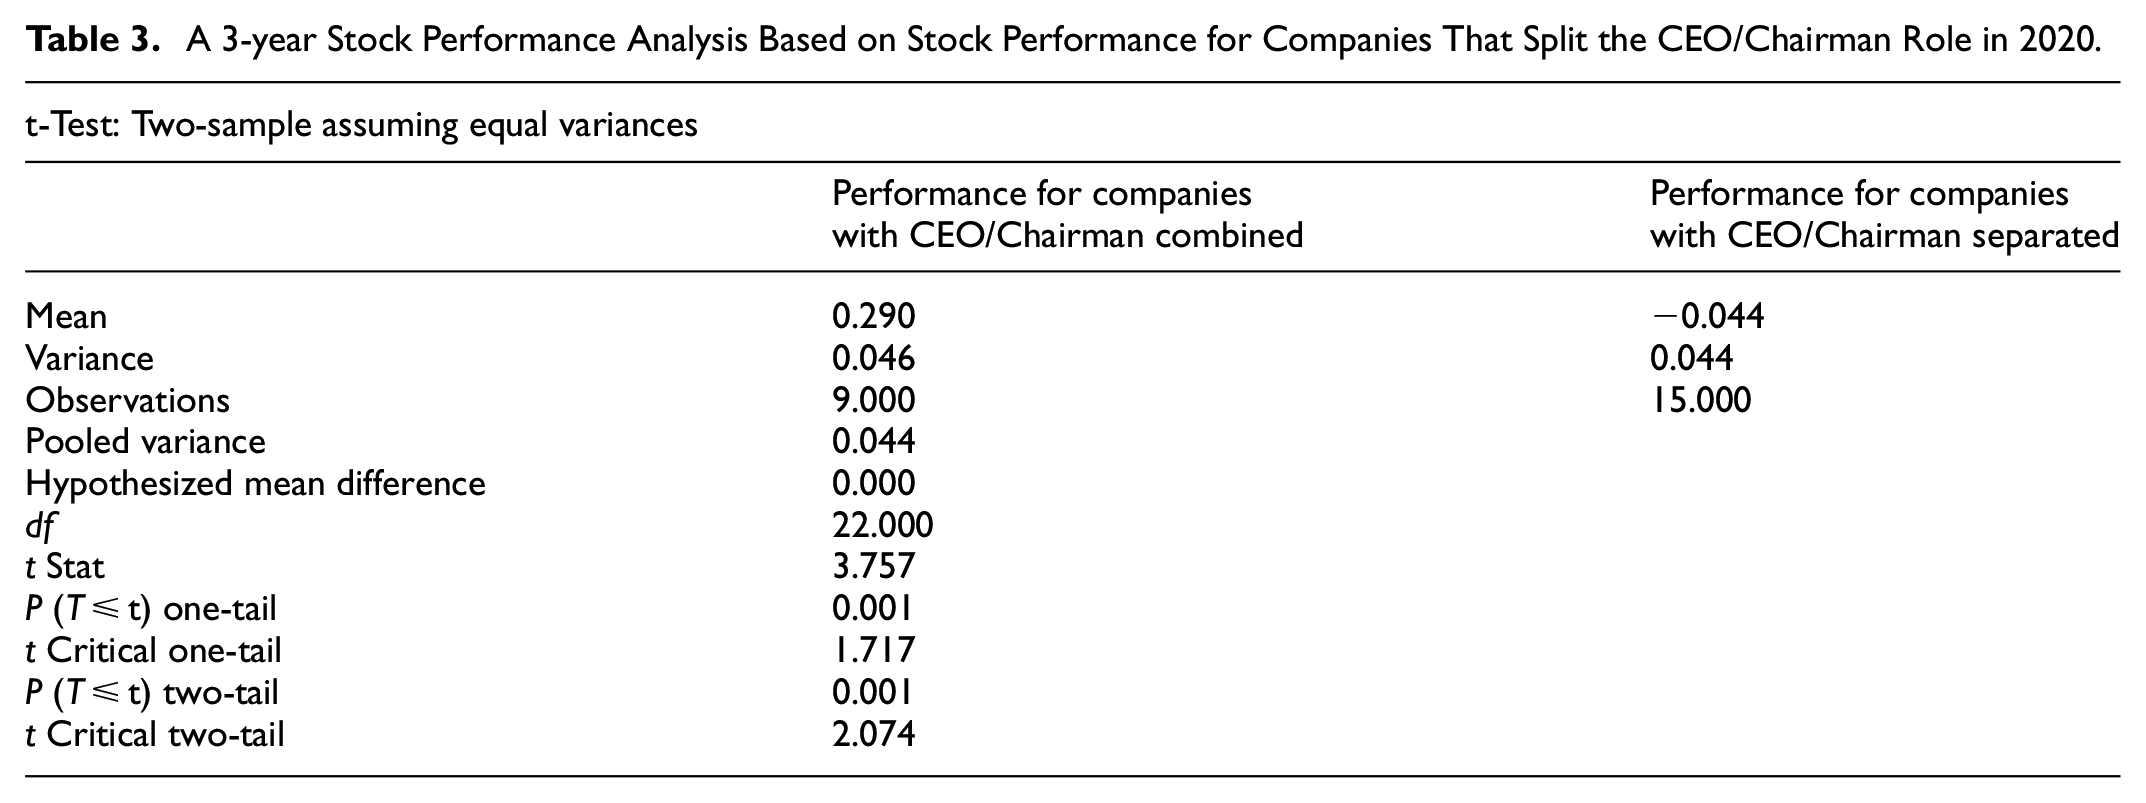
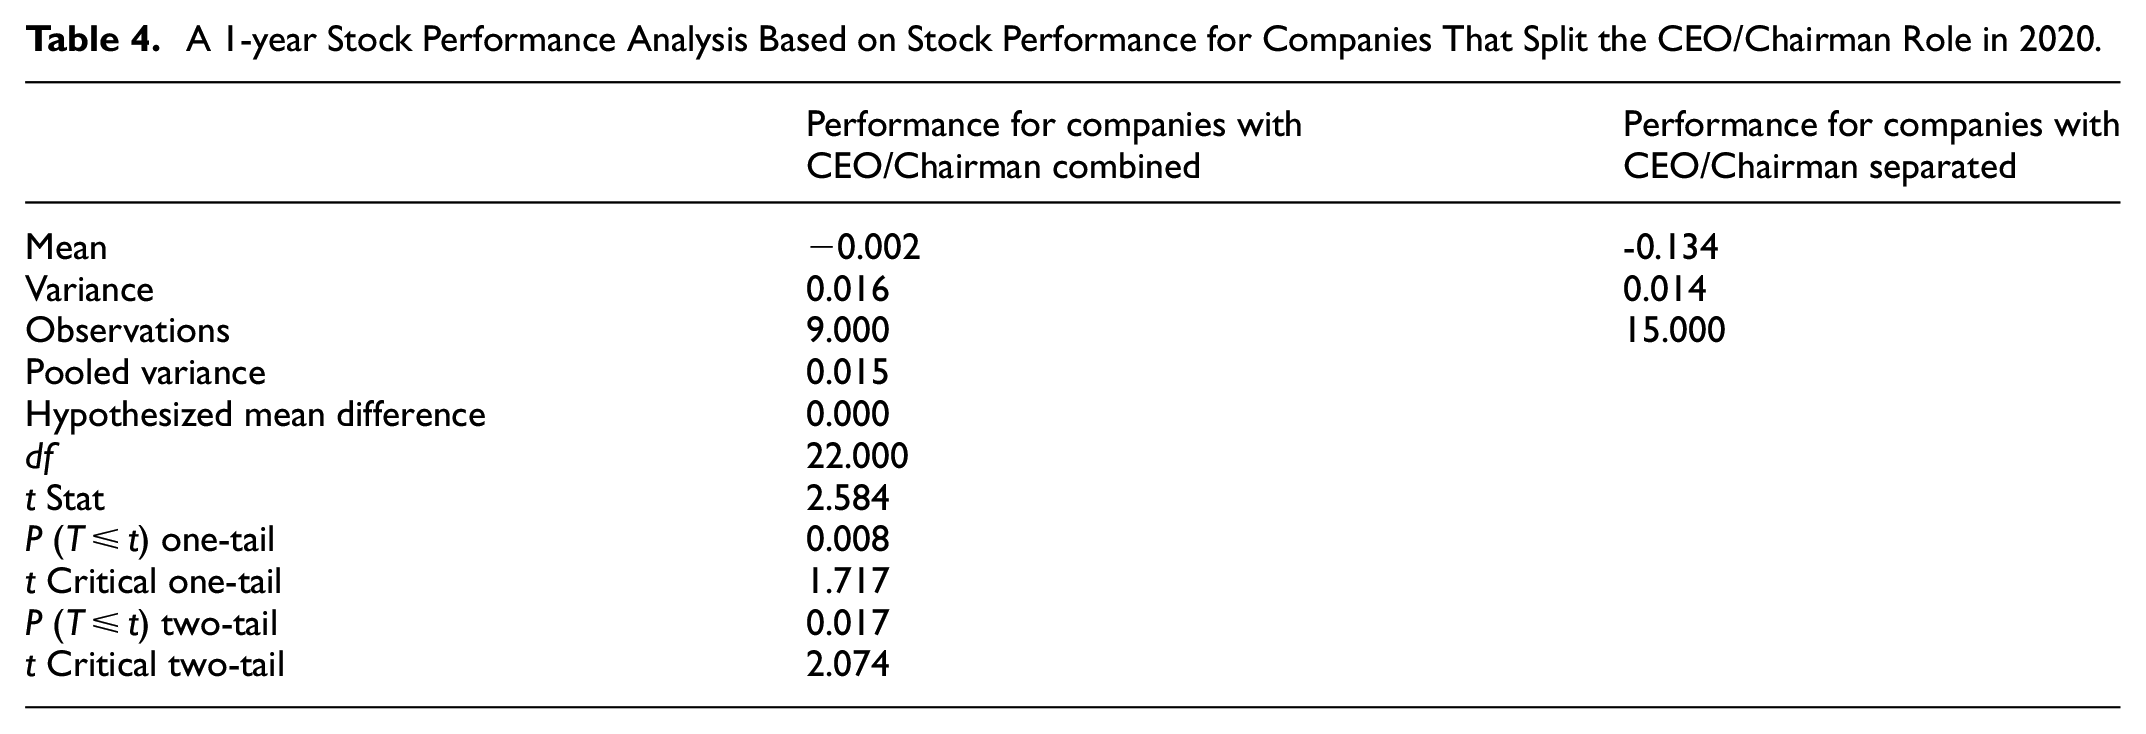
Considering advances by investor activists for separating out the chairman role with the CEO, we looked at the performance of companies over one, three, and 5 years based on this separation distinction in 2020 and in 2016. We ran a t-test to perform this analysis. Tables 2 to 4 show performance over these respective time periods.
A 5-Year Analysis Based on Stock Performance for Companies That Split the CEO/Chairman Role in 2020.
A 3-year Stock Performance Analysis Based on Stock Performance for Companies That Split the CEO/Chairman Role in 2020.
A 1-year Stock Performance Analysis Based on Stock Performance for Companies That Split the CEO/Chairman Role in 2020.
As shown in the preceding Table 2, based on the performance over 5-years, we found that companies that combined the CEO/chairman role to see better performance than companies that separated out the CEO/chairman role. This was statistically significant with a p-value of .003.
As shown in the preceding Table 3, based on the on the performance over 3 years, we found companies that combined the CEO/chairman role to see better performance than companies that separated out the CEO/chairman role. This was statistically significant with a p-value of .001.
As shown in the preceding Table 4, based on the on the performance over 1 year, we found that companies that combined the CEO/chairman role enjoyed better performance than companies that separated out the CEO/chairman role. This was statistically significant with a p-value of .02. Notably, we observed performance to be superior over each time period for the organizations that combined the CEO/Chairman role.
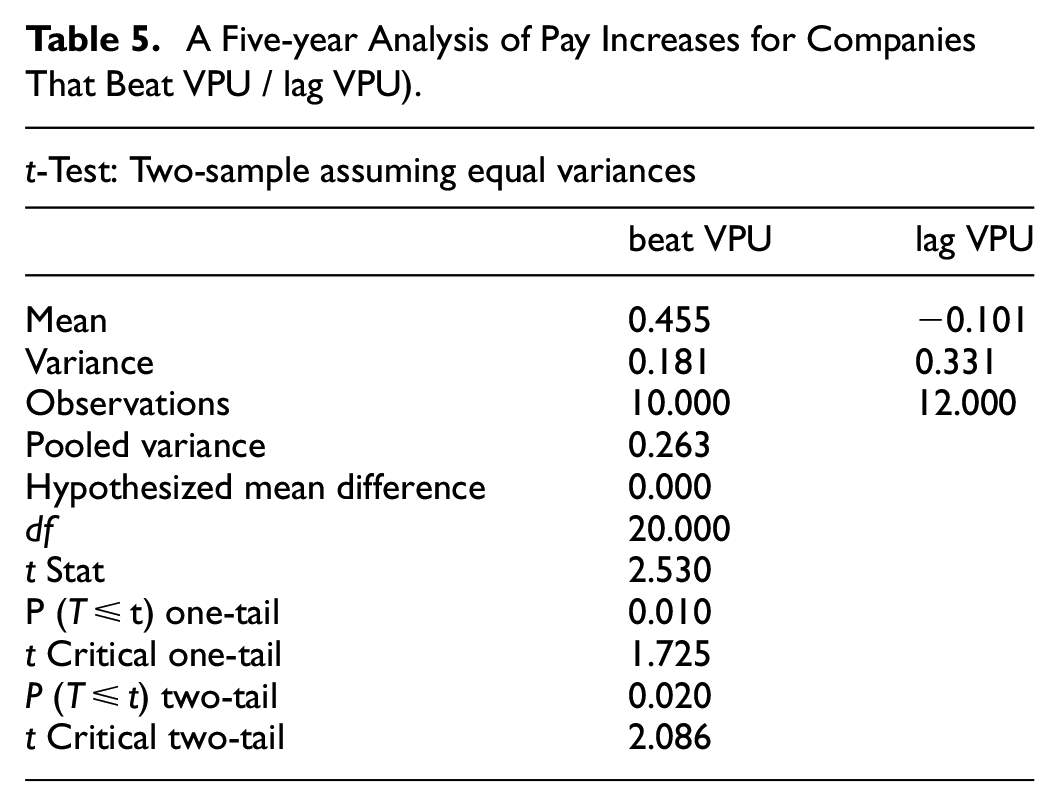
Subsequently, we studied the average pay increases for those organizations that beat the VPU index compared to those that lagged the index. We calculated t-tests for evaluation based on 5, 3, and 1 year (Tables 5–7).
A Five-year Analysis of Pay Increases for Companies That Beat VPU / lag VPU).
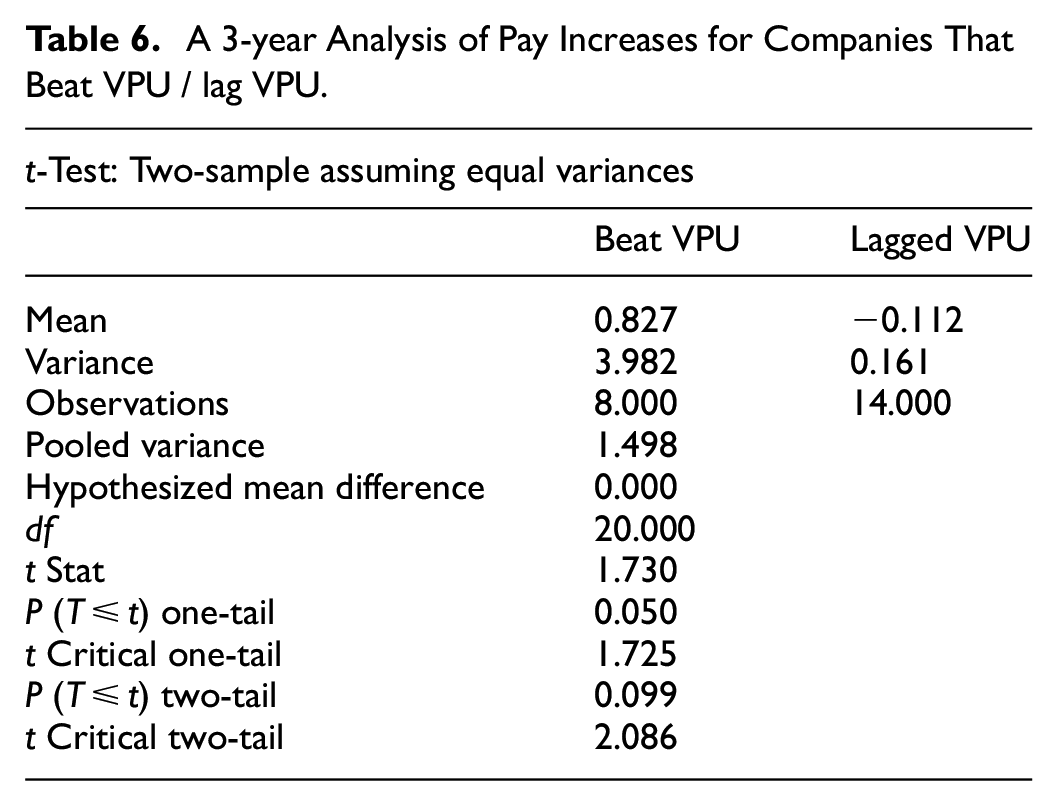
A 3-year Analysis of Pay Increases for Companies That Beat VPU / lag VPU.
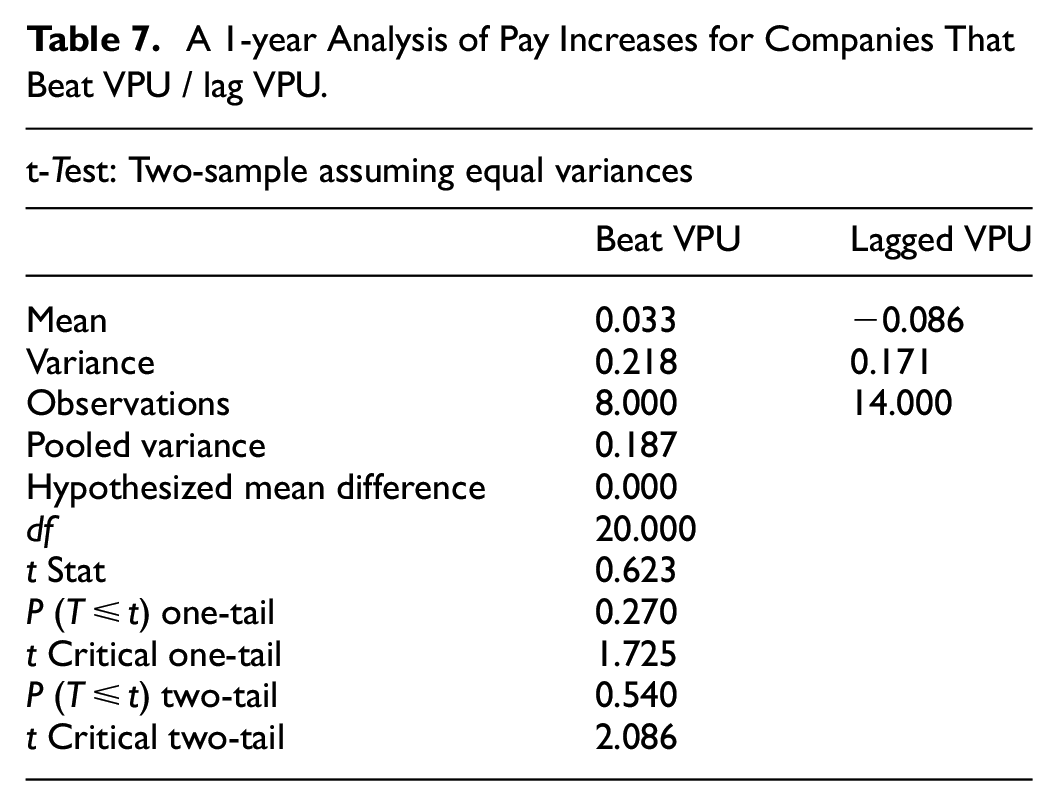
A 1-year Analysis of Pay Increases for Companies That Beat VPU / lag VPU.
Over 5 years, 10 utilities beat the VPU index, whereas 12 utilities lagged the index. The utilities that beat the VPU index saw an average pay increase of 45% whereas those that lagged the VPU saw an average pay decrease of 26%. This distinction was statistically significant with a p-value of .02.
Over 3 years, eight utilities beat the VPU index, whereas 14 utilities lagged the index. The utilities that beat the VPU index saw an average pay increase of 83% whereas those that lagged the VPU saw an average pay decrease of 11%. This distinction was not statistically significant with a p-value of .09.
Over 1-year, 9 1 utilities beat the VPU index, whereas 13 utilities lagged the index. The utilities that beat the VPU index saw an average pay increase of 3% whereas those that lagged the VPU saw an average pay decrease of 8%. This distinction was not statistically significant with a p-value of 1.99E-05. Across the time periods studied, companies that beat the VPU at a 5-year increment saw higher total compensation increases than those that lagged the VPU index. However, that finding did not prove significant for the 3 or 1-year increment. This 5-year observation should not be considered all that surprising given that non-cash executive compensation in all organizations consisted of stock options and/or grants awarded to executives.
Conclusion and Implications
Our findings confirmed a positive relationship between stock performance and utility CEO total compensation from 2016 to 2020. This relationship provides valuable empirical evidence on CEO pay. We observed that relationship consistently over each time frame observed in this analysis (5, 3, and 1 year). Overall, findings reveal that CEO total compensation and stock performance tends to coincide. The pay magnitude of CEOs in this industry corroborates with Bryan and Hwang (Bryan & Hwang, 1997) with lower total CEO compensation than other industries during this time. For performance, Nextera Energy performed the best during our studied timeframe (2016–2020), with the highest CEO compensation as well as the greatest stock increase during this time (158%). On the other hand, Pacific Gas and Electric declared bankruptcy during this time period with shareholders losing considerable, however, relatively speaking, executives were still paid handsomely in this time period. Based on the analysis with proper regulations we find that ensure there is no agency problem in a company, the higher CEO compensation, the company tend to have a better performance in a given period.
We found no statistically significant relationship between the CEO’s age and the utility’s corresponding stock performance. Conversely, we observed as CEO tenure increased so did the stock performance. As CEO tenure increased, our data revealed positive correlation with ongoing stock performance. Stock performance also correlated positively with the average CEO pay. Also, we observed that total CEO compensation in 2020 compared to total assets, income, and market capitalization was positively correlated. In that regard, the higher the CEO compensation, we tended to see higher total corporate assets, net income, and firm market capitalization. Our observation revealed that companies that held the chairman and CEO role with one individual tended to see better performance. Finally, we found significant differences between the pay increase percentages of CEOs as compared to those that outperformed the VPU index over each time frame observed (5, 3, and 1 year).
Utility stock performance outpaced CEO executive increases during this period. Illustratively, during this time, utilities saw a 20.9% stock increase and a 15.2% CEO pay increase. Nonetheless, that observation likely will not provide the ultimate solace to those concerned about income inequality. Still, a 15.2% increase in total compensation exceeded broader measures of cost of living such as the US CPI standing at 10%. Still, the utility industry consists of tighter pay gaps than the broader market.
Our analysis identifies the relationships between stock performance and CEO compensation among other considerations. Some executives received sizable increases whereas the share performance still seemed to lag the utility index or broader S&P index. The utility industry largely failed to meet or exceed the broader market as measured via the U.S. S&P 500 index during this time period.
We feel that identifying the relationships between these variables can help practitioners, scholars, and academics better understand this important dynamic. As in all historical research, our work may suffer from survival bias. Nonetheless, given the nature of these entities, many of them are built to survive although there are merger and acquisitions activities within the space. Our research also suffers from internal validity and generalizability concerns.
Given these important findings, we recommend additional analysis with similar statistical techniques be explored for additional industries beyond U.S. large cap utilities. We also recommend a future study on utility stock performance as compared to CEO pay for varying different time horizons that our study did not cover. We recommend a comprehensive look at other factors beyond CEO total compensation to better understand the inputs and variables making up shareholder performance. We speculate further value to investigate diversity in leadership and stock performance which this industry at this time did not lend itself well to represent. We recommend future study on that valuable topic.