
Abstract
Previous frequentist research exploring the Solow growth model and its MRW specification has grappled with persistent challenges such as multicollinearity and reverse causality inherent in neoclassical growth models. This study aims to showcase the Bayesian approach’s advantages in determining whether the Solow or MRW model better explains income variations across advanced countries. To this end, we apply a hybrid Metropolis-Hastings algorithm within the Bayesian non-linear framework to a panel of 38 advanced countries from 1970 to 2019. The results yield significant insights: Firstly, by integrating informative priors that capture prior beliefs on variable interactions, Bayesian inference effectively addresses potential multicollinearity and reverse causation. Secondly, Bayesian estimation introduces valuable shrinkage effects that enhance estimation accuracy. When subject to Bayesian shrinkage, broad capital elasticities more closely align with true values, highlighting the influence of technological advancement and latent factors often overlooked by traditional observation. Lastly, our analysis reveals that the augmented MRW model, accounting for heterogeneous technology growth and depreciation rates, is the best fit. This study provides a reliable empirical foundation for shaping comprehensive policies aimed at fostering sustained economic growth through technological progress alongside the accumulation of physical and human capital.
Plain language summary
Applying frequentist methods to estimating the Solow growth model and its MRW specifications in advanced countries has brought in reliable results due to multicollinearity and reverse causality. Hence, Bayesian methods are a promising alternative approach in addressing these issues thanks to their ability to code the interactions between variables by incorporating specific informative prior knowledge about crucial coefficients into a growth model. The study applied a non-linear Bayesian regression to the Solow model, original and modified MRW specifications to a panel sample of 38 advanced countries and provided the following results: Firstly, the study shows the Bayesian approach’s advantages in dealing with data quality issues like the high correlation between explanatory variables and the reverse impact of the dependent variable on certain explanatory variables. Secondly, the Bayesian approach allows the true values for physical and human capital elasticities to be obtained. Thirdly, the augmented MRW model incorporating country-specific technology and depreciation rates that we proposed obtains the highest explanatory power in depicting the growth realm in advanced economies. The study results serve as a reliable and robust empirical foundation for designing effective growth policies.
Introduction
To defend Solow (1956)’s “textbook” growth model against the attacks of endogenous growth theories, the 1992 landmark paper authored by Gregory Mankiw, David Romer, and David Weil commences with the resounding assertion, “This paper takes Robert Solow seriously.”Mankiw et al. (1992), hereafter referred to as MRW, embarked on an empirical exploration of the Solow textbook model. Central to MRW’s approach was the critical importance of correctly specifying the canonical Solow (1956) growth model and rigorously testing its predictions. Utilizing the Penn World Tables—a comprehensive cross-country dataset meticulously curated by Summers and Heston (1988)—which encompassed the period from 1960 to 1985, this empirical analysis was conducted through Ordinary Least Squares (OLS) regression models to three distinct subsamples: non-oil countries (98), intermediate economies (75), and the exclusive group of 22 OECD countries. While the first two subsamples exhibited satisfactory outcomes, yielding an R-squared value of .59, the results for OECD countries were far from satisfactory, reflected by an R-squared as low as 0.01. The findings notably revealed that Solow’s model demonstrated an impressive capability to elucidate more than half of the cross-country variability in income per capita—albeit except for a subset of OECD economies. In response, MRW suggested an augmented version of the Solow model incorporating human capital to counteract omitted variable bias. Although this augmentation enhanced the Solow model’s fit across various samples, the results for OECD countries remained constrained. The constraint emanated from the assumption of homogeneous technology level and growth rate across nations, which ultimately limited the model’s capacity to expound upon the observed variations in economic growth (Felipe & McCombie, 2005). This assumption of uniform technology introduced the potential for omitted variable bias and constrained the model’s explanatory power, ultimately leading to heterogeneous empirical outcomes. Having critiqued the Solow model and its MRW specification for its susceptibility to omitted variable bias, subsequent explorations (Islam, 1995; Jorgenson, 1995; Prescott, 1998, among others) have aimed to improve the MRW model by introducing a variety of relevant variables. A key avenue of augmentation has been manipulating technology levels and growth rates, undertaken by various authors (Abu-Qarn, 2019; Felipe & McCombie, 2005; Islam, 1995; Lee et al., 1997, among others). Despite the inclusion of heterogeneous technology variables in these augmented models to enhance their explanatory power, economic theory raises concerns regarding the intricate correlations among explanatory variables, which could introduce multicollinearity and obscure the independent effects of each factor—specifically, the associations between human capital and technological progress and physical capital and technological progress. These intricacies impose formidable hurdles for the frequentist methodologies. The interplay between human capital and other production factors introduces complexities influenced by endogeneity. Specifically, the symbiotic relationship between high technology and investments in human capital reinforces each other, amplifying the intricacy of the relationship. The advancement of technology often hinges on human capital, as skilled labor propels increased efficiency and facilitates the assimilation of novel technologies, consequently bolstering total factor productivity (TFP). Simultaneously, heightened investments in physical capital can instigate the adoption of innovative technologies and practices, fostering accelerated technological growth. This symbiotic bond becomes apparent when countries or industries earnestly engage in improving production methodologies and infrastructure. Furthermore, scenarios involving reverse causality may arise, wherein accelerated technological growth drives increased investment as firms and industries endeavor to adopt advanced technologies to maintain a competitive edge. The potential for reverse causality, characterized by bidirectional interactions between income and broad capital, poses a significant challenge in the field of growth econometrics (Caselli et al., 1996). When new variables are introduced, the risk of multicollinearity and reverse causality is exacerbated, potentially distorting estimation outcomes within the frequentist paradigm. As a consequence, the utilization of frequentist methods in growth investigations has generated divergent and occasionally conflicting results. The resulting lack of conclusive outcomes complicates the design of appropriate growth policies.
To address the mentioned complexities, this study utilizes a Bayesian non-linear approach, harnessing a hybrid Metropolis-Hastings (MH) algorithm to assess which model—Solow, original MRW, or MRW augmented with country-specific technology and depreciation rates—best explains cross-country income variance among advanced economies as per the IMF’s country classification. The research offers several key contributions. Firstly, methodologically, it enhances the Bayesian non-linear approach by employing accurately specified informative prior distributions for critical model parameters, such as investments in physical and human capital. This strategic utilization of priors is pivotal in addressing statistical complexities. Furthermore, the study refines the Solow growth model by incorporating time-varying, heterogeneous rates of capital depreciation and technological progress, enabling a more detailed understanding of the complex interactions among technology, physical capital, and human capital in the growth process. Finally, these methodological advancements yield robust Bayesian results, confirming that, among the Solow and MRW specifications analyzed, the MRW model augmented with heterogeneous technology and depreciation rates provides the best fit. The findings underscore the importance of a rigorously developed Bayesian framework, offering a solid empirical basis for informed decision-making in the domain of economic growth for advanced economies.
Empirical Literature Review
The seminal work by Mankiw et al. (1992) occupies a significant position within the field, reigniting interest in the canonical Solow growth model. Their study illuminated the necessity of accurately configuring and rigorously assessing Solow’s model. Their exploration demonstrated that the model’s explanatory power extended beyond half of the cross-country variance in income per capita, except for OECD economies. As mentioned above, while they achieved commendable results for the first subsets, non-oil countries (98) and intermediate (75), yielding an R-squared of 0.59, the performance deteriorated notably for the 22 OECD nations. In this context, even the coefficient estimate of ln(n + 0.05) presented insignificantly negative, and the R-squared plummeted to a mere 0.01. An additional limitation of their study pertains to an inflated capital elasticity (alpha = 0.6). MRW’s work engendered scrutiny from various researchers (Abu-Qarn, 2019; Acemoglu, 2009; Islam, 1995, 1998; Lee et al., 1997, among others), who pinpointed two key identifying assumptions that underpin their investigation. Firstly, despite acknowledging potential variations in initial technology, resources, and institutional factors among countries, MRW treated these divergences as constants, relegating them to error terms in their regressions. This methodological approach substantially elevated the likelihood of variable bias being omitted and pervading their results (Islam, 1995). A plausible correlation emerged between the error term encompassing country-specific elements and the explanatory variables—population growth, savings, and education. Secondly, MRW assumed uniform capital depreciation rates and Harrod-neutral technological progress across all countries. This entailed a specific technology growth rate of 0.02 and a depreciation rate of 0.03—figures roughly mirrored those of the United States. These assumptions have cast a shadow of skepticism over the precision and reliability of MRW’s findings.
Subsequent empirical investigations stemming from the MRW model have branched into three directions. The first avenue of study aims to augment the growth model with additional relevant variables. Researchers have extended the Solow growth model by incorporating factors unaddressed by MRW. Knowles and Owen (1995) introduced the concept of health capital, utilizing life expectancy as a proxy. Their work unearthed a robust connection between economic growth and health capital, shedding light on previously unexplored dynamics. Nonneman and Vanhoudt (1996) extended the model by incorporating technological know-how, represented by research and development (R&D) expenditures. This augmented model exhibited a favorable fit within the OECD sample, although it failed to demonstrate a significant impact of human capital on convergence. Park and Brat (1996) delved even deeper into the realm of R&D, uncovering spillover effects. Their analysis successfully accounted for a substantial portion of the income per capita variation observed within the OECD sample. Some other researchers included the quality of human capital in their models. For instance, in the study by Hanushek and Kimko (2000), cognitive skills assessed through standardized test scores are employed as a proxy to gage the quality of human capital. Analyzing data from 80 countries spanning 1960 to 1990 and focusing on average years of schooling along with math and science test scores, the study revealed that an increase of one standard deviation in mathematics and science skills is associated with a growth of more than one percentage point in average yearly GDP growth. Furthermore, the model’s goodness-of-fit substantially improves, with the coefficient of determination increasing from 0.33 to 0.73. Another notable contribution is by Ram (2007), who investigates human capital quality within the framework proposed by Knowles and Owen (1995). Using a sample encompassing 98 countries from 1960 to 1985, incorporating secondary school enrollment rates and national IQ test scores, the study’s results demonstrate a positive relationship between the quality variable and per capita income growth rate. Intriguingly, the impact of health and the quantity of education diminishes and becomes statistically insignificant. Expanding upon this line of research, Cooray (2009) introduces additional variables to the model, such as the financial sector and net secondary enrollment ratio. Using a sample of 35 economies covering 1992 to 2003, the research discovers a statistically significant positive impact of human capital on economic growth, with elasticity ranging from 0.22 to 0.32. In a more recent study, Neycheva (2019) delves into the impact of higher education on growth in 11 new EU member states between 2000 and 2016. Adopting an augmented MRW-type model that considers education quality and vertical mismatch, the study investigated whether the growing number of college graduates results in an oversupply of educated labor, subsequently leading to qualification mismatch and hampering per capita income growth, and concluded that a surge in the highly educated labor force alone does not necessarily lead to higher growth rates. The impact of human capital on growth becomes positive and statistically significant only when graduates working in occupations requiring tertiary education are integrated into the model.
While the above analyses shed light on the determinants of growth dynamics, another challenge led to proposals questioning the validity of the assumption of uniform technology across countries. Jorgenson (1995) challenged the premise of identical technologies inherent in the neoclassical growth models. The ensuing discussion highlighted concerns that assuming homogeneous technology might introduce a bias, resulting in omitted variables in the regression outcomes (Islam, 1995). Prescott’s endorsement in 1998 highlighted the limited significance of differences in savings rates compared to TFP, thus emphasizing the importance of exploring the theory of TFP. Subsequently, a wave of studies (Abu-Qarn, 2019; Felipe & McCombie, 2005; Islam, 1995; Lee et al., 1997, among others) ventured into allowing variations in technology levels and growth rates across countries within the growth model. Some researchers aimed to address the initial technology level using panel data techniques (Caselli et al., 1996; Islam, 1995; Knight et al., 1993; Loayza, 1994, and others). Knight et al. (1993) proposed that factors like international trade openness and government fixed investment influenced technology levels. Employing the Π matrix method, they revealed country-specific effects and faster convergence rates compared to MRW’s estimations. Loayza (1994) and Islam (1995) corroborated these findings, with Islam uncovering a lower-than-expected capital share in income. Endorsing a panel data framework, Islam noted that this approach’s advantage lay in accommodating variations in the aggregate production function across diverse economies, leading to significantly different outcomes than single cross-country regressions. In a different vein, Abu-Qarn (2019) employed the growth accounting method to quantify variations in TFP across countries. This study, exploring scenarios with and without human capital, identified substantial fluctuations in capital elasticities within the OECD subsample, ranging from 0.02 to 0.41. Under the assumption of constant TFP growth, the author pinned down capital elasticity within the range of 0.04 to 0.36 for the same OECD subsample. Additionally, Lee et al. (1997) and Felipe and McCombie (2005) took on a more complex task of simultaneously addressing technology level and growth. Lee et al. (1997) introduced a stochastic Solow model that accommodates country-specific levels, growth rates of variable A, and convergence speed. Conversely, Felipe and McCombie (2005) attributed their model’s explanatory power for OECD countries to its similarity with the income accounting identity. Accounting for the normative neoclassical assumptions, they computed and integrated differences in technical progress into the regression. Consequently, capital elasticity estimates varied from 0.37 to 0.38 for the textbook Solow model and from 0.40 to 0.41 for the Solow model enriched with technology level and growth rate variations across countries. Besides, some scholars opted to expand the temporal scope of growth regressions. Bernanke and Gürkaynak (2001), for instance, utilized a lengthier time frame—1960 to 1990 and 1960 to 1995—for three sample categories (no-oil, intermediate, and OECD), akin to Mankiw et al. (1992). Their findings indicated that MRW’s specification aligned broadly with various growth models, implying that the model’s success in fitting might not solely be attributed to Solow’s formulation. They highlighted the significance of employing more recent data and a more extensive investigation period, which ultimately led to the rejection of MRW’s parameter restrictions. Regarding capital elasticity estimates, the textbook Solow model exhibited a range of 0.5 to 0.6. For the augmented Solow model, estimates for physical and human capital elasticity varied significantly, ranging from −0.03 to 0.31 and 0.28 to 0.53, respectively. Milton et al. (2005) adopted a dynamic panel approach, employing a sample of 53 countries and spanning 1959 to 1989 with the textbook Solow model. Their endeavor yielded an estimate of the physical capital elasticity at approximately one-third. On a different front, Vinod and Kaushik (2007) delved into time series and panel regressions for data on 18 large developing countries during 1982 to 2001 and found that human capital elasticity exceeded unity for 13 of the 18 countries, and for two countries, it was less than zero. Additionally, the physical capital elasticity exhibited negative values for 9 of the 18 countries considered. Using data from Penn World Table version 6.1 extending the sample period to the year 2000, Canarella and Pollard (2011) demonstrated that the augmented Solow model’s ability to explain cross-country variation in income per capita within the OECD sample considerably increased; capital elasticity reached around 0.3 for the textbook Solow model, while physical and human capital estimates were 0.2 and 0.28, respectively, for the augmented Solow model.
The second strand of growth empirical research has been dedicated to unraveling the econometric issues inherent in MRW’s framework. Caselli et al. (1996) recognized the endogenous nature of independent variables and employed a dynamic panel data GMM estimator to tackle these complexities. Their approach yielded a notable convergence rate of 10%, surpassing the conventional 2% rate. Furthermore, S. N. Durlauf and Johnson (1995) introduced a classification algorithm known as a regression tree, facilitating the data-driven identification of various data regimes and the categorization of countries into distinct groups. Each group followed a shared statistical model, and their analysis illuminated significant variations in results. Consequently, they concluded that augmenting the explanatory power of the Solow growth model might require integration with a theory explaining the disparities in aggregate production (S. N. Durlauf & Johnson, 1995, p. 365). Similarly, Temple (1998) ventured into robust estimation methods to assess the validity of MRW’s model across diverse country groups. He contended that MRW’s model should showcase its explanatory capacity in developing and newly industrialized countries (NICs) and the OECD. However, upon omitting Portugal and Turkey from the OECD sample, his regression’s goodness of fit plunged from 0.35 to 0.02. Temple’s takeaway was that the augmented Solow model, in its existing state, held meager explanatory power within the most cohesive segment of the OECD (Temple, 1998, p. 366). Temple further partitioned the sample into quartiles, yielding regressions with still acceptable fits (ranging from 0.58 to 0.67). Nevertheless, there was substantial parameter variation in the estimated values. Maddala and Wu (2000) adopted an iterative Bayesian approach, explicitly utilizing a shrinkage estimator, to address the heterogeneity issue explored in panel data by Lee et al. (1997). They contended that their estimation method outperformed that of Lee et al. (1997) due to the latter’s approach needing total efficiency in the presence of lagged dependent variables.
Lastly, conventional growth econometrics encountered criticisms from other scholars, such as Easterly and Levine (2001) and Brock and Durlauf (2001). Easterly and Levine (2001) adopted a novel methodology to avoid the assumption of uniform technology levels across all countries. They introduced regional dummies to accommodate variations in the term A and challenged MRW’s assertion of uniform productivity among countries. Consequently, their study expanded beyond regression analysis, incorporating diverse evidence, including migration patterns between countries. S. Durlauf (2000) and Brock and Durlauf (2001) put forth critiques asserting that prevailing empirical practices in growth research lacked policy relevance. These scholars advocated for a more eclectic approach to empirical research, encompassing historical analyses and integrating decision-theoretic formulations to compute predictive distributions for policy outcomes. To operationalize this approach, Durlauf et al. turned to Bayesian methods. This strand of critique and innovation seeks to refine growth research methodologies, encouraging a deeper understanding of the relationship between economic growth and policy and advocating for approaches that offer statistical insights and policy-relevant and contextually meaningful outcomes.
Recognizing that conflicting empirical findings, often stemming from unresolved statistical challenges such as multicollinearity, potential reverse causality, or other methodological flaws, represents a significant research gap in the field of economic growth. For instance, while Felipe and McCombie (2005) identified an improvement in model explanatory power when incorporating variations in technology for a selection of OECD countries, Abu-Qarn (2019) arrived at a different conclusion, finding that heterogeneous technology failed to enhance model fit across three data samples. The determination of income elasticity concerning broad capital (physical and human) has yielded discrepant results in earlier investigations. This discrepancy underscores a substantial challenge—the strong correlation between broad capital investment and productivity variables. This multicollinearity introduces complications for frequentist methods as it hampers the ability to discern the distinct impacts of these correlated dimensions on the dependent variable. Consequently, the interpretability of coefficients associated with the correlated variables is compromised, and their standard errors may inflate. Furthermore, estimating the textbook Solow model and its MRW specifications may confront another challenge: reverse causality (Caselli et al., 1996). Several strategies are available for consideration to address statistical issues. As an effective technique, Bayesian approaches provide a more adaptable and principled framework for modeling intricate relationships between variables, thereby enabling more effective management of these issues (Block et al., 2011; Hahn & Doh, 2006; Leamer, 1973). Besides, previous frequentist studies cannot conclusively determine the superiority between the textbook and augmented versions of the Solow model assessing goodness of fit through R-squared (Shalizi, 2019). R-squared proves inadequate when dealing with non-linear models, complex interdependencies, or models affected by the omission of crucial variables, as it assumes linear relationships between variables and uniform variance across all independent variable levels. Therefore, to grapple with methodological flaws, our research adopts a Bayesian non-linear regression framework on a dataset of 38 advanced countries situated near economic equilibrium and possessing requisite data. Our study differs from the previous frequentist analyses as follows. Firstly, departing from fixed exogenous variables, the study integrates fluctuating technological progress and capital depreciation rates. Secondly, we propose Bayesian estimation to effectively address statistical complexities by selecting appropriate informative priors for key variables—physical and human capital investment. Bayesian inference can integrate prior beliefs or existing knowledge about the intricate relationships among variables, thereby attenuating the potential influence of the mentioned issues. Prior beliefs seamlessly meld with observed data, resulting in an iterative process that continuously refines and updates our understanding of the complex interconnectedness between variables. Thirdly, getting rid of R-squared, the Bayesian approach’s capacity to incorporate prior beliefs and its adaptability to non-linearities and complex relationships positions it as a robust tool for model comparison and selection. This study contributes to the growth literature in two pivotal ways. Methodologically, by incorporating prior beliefs about the relationships between variables, the Bayesian panel approach permits the evaluation of individual effects of broad capital and technology growth concerning the response variable, output. This approach proves particularly beneficial when dealing with multicollinearity and reverse causality, as we can encode our existing knowledge to guide the estimation process. Furthermore, our findings underscore that our MRW specification incorporating heterogeneous technology growth and depreciation rates surpasses its homogeneous counterpart. The augmented MRW model, including diverse technology and capital depreciation, is the optimal fit for advanced countries.
MRW Specification of Solow Model
The standard Solow (1956) growth model relies on a classical Cobb-Douglas production function with constant returns to scale:

where

Admitting that
MRW assumed that the term

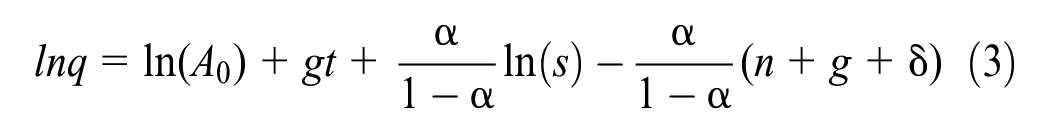
Equation 4 specifies both the signs and magnitudes of the coefficients of s and n and serves as MRW’s way to explain the variation of y across countries and the consistency of the Solow model with the observed variation. Furthermore, the model’s identifying restriction emerges, indicating that the coefficients of
When human capital is introduced into the production function, Equation 1 becomes:

In the augmented Solow model, where

Similar to the textbook Solow model, Equation 6 provides predictions for the signs and magnitudes of the coefficients, and it also introduces the identifying restriction that the sum of the coefficients equals zero. When assuming that countries are in their steady state, this equation can be effectively used to test how varying rates of investments in physical and human capital and labor force growth contribute to explaining the variation of income levels across countries.
Hydrid Metropolis-Hastings Sampler in Bayesian Perspective and Data
In light of advancements in computer technology and the availability of sophisticated software packages, Bayesian statistics has emerged as a compelling alternative to the traditional frequentist approach. Initially rooted in decision theory and macroeconomics, the Bayesian methodology has transcended its origins to encompass a wide array of social disciplines due to its inherent advantages over conventional frequentist statistics (Briggs, 2023; Nguyen, 2023; Thach et al., 2019, 2022, among others).
A main advantage of Bayesian methods in growth econometrics lies in their capacity to tackle the challenges posed by model uncertainty, which often arises from issues related to data quality, such as multicollinearity and reverse causality. These challenges can introduce instability and unreliability in coefficient estimates, undermining the credibility of frequentist analyses. In instances where variables exhibit strong correlations or instances of reverse causality are evident, disentangling their respective impacts on the dependent variable becomes intricate, leading to ambiguities in interpretation. In such scenarios, the Bayesian approach offers a remedy by amalgamating prior information with the available data to inform the estimation of effect sizes, relationships, and directions among variables. This fusion results in a more accurate and robust parameter estimation process (Block et al., 2011; Farrar & Glauber, 1967; Gelman & Pardoe, 2006; Hahn & Doh, 2006; Leamer, 1973; Winship & Western, 2016).
Bayesian regressions can, in certain cases, be performed without resorting to Markov chain Monte Carlo (MCMC) sampling, particularly when the posterior distribution either has a closed-form solution or can be accurately approximated using simpler methods. However, in instances where direct sampling becomes infeasible—especially when addressing complex models and high-dimensional parameter spaces, as encountered in our study—MCMC algorithms are indispensable computational tools for sampling from probability distributions. Specifically, the MH algorithm and the Gibbs sampler, two widely utilized MCMC techniques, are implemented to generate samples from the posterior distribution of model parameters in a Bayesian framework. Once posterior samples are obtained via MCMC, they serve as the foundation for estimating posterior means, variances, and credible intervals, all of which are integral to Bayesian inference. This study employs a hybrid approach that integrates MH sampling with Gibbs updates to enhance computational efficiency within the Bayesian methodology. The MH algorithm, in particular, facilitates the simulation of Markov chains by transitioning incrementally from the current parameter values or states, as determined by a proposal distribution. During each iteration, a new state is proposed, and its acceptance probability is calculated based on the relationship between the proposed state and the existing state. A crucial determinant of the Markov chain’s mixing properties—its ability to effectively explore the stationary distribution—is the choice of the proposal distribution. Selecting an appropriate proposal distribution is thus paramount to the success of the MH algorithm, as it directly influences its efficiency in traversing the parameter space. The simulation process underpinning the hybrid approach is mathematically formalized below:
Generate samples
Initialization: Start with an initial value
Iteration: For each iteration t (from 1 to N):
For each component
Gibbs sampling step (if the conditional is easy to sample from):
MH step (if the conditional is not easy to sample from):
Proposal: Generate a proposed value

Acceptance probability

where
Update: Generate a uniform random number

Furthermore, the research analyzes a panel dataset of 38 advanced economies (see Appendix 3 Table 8) from 1970 to 2019, considering various fundamental inputs and their linkage to national income. The dataset includes the primary variables: fixed investment share in GDP (
Definition of Variables.

Source. Compilation and calculation by the author.
To access the validity of the MRW specification augmented with heterogeneous technology, we implement a series of four simulations designed to examine diverse growth scenarios. These scenarios encompass the standard Solow model alongside its modified counterparts. The selection of these four growth models is underpinned by well-known mathematically rigorous and economically sound specifications, with some emphasizing human capital augmentation (as proposed by Abu-Qarn, 2019; Mankiw et al., 1992) and others advocating for the inclusion of country-specific technology levels and growth rates (as suggested by Abu-Qarn, 2019; Dan & Thach, 2024; Felipe & McCombie, 2005; Islam, 1995). This multifaceted approach ensures a comprehensive exploration of the dynamics between economic growth and key factors, including human capital and technological heterogeneity, in the context of advanced economies. Throughout these simulations, we manipulate assumptions related to technology growth and depreciation rates, aiming to capture diverse economic scenarios. The first simulation centers around the textbook Solow model, resembling the traditional framework, where technology growth and depreciation rates are held constant at 0.05, mirroring the approach adopted by Mankiw et al. (1992) In the second simulation, we retain the textbook Solow model but introduce an element of heterogeneity by allowing for country-specific and time-variant disparities in technology growth and depreciation rates. The third simulation introduces the human capital-augmented version of the Solow model, also known as the original MRW specification. We maintain a uniform technology growth and depreciation rate of 0.05 across all cases in this iteration. Lastly, the fourth simulation extends the human capital-augmented Solow model to incorporate individualized technology growth and depreciation rates, accommodating potential variations among different countries. Through these four distinct simulations, we aim to comprehensively investigate the implications of varying assumptions concerning technology growth and depreciation rates within both the traditional and augmented Solow models.
Remarkably, to compare the models and assess their goodness of fit, we analyze main statistics such as log of marginal likelihood (log(ML)), DIC, Bayes factor (in log metric, log(BF)), and posterior probabilities of models (P(M/y)). In case a MCMC sampler is implemented, prior to drawing inferences, we necessarily check MCMC convergence through diverse diagnostic tests.
During our simulation process, we set up a default configuration for the MCMC sample, where we discard the initial 2,500 burn-in iterations to ensure stability and convergence. To effectively assess MCMC convergence in a high-dimensional regression, we employ a thinning rate of 50, which allows us to reduce the number of iterations while preserving the sample’s representativeness. As a result, 502,451 iterations are executed within the MCMC algorithm, providing us with a robust and reliable analysis.
Simulation Results and Interpretation
Statistical Analysis
Before proceeding to the primary analysis, a preliminary statistical examination, encompassing a statistical summary and pairwise correlation analysis, is conducted. The statistical summary in Table 2 reveals that while the standard deviation (Std. dev.) indicates moderate variability in income levels across countries, it demonstrates relatively low variation for the other variables. Moreover, the range between the minimum and maximum values highlights substantial heterogeneity in per capita income, population growth, and productivity growth rates. In contrast, the narrower range observed for the share of gross fixed capital formation in GDP and the proportion of the working-age population with intermediate education reflects a relatively uniform distribution for these indicators.
Descriptive Statistics.
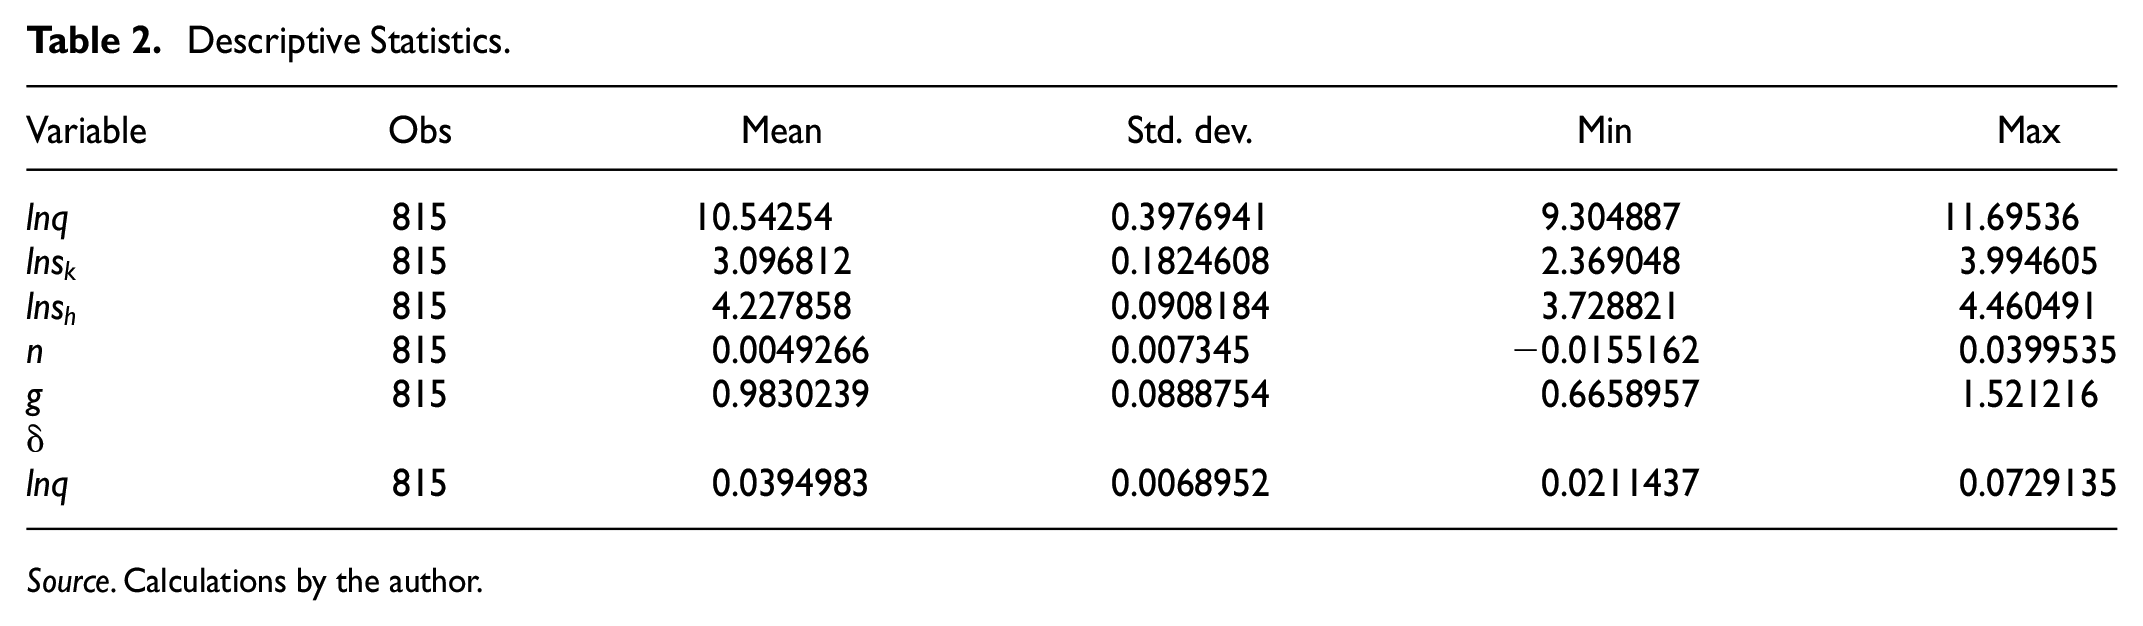
Source. Calculations by the author.
To assess the potential presence of multicollinearity and reverse causality, we analyze the results of the pairwise correlation presented in Table 3, which reveal a reinforcing relationship between physical and human capital investments. This mutual reinforcement is further evident in the pairwise correlations between technological growth and broad capital accumulation, as highlighted in Table 3. Following the threshold proposed by Block et al. (2011), a correlation coefficient of approximately .7 or higher is considered strong, posing severe challenges in disentangling the individual effects of correlated predictors on the dependent variable. The observed high correlation between
Correlation Statistics.
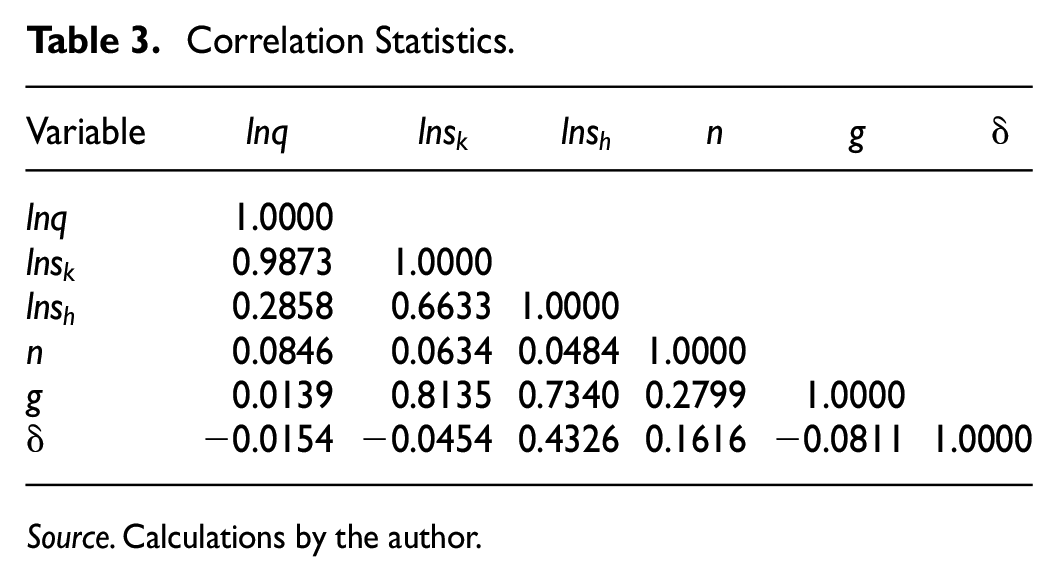
Source. Calculations by the author.
Sensitivity Analysis
This analysis aims at model comparison and selection within the Bayesian paradigm. Bayesian criteria such as DIC, log(BF), log(ML), and P(M/y) offer significant advantages over the frequentist R-squared. Indeed, R-squared is not a good measurement of model fit (Shalizi, 2019). The limitations of R-squared extend beyond its applicability to growth and complex models. These limitations comprise its vulnerability to shifts in model complexity, incapability to accommodate non-linear associations, overlooking crucial variables, susceptibility to outliers, absence of insights into model assumptions, inappropriateness for intricate relationships, fixation on elucidated variance, restricted interpretive scope, and presupposition of linearity and homoscedasticity. When comparing models, a notable divergence in DIC values (exceeding 2 or 3 units) might suggest that one model markedly outperforms another. Similarly, a log(ML) disparity, surpassing a certain threshold (e.g., 2 or 3 units), could indicate superior model fitness. P(M|y) of distinct models span from 0 to 1. The data firmly corroborates a model attaining a substantial posterior probability (above .9), whereas a model with a scanty posterior probability (below .1) garners limited support. A log(BF) greater than 2 furnishes compelling evidence of one model’s advantage over another (Jeffreys, 1961). As exhibited in Table 4, the Bayesian criteria consistently support the human capital-augmented Solow model with heterogeneous technology growth and depreciation rates because this model specification obtains the highest values of log(ML), (P(M|y), and log(BF) (−425.809, 0.824, and 725.820, respectively), along with the lowest value of DIC (817.088).
Comparison of Solow Model Specifications.

Source. Calculations by the author.
More importantly, when comparing the textbook Solow models with their augmented counterparts in pairs, the models featuring heterogeneous technology growth and depreciation rates consistently outperform those with homogeneous technology growth and depreciation rates, with −1,121.251 > −1,151.629 and −425.809 > −427.354 (log(ML)); 2,213.298 < 2,273.845 and 817.088 < 817.429 (DIC); 0.001 > 0.000 and 0.824 > 0.176 (P(M|y)); 30.378>reference line and 725.820 > 724.275 (log(BF)). Furthermore, the augmented models demonstrate superior performance compared to the textbook models, with −425.809 > −1121.251 and −427.354 > 1151.629 (log(ML)); 817.429 < 2,273.845 and 817.088 < 2,213.298 (DIC); 0.176 > 0.000 and 0.824 > 0.001 (P(M|y)); 724.275>reference line and 725.820 > 30.378 (log(BF)). These findings strongly suggest that the inclusion of additional variables, such as varying technology growth and depreciation rates, effectively addresses the issue of omitted variable bias and results in a better goodness of fit. As theorized by economists like Romer (1990), Lucas (1988), Jones (1995), Acemoglu (2009), and Liu et al. (2022), the incorporation of heterogeneous technology growth could potentially introduce multicollinearity due to the high correlation between investments in physical and human capital and technological progress. As discussed earlier, the Bayesian approach offers a robust solution to handling methodological issues, which is beyond the capability of the frequentist setting. The Bayesian methods can disentangle the individual effects of highly correlated explanatory variables (Block et al., 2011; Hahn & Doh, 2006; Leamer, 1973).
Our first intermediate conclusion is that adopting a Bayesian approach and utilizing specific informative priors for the elasticity parameters (alpha and beta) has proven effective in disentangling the individual effects of correlated variables within the growth model. Additionally, introducing human capital as a variable enhances the Solow model’s explanatory power; moreover, including technology growth and depreciation rates as variables contributes to the enhanced explanatory power of both the standard Solow model and its augmented version.
Comparative Analysis of Frequentist and Bayesian Inference
This subsection aims to assess and contrast the performance of Bayesian and frequentist methodologies concerning their explanatory capabilities. Specifically, we seek to evaluate their effectiveness in addressing statistical challenges frequently arising in neoclassical growth models. To this end, we adopt a visual approach that involves constructing residual plots and observed versus fitted plots to discern which approach outperforms the other in such scenarios. Utilizing such plots allows us to engage in a visual comparison of the model performances. By plotting residuals (the disparities between predicted and actual values) against the predicted values, we can readily detect any patterns or trends in the residuals that might signify lingering issues with multicollinearity or other model assumptions. Figure 1a to d unveil a significant divergence in the performance between the two approaches, with Bayesian models outshining their frequentist counterparts. This is evident from the consistent deviation of residuals above the zero line in the frequentist models, indicating a systematic bias. Furthermore, the systematic increase or decrease in spread indicates non-constant variability of residuals, indicative of potential heteroscedasticity. The funnel-shaped pattern in frequentist models, where spread fluctuates with predictions, provides another signal of heteroscedasticity. Numerous outliers in the frequentist models imply substantial prediction discrepancies for specific observations. In contrast, the Bayesian residuals exhibit a more favorable pattern. Residuals appear randomly dispersed around the zero line, pointing to unbiased predictions and a lack of systematic errors. Moreover, the spread remains relatively consistent across all levels of predicted values as we traverse along the X-axis (predicted values). This consistency signals the absence of heteroscedasticity, which emerges when the spread of residuals fluctuates across the range of predicted values. It is worth noting that the Bayesian residuals plots indicate fewer outliers compared to their frequentist counterparts.

(a–d) Residuals versus Predicted Plots. (a) Textbook Solow model with homogeneous technology. (b) Textbook Solow model with heterogeneous technology. (c) Augmented Solow model with homogeneous technology. (d) Augmented Solow model with heterogeneous technology.
Furthermore, observed versus fitted (predicted) plots are examined for the respective models. For the textbook Solow models incorporating homogeneous and heterogeneous technology and depreciation rates (Figure 2a and b), the goodness-of-fit levels appear comparable, with the Bayesian models exhibiting a marginally better performance due to reduced outlier presence. However, Figure 2c and d distinctly demonstrate the superiority of the Bayesian models, as evidenced by a stronger alignment between observed and predicted values.

(a–d): Observed versus Fitted Plots. (a) Textbook Solow model with homogeneous technology. (b) Textbook Solow model with heterogeneous technology. (c) Augmented Solow model with homogeneous technology. (d) Augmented Solow model with homogeneous technology.
In addition, conventional metrics such as MSE (or RMSE) and MAE are utilized to evaluate and compare goodness-of-fit. Table 7 (Appendix 2) presents these outcomes, highlighting that Bayesian methods outperform frequentist approaches, augmented Solow models provide superior explanatory power compared to their textbook counterparts, and models incorporating heterogeneous technology outperform those assuming homogeneous technology.
The second intermediate conclusion is that the visual and numeric analyses underscore the superiority of Bayesian models over frequentist models in terms of their performance and resilience to statistical issues. The Bayesian approach presents a more reliable option for addressing complex challenges within neoclassical growth models.
Results and Interpretation
Upon scrutinizing the MCMC convergence, we ascertained the absence of any anomalies. Diverse techniques are at our disposal for evaluating the performance of MCMC algorithms. These include multiple graphical diagnostics. The trace plot is a widely employed method. Our trace plots show a reassuring absence of indications pointing toward MCMC non-convergence. As depicted in Appendix 1 Figure 3, the trace plots adeptly traverse the posterior domain, showcasing a swift movement without any discernible patterns or significant irregularities. Additionally, as showcased in Appendix 1 Figure 3, the histograms resemble the contours of the posterior distributions. This congruence between histograms and distributions strongly indicates satisfactory mixing and convergence of the Markov chains. We also turned to autocorrelation plots, which furnish valuable qualitative insights into the mixing behavior. Our findings align with MCMC convergence, as evidenced by the rapid decay of autocorrelation to near-zero values at higher lags (Appendix 1 Figure 3). Lastly, kernel density plots offer an alternative perspective on the simulated marginal posterior distributions, resembling smoothed histograms. To assess convergence, we introduce two additional density curves: the first-half density derived from the initial half of the MCMC sample and the second-half density originating from the latter half of the MCMC sample. The evident proximity of the three density curves attests to the chain’s successful convergence and effective mixing (Appendix 1 Figure 3). This distinct pattern confirms the convergence of the MCMC process and bolsters our confidence in the robustness of our analysis.
The estimation outcomes of textbook and human capital-augmented Solow models are summarized in Table 5.
Posterior summary of textbook and human capital-augmented Solow models.

Source. Calculations by the author.
Indicates the mean estimates of parameters; ** denotes the posterior standard deviation (PSD), *** signifies the Markov chain standard error (MCSE), and **** indicates the Posterior Probability Interval (PPI), which represents the 95% probability that a parameter falls within a specific range within the population.
Let us now delve into the posterior summary of the four models (Table 5). The posterior standard deviation (PSD) is a gage of the uncertainty or variability in the model’s parameter estimates. On the other hand, the Markov Chain Standard Error (MCSE) assesses the accuracy of the MCMC sampling. This measure is crucial to ensure that the MCMC chains have effectively converged and generated samples from the true posterior distribution. Achieving a small MCSE indicates favorable convergence and accurate sampling. A rule of thumb typically suggests that the MCSE should be a fraction (around 0.01) of the posterior standard deviation. The outcomes documented in Table 5 underscore that MCSEs for most all parameters surpass the 0.01 threshold, indicating stable and reliable estimates. Additionally, the PSD for key variables, including output elasticities associated with physical and human capital, is negligible and nearly zero. The textbook Solow model incorporating heterogeneous technology growth and depreciation rates (with alpha estimates at 0.24) stands apart among the four models considered. In the remaining three models, elasticity estimates for physical capital fall within the range of 0.01 to 0.02, while estimates for human capital elasticity remain at 0.01. The estimates for these parameters from the PPIs exhibit a consistent pattern, falling between 0 and 0.5 with a 95% probability, aligning with our hypothesis. (We assigned a uniform (0, 0.5) prior to these estimates).
The outcomes presented in Table 6 facilitate a comparative analysis between our discoveries and those put forth by Mankiw et al. (1992) alongside several subsequent studies exploring the premise of differing technology growth rates among countries. Our findings reveal a significant enhancement in the output elasticity of physical capital when augmenting the textbook Solow model with heterogeneous technology growth and depreciation rates. The elasticity rises notably from 0.02 to 0.24. This observation closely aligns with the results presented by Abu-Qarn (2019), who reported the alpha elasticities of 0.04 and 0.02 in the context of a model with homogeneous technology and an augmented model with heterogeneous technology, respectively, for the OECD subsample within the time frame of 1960 to 2000 (refer to Table 6). Likewise, when examining the no-oil and inter-subsamples model from 1960 to 1985 (Abu-Qarn, 2019), we find that the alpha elasticities range from 0.23 to 0.33. Interestingly, our study highlights a marginal variance in the alpha elasticity, falling within the range of 0.005 to 0.01 for both human capital-augmented Solow models, whether utilizing homogeneous or heterogeneous technology growth. This outcome closely echoes the findings of Abu-Qarn (2019) for the OECD subsample from 1960 to 2000. Our findings also agree with Bernanke and Gürkaynak (2001) and Canarella and Pollard (2011). In contrast, the beta elasticity consistently centers around 0.01 for both our augmented models. This differs significantly from prior research outcomes, including Mankiw et al. (1992), Islam (1995), Bernanke and Gürkaynak (2001), Felipe and McCombie (2005), Canarella and Pollard (2011), and Abu-Qarn (2019) and many others. It is important to emphasize that our results partially corroborate the conclusions of Bernanke and Gürkaynak (2001), Canarella and Pollard (2011), and Abu-Qarn (2019) due to our shared sample selection (OECD and advanced countries), utilization of updated data, and the employment of TFP data computed using the growth accounting method. Our findings provide crucial insights. First, integrating specific informative priors, capturing prior beliefs on variable interactions and the magnitude of impact effect empowers Bayesian inference to effectively tackle statistical challenges. Second, Bayesian estimation introduces valuable shrinkage effects that significantly improve estimation accuracy. Under Bayesian shrinkage, broad capital elasticities closely converge with true values, shedding light on the influence of technological advancement and latent factors often overlooked by traditional observation. Lastly, our analysis underscores the superiority of the modified MRW model, which incorporates heterogeneous technology growth and depreciation rates, in elucidating income variations across advanced countries over time.
Alpha and Beta Elasticities in Textbook and Human Capital-Augmented Solow Models.

Source. Calculations and synthesis by the author.
Bayesian estimates; ** Frequentist estimates; *** The estimates are derived using two distinct panel techniques; **** TFP is computed under two scenarios, one incorporating human capital and the other without it.
In our third intermediate conclusion, we establish that our augmented Solow model, which incorporates diverse considerations encompassing human capital, technology growth, and depreciation rates, emerges as the most suitable framework for aligning with the data and effectively deciphering variation in real income per capita across nations and over temporal domains. Notably, for advanced nations, encompassing those within the OECD, the prominence of human capital in propelling economic growth seems equivalent to that of physical capital. Considering the relatively modest alpha and beta elasticity coefficients, the substantial influence of technological advancement on economic growth becomes conspicuously evident, unveiling the potential presence of externalities. This leads us to conclude that assuming the absence of externalities within the Solow models is an untenable proposition in this context.
A supplementary analysis is conducted within the frequentist framework for four distinct growth models, as presented in Table 6. The estimation outcomes yield noteworthy insights: while the textbook Solow model with heterogeneous technology growth and depreciation rates produces an α-elasticity estimate of 0.25, comparable to the rather elevated coefficient of 0.34 in the textbook Solow model assuming homogeneous technology growth and depreciation rates, the two human capital-augmented Solow models—both with homogeneous and heterogeneous technology growth and depreciation rates—generate significant negative estimates for both α and β coefficients. These results suggest potential challenges arising from statistical complexities, such as multicollinearity, reverse causality, intricate interdependencies among variables in regression models, or issues associated with non-linear or highly dimensional (mixed-effects) specifications, which are difficult to address effectively using traditional frequentist methodologies (Pesaran & Smith, 2018; Winship & Western, 2016).
Conclusion, Recommendations, and Limitations
In the context of the Solow growth model, the issue of omitted variable bias led Mankiw et al. (1992) to extend the model by incorporating human capital, resulting in an augmented version with enhanced explanatory power. However, MRW’s assumption of uniform technology was subsequently criticized as being overly simplistic and inconsistent with observed economic realities. To address omitted variable bias further, subsequent studies incorporated additional relevant variables, such as technological advancements. However, the inclusion of technology growth variables introduced statistical challenges, including multicollinearity and reverse causality, which frequentist methods struggle to resolve effectively. To overcome these issues, our study employs a Bayesian non-linear framework that combines the Metropolis-Hastings (MH) sampler with the Gibbs algorithm. This approach addresses model uncertainty and statistical complexities by incorporating informative priors, encoding prior knowledge about the interactions among variables. To capture diverse economic growth dynamics, we estimate four models—textbook and augmented Solow models, each with and without variations in technology growth and depreciation rates—using panel data from 38 advanced economies over a 30-year period. Bayesian techniques, by leveraging shrinkage effects through specific priors, are instrumental in model comparison and selection, highlighting the superiority of augmented models over textbook formulations. Among the evaluated models, the augmented Solow model incorporating heterogeneous technology growth and variable depreciation rates outperforms the others in explaining income variations across advanced economies and over time. Notably, the reduction in the estimated elasticities of physical and human capital after including variables such as technology growth and depreciation rates underscores the potential omission of critical factors in traditional growth models. This finding aligns with endogenous growth theories, which emphasize the importance of externalities stemming from the accumulation of physical and human capital.
Enhancing the accumulation of physical and human capital, along with promoting technological progress, is essential for sustainable economic growth. Here are some combined measures that can contribute to achieving these goals:
Measures for Encouraging Human Capital
Investment in education and training: Allocate resources to education and training programs that develop a skilled and knowledgeable workforce. This enhances human capital and promotes technological progress by enabling the workforce to adapt to new technologies and innovations.
Lifelong learning programs: Establish programs that encourage continuous learning and skill development throughout an individual’s career. This ensures that the workforce remains adaptable to evolving technological requirements.
Flexible labor markets: Develop labor markets that allow for easy mobility of workers and match labor demand with supply. This ensures that skilled workers are available where they are needed most.
Measures for Increasing Physical Capital
Incentives for investment: Offer tax incentives, grants, or subsidies to encourage businesses to invest in capital equipment, research, and employee training.
Infrastructure development: Develop robust physical infrastructure such as transportation networks, communication systems, and energy facilities. Infrastructure supports the efficient movement of goods, services, and information, contributing to physical investment.
Measures for Technological Advancement
R&D funding: Encourage both public and private investment in R&D activities. This facilitates technological advancements, fosters innovation, and drives economic growth by creating new products, processes, and industries.
Promote entrepreneurship and innovation: Create an environment that encourages entrepreneurship and innovation. This could include providing startup incentives, fostering collaboration between universities and industries, and protecting intellectual property rights.
Public-private partnerships (PPPs): Foster collaboration between the public and private sectors to jointly invest in research, infrastructure, and education. PPPs leverage the strengths of both sectors for effective resource allocation.
Knowledge transfer: Facilitate knowledge and technology transfer from academic and research institutions to industries. This can be achieved through collaborations, technology transfer offices, and industry-academic partnerships.
Open innovation platforms: Create platforms that facilitate sharing ideas, technologies, and expertise across different organizations. Open innovation encourages cross-sector collaboration and accelerates technological progress.
Support for small and medium enterprises (SMEs): Assist SMEs, as they often drive innovation and contribute significantly to employment and economic growth. This could include access to funding, training, and mentoring.
Government policies: Enact policies that support economic growth, innovation, and education. This includes fostering a business-friendly environment, implementing science and technology policies, and promoting sustainable development.
Green technologies and sustainability: Focus on technologies and practices that enhance growth and contribute to environmental sustainability. Green technologies can drive economic growth while minimizing negative environmental impacts.
International collaboration: Collaborate with other countries on research, innovation, and education initiatives. Sharing knowledge and expertise on a global scale can accelerate technological progress and economic growth.
Combining these measures can create a synergistic effect, propelling physical and human capital accumulation alongside technological progress and leading to sustainable and inclusive economic growth.
A primary limitation of this study lies in the omission of uncertain but potentially relevant variables such as social returns to broad capital accumulation. It is recommended that future growth models incorporate this crucial predictor to enhance the comprehensiveness of the analysis.
Footnotes
Appendix 1
Appendix 2
Model and Method Comparison Based on MSE, RMSE, and MAE Metrics.

| Specification | Method | MSE | RMSE | MAE |
|---|---|---|---|---|
| Textbook Solow homogeneous technology | Bayesian | 0.3120694 | 0.5586 | 0.43557701 |
| Frequentist | 0.3121536 | 0.5587 | 0.43709158 | |
| Textbook Solow with heterogeneous technology | Bayesian | 0.30269634 | 0.5502 | 0.42757165 |
| Frequentist | 0.30278449 | 0.5503 | 0.4366095 | |
| Augmented Solow homogeneous technology | Bayesian | 0.30258547 | 0.5501 | 0.4256822 |
| Frequentist | 0.30266328 | 0.5501 | 0.4365134 | |
| Augmented Solow with heterogeneous technology | Bayesian | 0.30237566 | 0.5499 | 0.4247453 |
| Frequentist | 0.30245433 | 0.5499 | 0.4346095 |
Source. Calculation by the author.
Appendix 3
List of Advanced Countries in the Sample.

| Country | |
|---|---|
| 1 | Australia |
| 2 | Austria |
| 3 | Belgium |
| 4 | Canada |
| 5 | Chile |
| 6 | Colombia |
| 7 | Costa Rica |
| 8 | Czech Republic |
| 9 | Denmark |
| 10 | Estonia |
| 11 | Finland |
| 12 | France |
| 13 | Germany |
| 14 | Greece |
| 15 | Hungary |
| 16 | Ireland |
| 17 | Iceland |
| 18 | Israel |
| 19 | Italy |
| 20 | Japan |
| 21 | Latvia |
| 22 | Lithuania |
| 23 | Luxembourg |
| 24 | Mexico |
| 25 | Netherlands |
| 26 | Norway |
| 27 | New Zealand |
| 28 | Poland |
| 29 | Portugal |
| 30 | Republic of Korea |
| 31 | Slovakia |
| 32 | Slovenia |
| 33 | Spain |
| 34 | Sweden |
| 35 | Switzerland |
| 36 | Turkey |
| 37 | United Kingdom |
| 38 | United States |
Acknowledgements
Thank editors and reviewers a lot for valuable suggestions and comments.
Declaration of Conflicting Interests
The author declared no potential conflicts of interest with respect to the research, authorship, and/or publication of this article.
Funding
The author received no financial support for the research, authorship, and/or publication of this article.
Ethical Approval
An ethics statement (including the committee approval number) for animal and human studies. If this is not applicable, please state this instead.
Data Availability Statement
Data sharing not applicable to this article as no datasets were generated or analyzed during the current study.