
Abstract
Properly locating these facilities is a substantial factor in the success of the logistics systems. In this paper, a bi-objective mathematical model for a maximal covering hub location problem is presented to minimize time and environmental risks. The Goal Attainment method was employed to solve the small-sized problems for model validation. Since the problem is NP-Hard, the Multi-Objective Imperialist Competitive Algorithm (MOICA) meta-heuristic algorithm was exploited for solving the medium and large-sized problems. The performance of MOICA was compared with the performance of the Goal Attainment method and the Multi-Objective Particle Swarm Optimization (MOPSO) algorithm to validate the proposed model and solution approach. This paper can direct the logistics companies to reduce the cost, time, and environmental effects of their transportation networks. In addition, this research can optimize energy consumption in the transportation sector for the continuation of low-cost services and reduce fuel consumption, which leads to reducing environmental pollution.
Keywords
Introduction
The problem of locating facilities is one of the issues that should be considered in the initial stages of designing industrial systems. Choosing an appropriate location for a facilitation center can be an important factor in its success. Also, the hub location problem (HLP) is one of the issues raised in the field of location (Yin et al., 2019; Soleimani et al., 2022). This topic is very important because of its broad applications. Locating hubs in transportation systems has been one of the most challenging and significant issues in recent years (K. Yang et al., 2014). Hubs are facilities that serve as transfer and exchange points to multiple origins and destinations for remote transportation and communication systems (Yaman & Elloumi, 2012). The main advantage of using the hub network is its economic efficiency due to the indirect connection between the origin and destination points. In the hub network, it is usually assumed that the use of inter-hub transportation leads to cost reduction, which is economical compared to direct transmission networks. In transportation networks, where there is a large volume of transportation between several points, a hub can be established for economic reasons to decrease transportation time, cost, and fuel consumption (J. Wang & Qin, 2021; Zahedi & Ghahremani Nahr, 2020).
The HLP focuses on how to establish hubs to optimize the entire system. In such systems, direct transportation flow does not exist between two nodes (origin and destination), but through one or two hubs (Qu & Weng, 2009). In the HLP, the service includes the movement of people, goods, or information between the place of origin and destination (Vural & Aygün, 2019). Hub equipment is used as distribution and collection centers in many transportation networks (Tofighian & Arshadi khamseh, 2020). These types of systems are addressed when goods, passengers, or information must be sent from a set of origins to a set of destinations (Tikani et al., 2021). Facilities that perform the operations of exchange, handling, collection, classification, loading, and distribution are designed as hubs (Talbi & Todosijević, 2017). In fact, hubs are exploited as the only valid intermediate points on the route from origin to destination. Flows from different origins are first collected in these hubs to pass through an intermediate hub or to be sent to the final destination, and they are combined and sent with flows that have the same destination and arrived from other origins (Rostami et al., 2021). Usually, the main goal of hub network design is locating hub facilities and assigning non-hub nodes to hubs in building the network with the lowest cost in accordance with the cost of deployment and transportation (de Camargo et al., 2009).
In most of the manufacturing factories and service companies, timely supply of customer orders or timely service is important. Costs of delay in these problems not only harm the customer but also reduce the reputation of service companies or manufacturing factories. Transportation scheduling problems seek to find optimal scheduling with the aim of reducing transportation times and costs (Grine et al., 2021).
In addition, due to the importance of reducing environmental pollution and environmental and social pressures, there is growing attention to environmental issues (Eydi & Nasiri, 2019). Transportation with heavy machinery can have harmful effects on the environment, such as noise pollution and air pollution caused by the emission of greenhouse gases like
Therefore, a mathematical programming model is presented in this study for the HLP under uncertainty conditions to reduce time, cost, and environmental impact of the transportation network. In the present research, a central (focal) factory together with a number of hubs (for example, a subsidiary factory) connecting to a number of nodes (for example, customers, or stores) are considered in a network. The central factory is in charge of processing raw materials. Then, these materials are transferred to the factories where they are transformed into finished products. Finally, finished products are transferred from the hubs to the stores or customers (nodes).
The problem investigated in this study is a single-allocation, bi-objective coverage HLP with capacity constraints. The first objective function of the proposed model is to reduce costs. Due to the fact that only few criteria have been considered for the design of hub networks so far, the second objective function of this model seeks to reduce environmental impact. Also, the second objective function attempts to select the hub nodes that are in a better condition based on the four criteria of service quality, traffic of the covered area, transportation infrastructure, and expandability. Due to the computational complexity of the proposed model, the well-known meta-heuristic algorithm MOICA is exploited to find near-optimal solutions. Finally, the solutions obtained by the meta-heuristic algorithm are compared with the solutions obtained by the exact method for small and medium-sized problems.
The objectives of this research can be stated as follows:
- Designing an efficient hub network for the transfer of raw materials from the focal factory to the hubs,
- Minimizing the costs of the transportation network,
- Minimizing the costs and time of transferring raw materials from the focal factory to stores or customers,
- Reducing the environmental impact of the transportation network,
- Increasing the service quality of the transportation network,
- Reducing the traffic of the transportation network,
- Increasing the utilization of the transport infrastructure of the transport network,
- Increasing the expandability of the transportation network and,
- Considering the conditions of uncertainty to deal with real world changes.
The most important questions of the current study can be mentioned as follows:
- What effect does the use of hubs have on the cost and time of material transportation?
- What is the effect of the uncertainty of the model parameters on the network structure?
- How to assess the environmental hazards in the HLP?
- hat are the effects of the four criteria of service quality, traffic of the covered area, transportation infrastructure, and expandability on the transportation network?
The main contributions of this research can be expressed as follows:
- Presenting an optimization model for the HLP under uncertain and fuzzy environment,
- Using the four criteria of service quality, traffic of the covered area, transportation infrastructure, and expandability to calculate the weights of different nodes and using these weights in a separate objective function of the bi-objective coverage HLP.
This paper is structured as follows. In the following section, the relevant studies are reviewed. In Section “Problem definition,” the problem definition and mathematical programming model is given for the problem in hand. Section “Solution approach” explains the solution approach. In Section “Results,” the numerical examples are provided for the validation of the proposed model and solution method, also, the results are illustrated. Subsequently, a real case study is provided in Section “Case study.” Finally, Section “Conclusion” concludes the paper.
Literature Review
Reviewing the Hub Location Problems (HLPs)
In a large number of network design problems such as location, transportation, production planning and scheduling, finance, engineering design, etc., uncertainty should be considered to increase the efficiency of the system during operations. For this purpose, many researchers have addressed uncertainty in the HLPs. In this section, the relevant studies on the HLPs are reviewed.
T. H. Yang (2009) investigated the hub problem in air transportation. He considered the probabilistic demand with seasonal changes. The two-stage probabilistic model was s solved considering three scenarios. Also, Sim et al. (2009) developed a model for the p-hub center problem considering normal probability distribution for travel times and service limitation. In addition, Contreras et al. (2011) studied the HLP with multiple allocations and probabilistic data without considering facility capacity constraints. In this study, uncertainty in demand and transportation costs was taken into account. Moreover, Alumur et al. (2012) considered single allocation and multiple allocation HLPs separately without capacity constraints under uncertainty in the cost of preparing facilities and demand. Furthermore, K. Yang et al. (2013) presented a fuzzy model for the p-hub center problem considering perishable goods. The travel times were considered non-deterministic in the form of fuzzy numbers. They solved the model with a combination of Particle Swarm Optimization (PSO) algorithm with Genetic operators and local search.
Several researchers and scholars tackled the uncertainty in the HLP with three different modeling approaches including Stochastic Programming, Fuzzy Programming, and Robust Optimization (Abbasi-Parizi et al., 2018; Li et al. (2020); Maharjan & Hanaoka, 2020; Nourzadeh et al. (2020); Rahmati & Neghabi, 2021; Rajabi & Avakh Darestani, 2020; Shang et al., 2021a, 2021b; Snyder, 2006; Vahdani & Mohammadi, 2015; J. Wang & Qin, 2021; Zahedi & Ghahremani Nahr, 2020).
Rahmanniyay et al. (2020) presented a multi-objective integer linear programming model for a multi-valued p-hub median problem under uncertainty. In this model, the uncertainty in demand, transportation time, and establishment cost was considered. This model aimed to minimize the cost of transportation and establishment as well as to minimize the delay time of the distribution network in the supply chain. Mumtaz and Eriskin (2021) introduced a nonlinear optimization model to minimize the total population covered considering the service requirement. Alumur et al. (2021) provided a roadmap and made some suggestions for further studies on the HLPs. Shang, Jia, et al. (2021) proposed a credit-based fuzzy programming model with the objective of minimizing the last arrival time of cargo for the hierarchical multimodal HLP under uncertainty in cargo delivery systems. They considered the uncertainty of travel time and displacement time as fuzzy numbers and employed a heuristic method to solve the problem. Chobar et al. (2022) developed a bi-objective mathematical programming model to decrease the network cost and greenhouse gas emissions in the hub-spoke network for the perishable tourism products. Also, Ghaffarinasab et al. (2023) introduced the multi-allocation p-hub maximal covering problem in which the traffic of each origin–destination pair is classified into different groups with specified service level requirements. Moreover, Maleki et al. (2023) addressed the multiple allocation maximal hub covering problem where the flow of each origin–destination pair is distributed through various hubs in a way that the total flow covered by the located hubs is maximized. Furthermore, H. Wang et al. (2024) proposed a Lattice Boltzmann Method-like algorithm for the maximal covering location problem.
Reviewing the Solution Approaches
Except for some special cases, several authors proved that the HLP is NP-hard (Kara & Tansel, 2003; Weng et al., 2006). For this purpose, researchers have used different solution methods to solve these problems. In the following, some of these different solution methods used in the literature are reviewed.
Heuristic algorithms seek to find the optimal solution in the search space by putting together a series of rules and using a series of additional information to guide the search. Although these algorithms do not guarantee finding the optimal solution, they can find a good solution in a reasonable time. During the last three decades, new optimization methods have been introduced that seek to combine basic heuristic methods at a higher level to make the search more efficient, and these methods have become known as meta-heuristic algorithms. Meta-heuristic algorithms are general methods that can be used to solve various problems without the need for fundamental changes in their framework.
It has been proven that the p-hub median problem is also NP-hard. In this problem, even if the locations of the hubs are known in advance, the allocation problem is still NP-hard (Kara & Tansel, 2000, 2003). O’Kelly (1987) introduced two heuristic algorithms for the p-hub median problem with single assignment. Subsequently, Klincewicz (1991, 1992) proposed several heuristic algorithms for the p-hub median problem with single assignment. Also, Skorin-Kapov et al. (1996) used a Tabu Search algorithm for solving the p-hub median problem with single assignment. In addition, Abdinnour-Helm and Venkataramanan (1998) employed Simulated Annealing (SA) algorithm for solving the p-hub median problem with single assignment. Moreover, Sasaki et al. (1999) presented a greedy algorithm for the p-hub median problem with multiple assignment. Furthermore, Abdinnour-Helm (2001) suggested a heuristic algorithm based on the combination of Genetic Algorithm (GA) and Tabu Search (TS) algorithm to solve the HLP considering the fixed costs.
The first heuristic algorithm for the p-hub center problem with single assignment was proposed by Pamuk and Sepil (2001). The algorithm was a single-relocation algorithm for making decisions about location and allocation in acceptable time. They combined the algorithm with TS to increase the possibility of avoiding local optimal solutions. Then, Topcuoglu et al. (2005) exploited the Genetic Algorithm (GA) for the single assignment HLP considering the fixed costs without capacity constraints. The GA algorithm obtained much better solutions with less processing time compared to the hybrid algorithm introduced by Abdinnour-Helm and Venkataramanan (1998). Subsequently, Cunha and Silva (2007) used a Genetic Algorithm (GA) combined with Simulated Annealing (SA) algorithm to solve this problem. Also, another algorithm to solve this problem was introduced by Chen (2007), which was a combination of Tabu Search (TS) algorithm, Simulated Annealing (SA) algorithm, and advanced methods. This algorithm had advantages in terms of solution quality and solution time compared to the algorithm presented by Topcuoglu et al. (2005). Due to the fact that no comparison has been made with the algorithms introduced by Cunha and Silva (2007) and Chen (2007), it can be concluded that these two algorithms are the best algorithms presented so far to solve the single assignment HLP with fixed costs. Calık et al. (2009) utilized a TS-based heuristic algorithm to tackle this problem. Also, Gavriliouk (2009) used another heuristic algorithm for dealing with the p-hub center problem. Ilić et al. (2010) employed a Variable Neighborhood Search (VNS) method for the p-hub median problem with single assignment. Then, Parvaresh et al. (2014) studied the bi-level HLP and solved it by using the SA and TS algorithms.
Problem Definition
In this study, a central factory and a number of hubs (for example, affiliated or subsidiary factory) that are connected to a number of nodes (for example, a store or a customer) in a network are considered. The central factory is in charge of processing raw materials. Then, raw materials are transferred to affiliated factories where they are transformed into finished products. Finally, the finished products are transferred from the affiliated factories (hubs) to the stores or customers (nodes) with the least cost and time. As an instance, Figure 1 shows the location of the central factory and the nodes. Considering the location of the central factory and the cost of transporting raw materials from the central factory to each of the nodes, the hub network is designed for the existing nodes and the hub nodes are identified. Figure 2 depicts the location of the central factory and the hub network.
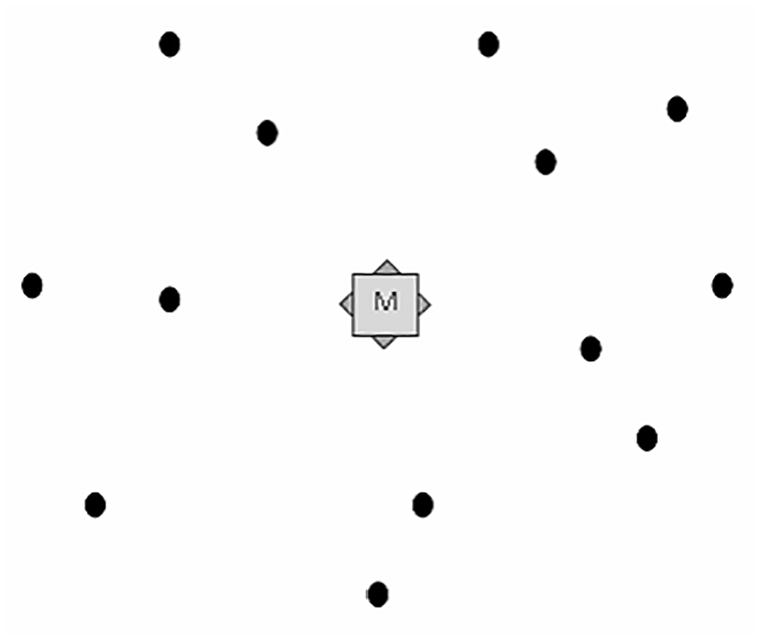
Location of the central factory and nodes.

Location of the central factory and the designed hub network.
As shown in Figure 2, a single-assignment bi-objective coverage HLP with capacity limitation is investigated. The first objective function of the proposed model is to minimize costs. Due to the fact that only a few criteria have been considered for the design of hub networks so far, the second objective function of the model is to minimize the environmental impacts caused by the construction of hubs (due to locating the production facilities) and seeks to consider hub nodes that are in a better condition based on four criteria of service quality, traffic in the covered area, transportation infrastructure, and expandability. In addition, in the studied HLP, the hub nodes are fully connected to each other and each non-hub node is assigned to exactly one hub. In this problem, a constant cost reduction coefficient

Direct routes between the central factory and the hubs.
Proposed Mathematical Programming Model
In this section, the mathematical programming model is presented for the bi-objective coverage HLP with single assignment and capacity limitation. The first objective is to reduce costs. Due to the fact that so far only a few criteria have been considered for the design of hub networks, the second objective of the model seeks to reduce environmental risks and to make hub nodes that are in a better condition in terms of four quality criteria of service quality, traffic of the covered area, transportation infrastructure, and expandability.
First, the assumptions of the model are provided. Then, the indexes, parameters, and decision variables of the model are defined. Finally, the model for the problem in hand is proposed.
Assumptions
- The location (position) of the points is definite and deterministic, also, any point can be selected as a hub. - The number of hubs is not known in advance. - At least one hub must be built. - Hub nodes are fully connected to each other (full communication). - Direct communication between non-hub nodes is not allowed and transfer is done only through intermediate nodes (hubs). - Allocation of non-hub nodes to hubs is single, which means that each non-hub node can transfer goods to only one hub and receive goods from only one hub (single allocation). - Each hub can receive a certain amount of incoming flow according to its capacity limitation. - Only non-hub nodes that are within the coverage radius of a hub can be assigned to the desired hub (covering hub). - There is a fee for establishing hubs in the network. - A reduction discount coefficient of - The reducing discount rate - Production facilities (affiliated or subsidiary factories) are located in hubs to reduce costs. - The risk assessment criterion is the fuzzy risk priority number for the environmental risks caused by the establishment of the hub in each node due to the location of production facilities (affiliated factories) in that hub. - The weight of the hub deployment in each node is considered according to four criteria of service quality, traffic of the covered area, transportation infrastructure, and expandability. - A fee is considered for the transfer of raw materials from the central factory to each of the hubs (affiliated or subsidiary factories). - No structure is imposed on the hub network.
The definition of the indexes, parameters, and decision variables of the model are provided as follows.

Mathematical Programming Model


s.t.


Equation 1 states the first objective function of the model that minimizes the total costs in which the first sentence calculates the whole costs of flow among non-hub nodes and hub nodes. In the second sentence, the total costs of flow between the hub nodes are computed. In the third sentence, the total costs of establishing the hubs is measured, and in the fourth sentence, the total transportation costs of raw materials from the focal factory to the hubs (affiliated or subsidiary factories) is calculated.
Equation 2 shows the second objective function of the model that minimizes the environmental risks in which the first sentence calculates the total Fuzzy Risk Priority Number (FRPN) related to the environmental risks caused by establishing hubs. (It should be noted that FRPN is obtained by using the extended Fuzzy Failure Mode and Effects Analysis (FMEA) technique which was developed by Fattahi and Khalilzadeh (2018). For further details about the calculation method of FRPN, we refer to Fattahi and Khalilzadeh (2018)). In the second sentence, the total weight of the establishment of hubs is computed according to the four criteria of service quality, traffic of the covered area, transportation infrastructure, and expandability.
It should be noted that the two objective functions are in conflict with each other, in that the nodes that have a higher Risk Priority Number (RPN), the cost of building hub in those nodes is lower and the nodes that have a lower Risk Priority Number (RPN), the cost of building hub in those nodes is higher. Also, the nodes in which the weight of building hub is higher according to the aforementioned four quality criteria, the cost of building hub in those nodes is also higher, but due to the fact that in the second sentence of the objective function, instead of
Constraints (3) and (4) guarantee that each node is assigned to exactly one hub (single assignment). Constraint (5) indicates that at least one hub should be built in the network. Constraint (6) guarantees that at least one node is connected to each hub. Constraint (7) shows the flow balance. Constraint (8) states the capacity limitation of each hub. Constraint (9) dictates that node i can be assigned to hub k only when the transportation cost of a unit of flow between two nodes i and k (
In the above mathematical programming model, the improved Fuzzy FMEA method introduced by Fattahi and Khalilzadeh (2018) was used to calculate the Fuzzy Risk Priority Numbers (FRPNs) related to the total environmental risks caused by building hubs. Also extended Fuzzy MULTIMOORA and the extended Fuzzy Analytic Hierarchy Process (FAHP) methods introduced by Fattahi and Khalilzadeh (2018) as two extended fuzzy multi-criteria decision-making methods were applied to calculate the weights of building hubs in the nodes based on the four criteria of service quality, traffic of the covered area, transportation infrastructure, and expandability.
Solution Approach
Also, an exact Goal Attainment method or Chebyshev Goal Programming (Min-Max Goal Programming) is utilized to solve the small-sized problems. Due to the NP-hardness of the problem in hand, the MOICA and MOPSO meta-heuristic algorithms are exploited to solve the problem.
Goal Attainment or Chebyshev Goal Programming Method
Goal Programming is one of the most important multi-objective models. This method shows the way to move towards several conflicting and multiple objectives at the same time. Unlike linear programming that maximizes or minimizes the objective function value, Goal Programming minimizes the deviations between desired goals and actual results. The basis of the Goal Programming method is that it considers numbers as expectation levels for the objective functions of the problem. Then, it seeks to minimize the sum of deviations from these levels. One type of Goal Programming methods is the Goal Attainment or Chebyshev Goal Programming method. This method attempts to minimize the maximum deviations of each objective function. For this reason, this method is also called Min-Max Goal Programming. The general form of this method is as follows:

s.t.


In the above model,


Also,
The Multi-Objective Imperialist Competitive Algorithm (MOICA) Meta-Heuristic Algorithm
Imperialist Competitive Algorithm (ICA), like other evolutionary algorithms, starts with an initial population, each member of the population is called a country, and each empire consists of a number of colonies and an imperialist (colonizer) (Kaushal & Devi, 2023). The details and explanations of the ICA algorithm can be found in K. Yang et al. (2013) and Hosseini & Al Khaled (2014).
The Multi-Objective Particle Swarm Optimization (MOPSO) Algorithm
In the Particle Swarm Optimization (PSO) algorithm, each member of the population is called a particle. Each particle has three properties: position, velocity, and best experienced position. The particle calculates the value of the objective function in the position of the space where it is located, and since the particles are connected, the particle is informed of the best swarm position. Then, using the combination of the present information and the best location it has been in before, as well as the information of the best particles in the swarm, it chooses a direction to move. After performing the collective movement, one step of the algorithm ends. These steps are repeated several times until the desired solution is obtained. The details and explanations of the PSO algorithm can be found in Kennedy and Eberhart (1995) and Tang et al. (2016).
Solution Representation Method
It is obvious that the efficiency of an algorithm and the quality of the solutions are completely dependent on the solution representation method. Also, the solution representation should be such that the algorithm can search the solution space easily. The solution representation in the optimization problems are categorized into two classifications: discrete and continuous solution representation. In this research, the continuous solution representation method is used for both MOPSO and MOICA meta-heuristic algorithms. The solution representation method used for these two algorithms is as follows:
First, an
A Sample Matrix for Displaying a Solution in the HLP.

In the above matrix, each column represents one of the nodes. In other words, the column 1 displays node 1, the column 2 represents node 2, and so on. In the next step, the numbers on the main diameter of this matrix which are greater than 0.5, become 1, and the rest of the numbers on the main diameter (which are less than 0.5) become zero. The nodes whose numbers on the main diameter are 1 are hubs and the rest of the nodes are non-hub nodes. It should be noted that if none of the numbers on the main diameter are greater than 0.5, the largest number is selected and converted to 1, because there must be at least one hub. In this sample matrix, nodes 2 and 5 are hubs and nodes 1, 3 and 4 are non-hub nodes. Table 2 shows the above operation.
Identification of Hubs and Non-Hub Nodes.

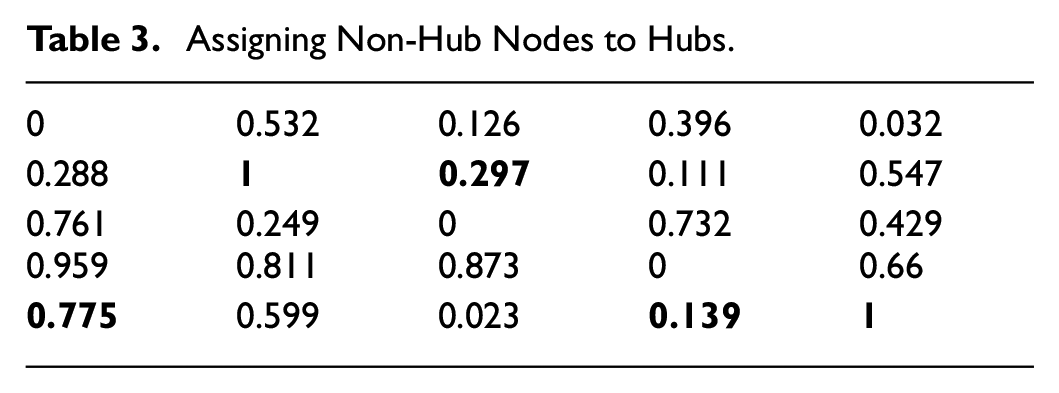
In the next step, in order to determine which hub serves each node, the largest number in the column corresponding to that node (only one number) should be selected. If this maximum number is on the row of each hub, that node is assigned to the hub. As shown in Table 3, nodes 1 and 4 are assigned to hub 5 and node 3 is assigned to hub 2.
Assigning Non-Hub Nodes to Hubs.
After solution representation, the MOPSO and MOICA meta-heuristic algorithms go through their steps to find Pareto optimal or near optimal solutions.
Setting Parameters by the Taguchi Method
Design of experiments is one of the common techniques for identifying effective and ineffective factors, controlling effective factors and reducing ineffective factors to optimize the process. The purpose of designing experiments is to determine the variables that have the greatest effect on the response. In the design of the experiments, a series of tests are performed in which the desired changes are applied to the input variables in such a way that we can observe and determine the causes of the changes in the response. One of the response optimization techniques is the Taguchi method. The purpose of this method is to select the best combination of the parameters based on the execution of a number of experiments. In this method, the value of each parameter can be considered at several levels, for example, low, medium, and high. In each experiment, the value of the response variable should be converted according to the Taguchi method to the ratio of signal (S) to noise (N) and analyzed according to its changes. S means desirable values (response variable) and N means undesirable values (standard deviation). As a result, the goal is to maximize the signal-to-noise ratio. These signal-to-noise ratios are derived from the quadratic loss function using Equation 22:
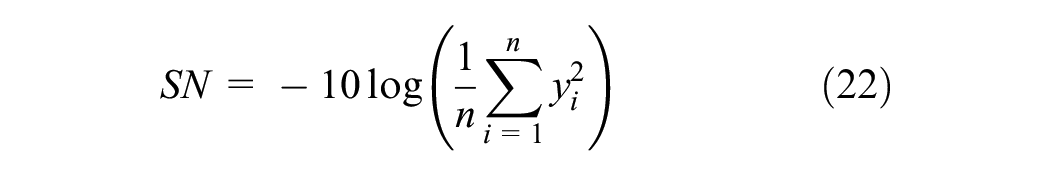
The analysis of the Taguchi method is based on two graphs, the first graph shows the main effects of the average solutions obtained, and the second graph shows the relationship between the levels of parameter values on the Signal-to-Noise ratio. In most cases, the results of the two graphs are the same, and if there are discrepancies, it is necessary to conduct new tests to make a decision.
In order to determine the optimal level of the parameters of the algorithms, the Taguchi method was used in the MINITAB 17 software. To use this method, the parameters are set at different levels depending on the type of algorithm used. According to the number of parameters of the algorithm and their different levels, the Taguchi L27 design (27 experiments) was employed for the MOICA and MOPSO algorithms. Tables 4 and 5 show the results of setting the parameters of the MOICA and MOPSO algorithms, respectively.
Setting the Parameters of the MOICA Algorithm.

Setting the Parameters of the MOPSO Algorithm.

Comparison Indexes
The performance of multi-objective algorithms is much more complicated than the performance of single-objective algorithms, therefore, an evaluation index cannot be sufficient to investigate the results of the presented algorithms (Hajghani et al., 2023; Heidari et al., 2023; Kebriyaii et al., 2021). In general, a solution provided by multi-objective algorithms should have three characteristics:
- The distance between the set of dominant solutions obtained by the algorithm with the Pareto optimal set should be minimal.
- The distribution of solutions in the set of Pareto solutions should be uniform.
- The obtained solutions cover a large part of the values of each objective function.
In order to compare algorithms, various indexes are used based one: (Hajghani et al., 2023; Heidari et al., 2021; Jolai et al., 2013; Kebriyaii et al., 2021):
(1) Quality Metric (QM): The quality metric is such that all the Pareto solutions obtained by each of the algorithms are taken into consideration together, then, a non-dominated operation is performed for all the obtained solutions. Finally, the quality of each algorithm is equal to the share of new Pareto solutions specific to that algorithm. Higher quality means better the performance of the algorithm.
(2) Mean Ideal Distance (MID): The value of this index is equal to the distance of the Pareto points of the algorithm from the ideal point. In this study, since the objective functions of the proposed model are minimization, the ideal point is considered equal to the minimum value of each objective function. This index can be calculated by using Equation 23:

In the above relation, n is equal to the number of Pareto points and
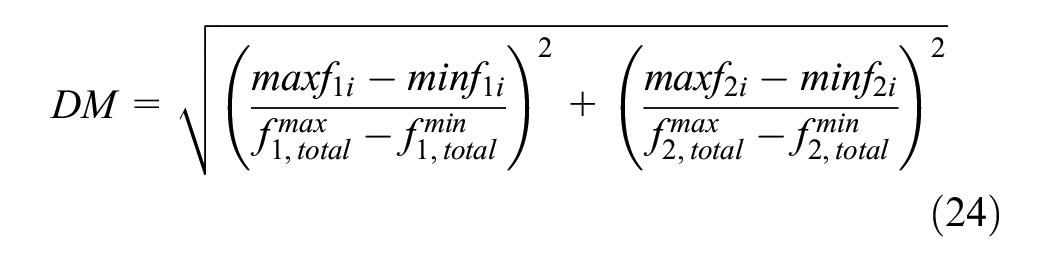
(3) Diversification Metric (DM): This index shows the extent of Pareto solutions of an algorithm and is calculated by Equation 24. The higher the value of the DM index, the better the performance of the algorithm.
(4) Spacing Metric (SM): This index indicates the uniformity of distributions of Pareto solutions in the solution space. The value of this index is computed by using Equation 25.

In the above equation,
Results
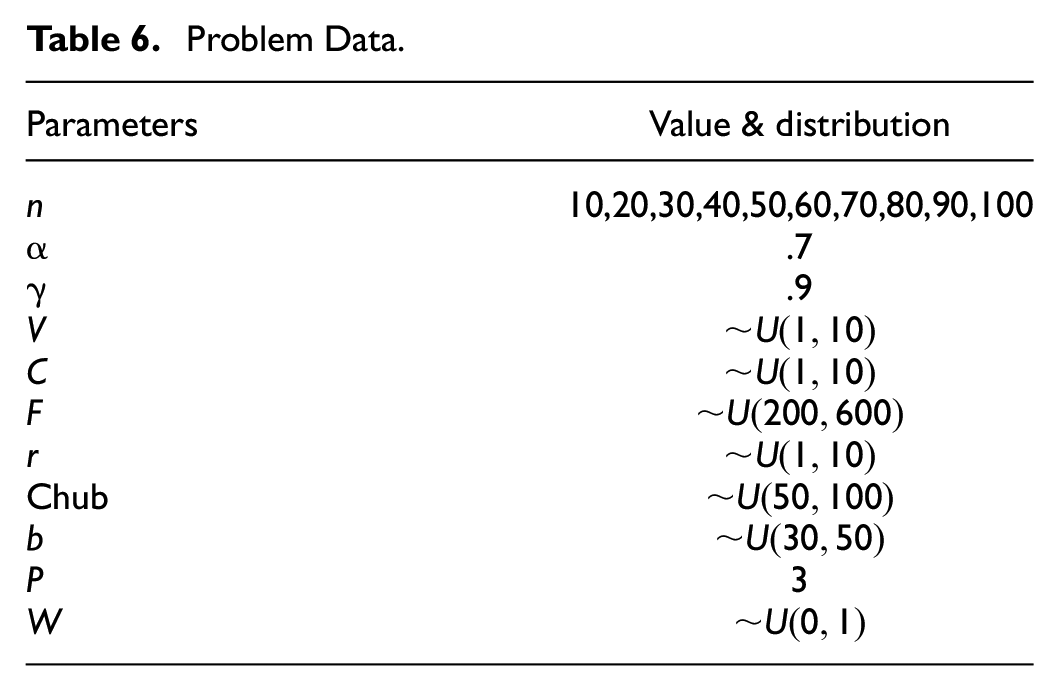
To examine the efficiency of the MOICA algorithm, random data with a specific probability distribution function is used. The data of the problem was generated by the MATLAB software presented in Table 6.
Problem Data.
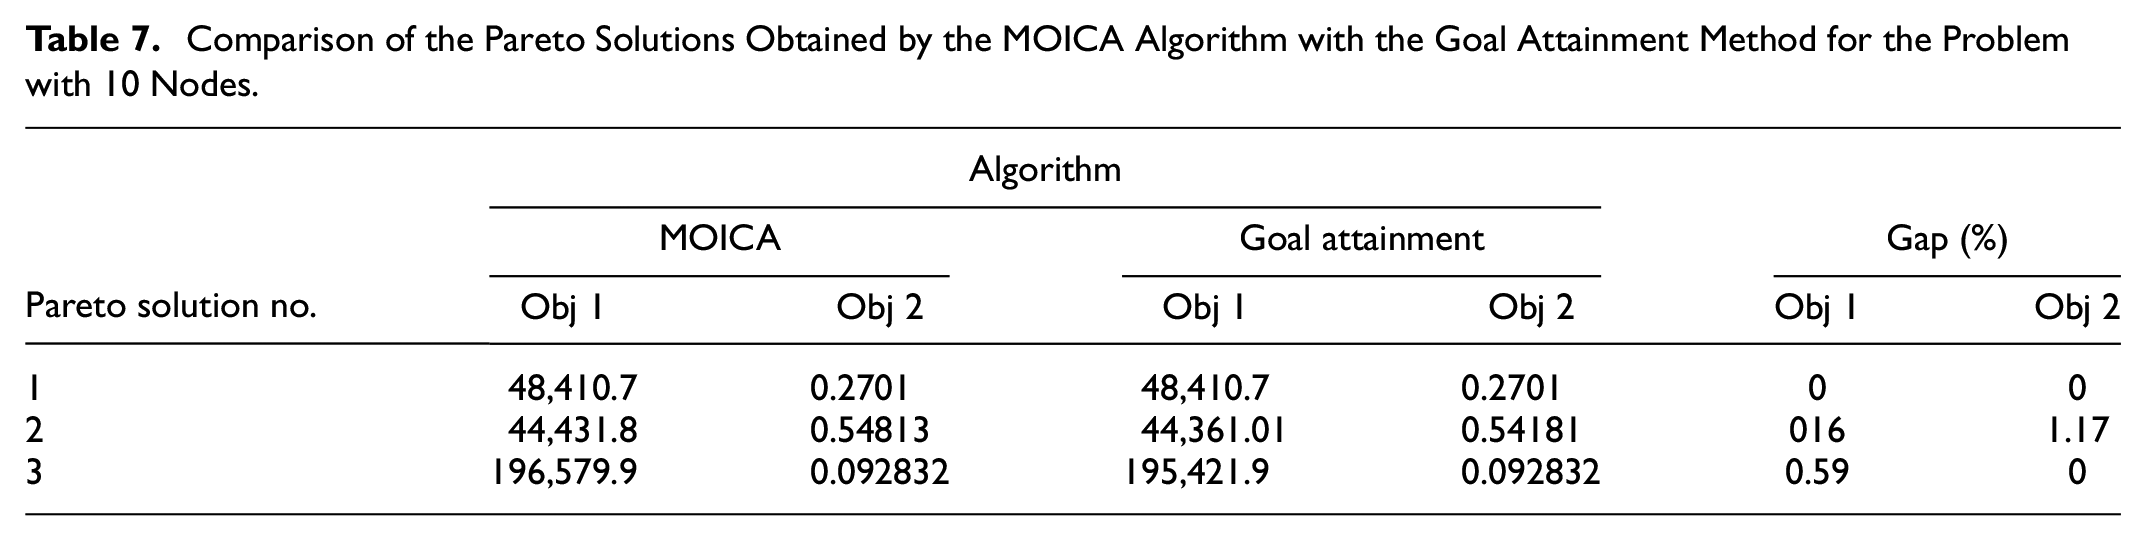
In this paper, to investigate the relative performance of the MOICA algorithm compared to the optimal front, the exact Goal Attainment method was used for the instance problems with the number of 10 and 20 nodes. It should be noted that larger problem sizes will have a longer solution time for this exact method. Tables show the comparison results. As it can be seen, the MOICA algorithm obtained close to optimal solutions. In these tables, the Pareto solutions are compared with each other with the Gap measure calculated by using Equation 26:

Tables 7 and 8 present the comparison of the Pareto solutions obtained by the MOICA algorithm with the solutions obtained by the Goal Attainment method for the problems with 10 nodes and 20 nodes, respectively.
Comparison of the Pareto Solutions Obtained by the MOICA Algorithm with the Goal Attainment Method for the Problem with 10 Nodes.
Comparison of the Pareto Solutions Obtained by the MOICA Algorithm with the Goal Attainment Method for the Problem with 20 Nodes.

Figures 4 and 5 depicts one of the Pareto solutions obtained by the MOICA algorithm for the instance problems with 10 and 20 nodes, respectively.
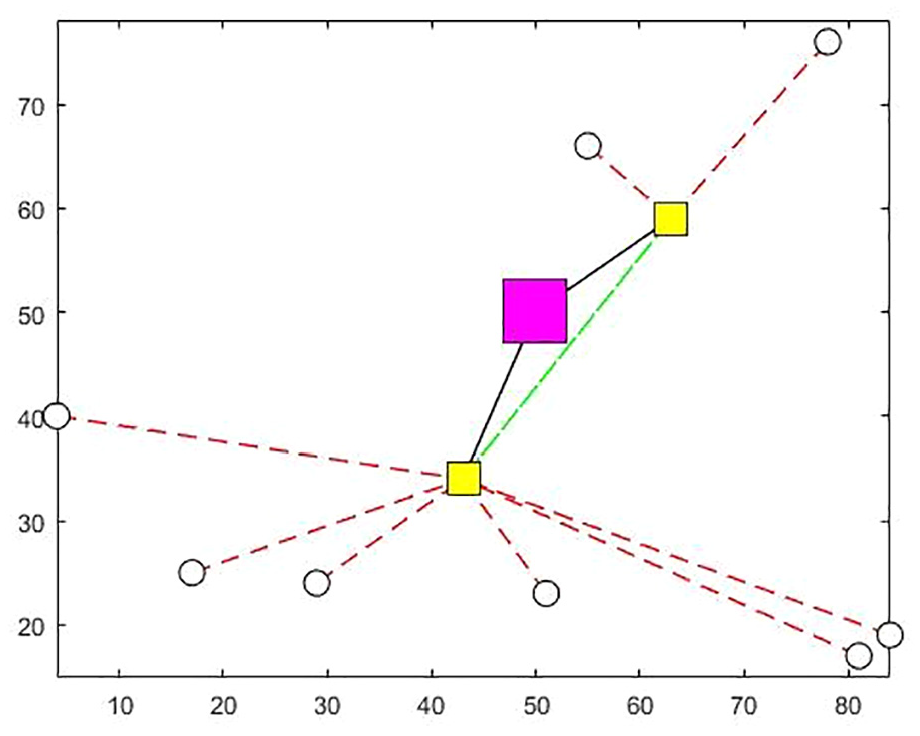
The Pareto solution obtained for the designed hub network problem with 10 nodes.
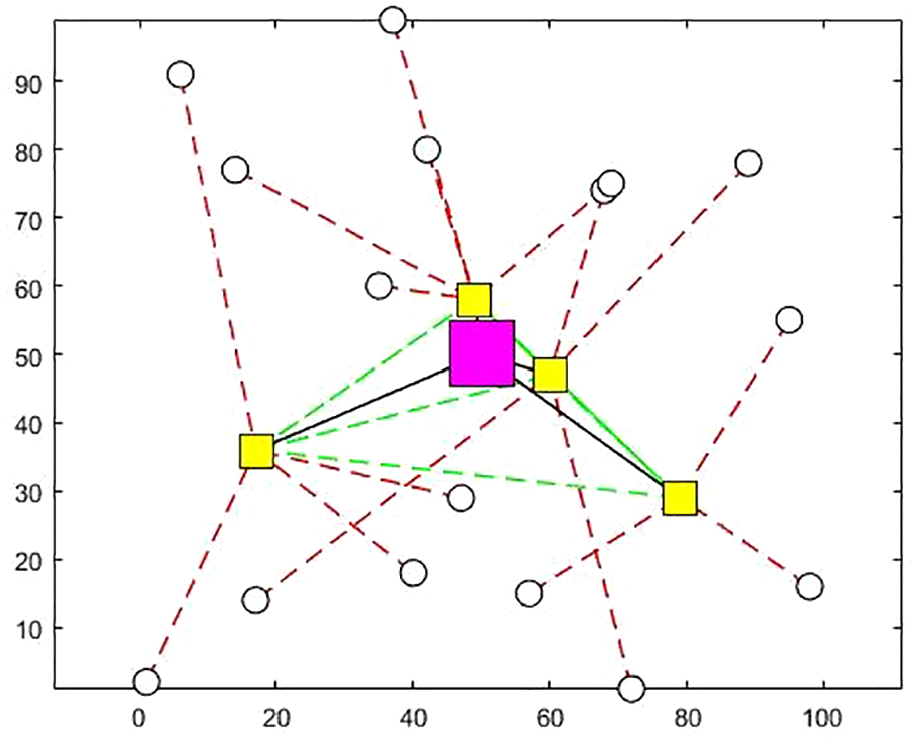
The Pareto solution obtained for the designed hub network problem with 20 nodes.
In order to compare the efficiency of the multi-objective meta-heuristic algorithms, the instance problems with different sizes ranging from 10 to 100 nodes were solved by using both algorithms are executed and the results were compared by using the four aforementioned indexes. The comparison results of the MOPSO and MOICA algorithms are presented in Tables 9 and 10 as well as Figures 6 and 7.
Comparison Results of MOPSO and MOICA Algorithms Based on QM and SM Indexes.

Comparison Results of MOPSO and MOICA Algorithms Based on DM and MID Indexes.

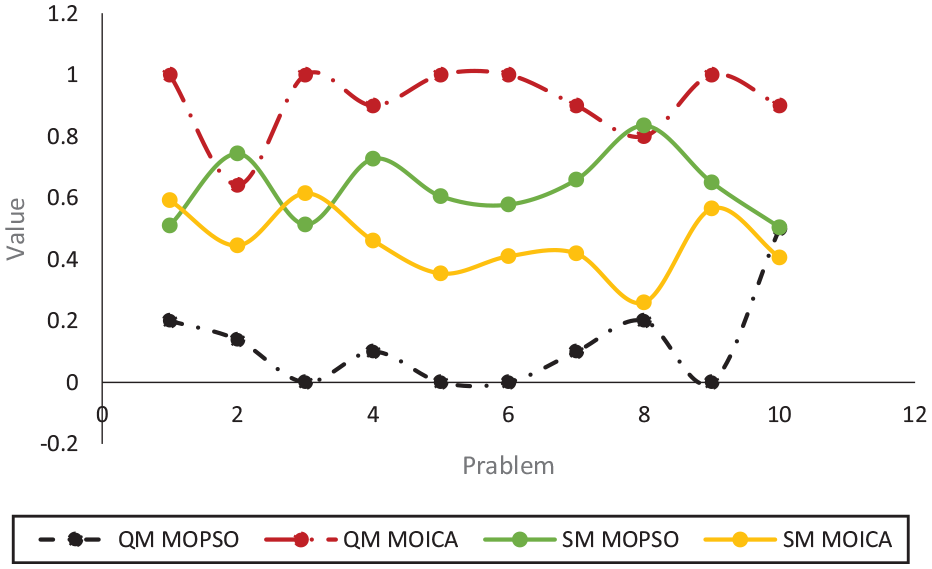
Comparison results of MOPSO and MOICA algorithms based on QM and SM indexes.
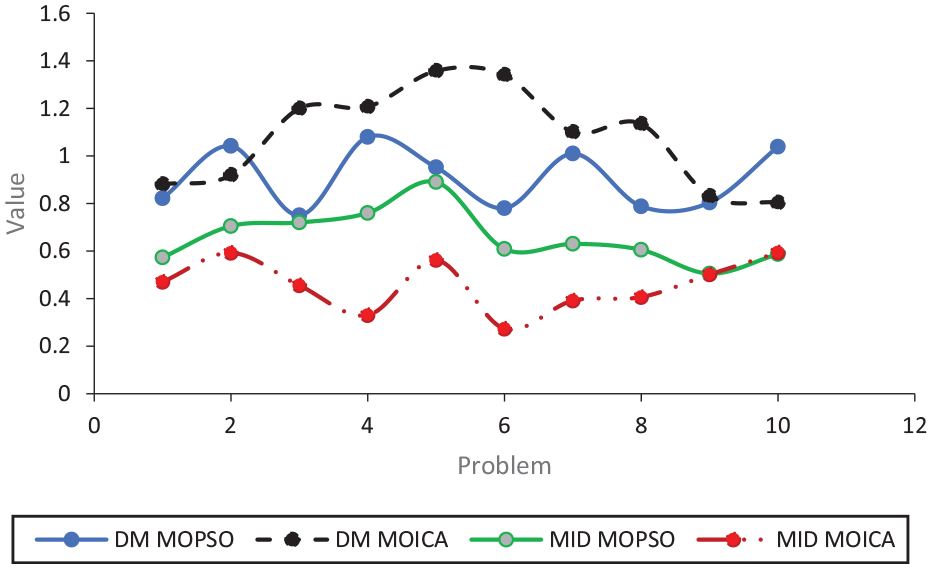
Comparison results of MOPSO and MOICA algorithms based on DM and MID indexes.
As seen in the above tables and figures, the MOICA algorithm obtained better results than the MOPSO algorithm for all of the instance problems in terms of four indexes of QM, SM, DM, and MID.
Due to the fact that MOICA has performed better in terms of all indexes, the statistical analysis is performed to examine the significance/non-significance of this superiority. To evaluate the significant difference between the efficiency and performance of the algorithms proposed in this research, 10 problems have been considered. For this purpose, each algorithm was executed 10 times under the same conditions for each problem, and the average is reported as the solution for each problem in Tables 9 and 10. Then, the statistical analysis is conducted. In this study, the one-way ANOVA test for the equality of the mean of two populations is used. A decision should be made regarding the H0 hypothesis based on the obtained value, that if α ≥ PVALUE, then the H0 hypothesis (no significant difference between the averages of the algorithms) is rejected. However, if α ≤ PVALUE, there is no reason to reject H0. In this test, α is assumed as .05.
As shown in Table 11, PVALUE is equal to .0392, which results in rejecting the H0 hypothesis, hence, there is a significant difference between the performances of two algorithms in terms of the DM index.
The Output of the One-Way ANOVA Test for the DM Index

According to Figure 8, it can be said that the MOICA algorithm is significantly better.

The output of the MATLAB software for the comparison of MOPSO and MOICA in terms of the DM index.
The ANOVA test was performed for the MID, QM, and SM indexes, and the amounts of 0.0007, 0, and 0.002 were obtained for PVALUE, respectively (presented in Tables 12–14 and Figures 9 –11), which show there are also differences between the means of two populations in terms of these indexes as well.
The Output of the One-Way ANOVA Test for the MID Index.

The Output of the One-Way ANOVA Test for the QM Index.

The Output of One-Way ANOVA Test for the SM Index.


The output of the MATLAB software for the comparison of MOPSO and MOICA in terms of the MID index.

The output of the MATLAB software for the comparison of MOPSO and MOICA in terms of the QM index.

The output of the MATLAB software for the comparison of the MOPSO and MOICA in terms of SM index.
Case Study
In this section, Digikala Group has been considered as a case study which is an online store in Iran and has more than 5.4 million visitors daily. More than 9.7 million different goods have been offered for sale by 308 thousand suppliers and it has the capacity to process 904 thousand goods per day. Digikala Group includes different departments and collections, some of which are operating inside the platform and some with different topics outside the Digikala platform.
In this case study, 38 cities in three provinces of Iran (Tehran, Hamadan, and Kermanshah) were considered, which have multiple orders. If this company seeks to build a hub to transfer orders to different customers, it will cost between 80,000 and 100,000 U.S. Dollars. The daily flows between hubs and customers usually are between 500 and 1,000. The transportation cost is based on the distance between the cities, which is between 1 and 3 U.S. Dollars for each unit. The hub capacity is between 20,000 and 40,000 units. The discount factor between two hubs is equal to 0.05 and between hub and non-hub nodes is equal to 0.01.
The proposed model was implemented on the case study and the Pareto points are provided in Table 15 and Figure 12. The results show that in order to improve the second objective function value, more hubs should be built, which lead to higher costs. On the other hand, in order to reduce cost, the second objective function should be ignored.
Pareto frontier related to the case study.


Pareto frontier related to the case study.
The results for the Pareto point 2 show that hub number 15 will be built in Shahriar city located in Tehran province, the next hub will be built in Asadabad city located in Hamadan province and finally hub number 32 will be built in Kermanshah city, the capital of Kermanshah province. The allocation and flow of materials are presented in Table 16.
Allocation and Flow Between Origin and Destination.

Conclusion
In this research, the literature on HLPs was reviewed. Despite extensive studies on HLPs, there is a lack of sufficient research on problems applicable to the real world. On the other hand, there is an attempt to optimize different problems from different aspects, so that dealing with only one aspect may neutralize other essential aspects in decision-making.
It is obvious that quality criteria are effective in real-world HLPs. Another contribution of the research is the use of four qualitative criteria of service quality, traffic of the covered area, transportation infrastructure and expandability, along with the quantitative criteria that have been used, to calculate the weights of different nodes and using these weights in the objective function of the proposed bi-objective covering HLP.
Also, in most organizations, managerial decision-makers are interested in taking different scenarios into account to choose optimal conditions, so that one scenario cannot be considered better than the other. In other words, many problems have multiple goals that sometimes conflict with each other. Therefore, by considering different objective functions at the same time, various solutions can be presented so that decision-makers can choose the right solution with comparing the existing conditions and different aspects of the problem. Therefore, in this study, the bi-objective single-allocation coverage HLP with limited capacity was investigated in order to minimize costs and environmental risks.
The literature survey revealed that mainly quantitative criteria have been considered for the establishment of hubs in nodes, while in the real world, qualitative criteria are also effective in the location and manner of establishment of hubs. Therefore, another contribution of this research was the use of four aforementioned qualitative criteria along with the quantitative criteria that have been always addressed for calculating the node weights and using these weights in a separate objective function in a bi-objective maximal coverage hub location problem. In addition, due to the fact that in the investigated problem, production facilities (affiliated factories) were built in the hubs to reduce costs, evaluating the environmental risks of the nodes and turning this evaluation into a value to affect the nodes that became hubs were necessary, which was examined in the present study for the first time.
With the growth of population, social welfare, and economic development in recent years, the increase in transportation demand is inevitable. Also, in recent years, there has been growing attention to environmental issues because of the importance of reducing environmental pollution and environmental and social pressures. Transportation sector has destructive impact on the environment such as noise pollution and production of greenhouse gas emission. Hence, the optimization of energy consumption and reduction of environmental pollution in the transportation sector is necessary for continuing affordable services and reducing fuel consumption. A fundamental solution to reduce energy consumption in the transportation of goods is the correct design of transportation networks. In this research, the HLP was investigated to design an efficient hub network. The model was solved by using the Goal Programming method considering small-sized problems for validation. Also, the medium and large size problems were solved using the MOICA and MOPSO meta-heuristic algorithms. In addition, the performance of two algorithms were compared according to the QM, MID, DM, and SM indexes the results indicated that the MOICA algorithm outperformed the MOPSO algorithm for solving the problem in hand.
The following suggestions can be made for further studies: Instead of single allocation, multiple allocation can be considered for the proposed model. In addition, the route limitation may be taken into account. Also, deterministic problem data such as flow rate and cost can be considered non-deterministic. Moreover, the hub coverage problem can be modeled dynamically for different time periods. Furthermore, disruption should be taken into account in the HLPs.
Footnotes
Declaration of Conflicting Interests
The author(s) declared no potential conflicts of interest with respect to the research, authorship, and/or publication of this article.
Funding
The author(s) received no financial support for the research, authorship, and/or publication of this article.
Data Availability Statement
Data sharing not applicable to this article as no datasets were generated or analyzed during the current study.