
Abstract
With the development and popularization of Internet information technology, search engines have become an important channel for the majority of Internet users to find and obtain the information they need. Network attention is an important manifestation of users’ potential demand or realistic concern for a certain thing or phenomenon. The article takes Dujiangyan Scenic Area in Sichuan Province, China as a case study, uses the network search data from the Baidu Index platform from 2017 to 2022, applies geographical spatial statistical analysis methods to study the spatiotemporal characteristics of tourist network attention to Dujiangyan Scenic Area, and explores the factors influencing the spatiotemporal characteristics of tourist network attention. The research found that there is a significant correlation between network attention and changes in the actual number of tourists received. The network attention to Dujiangyan Scenic Area is relatively dispersed in terms of time distribution, with differences in the distribution of tourist network attention over time caused by climate comfort, holiday system, and festival activities. The network attention to Dujiangyan Scenic Area exhibits relatively dispersed spatial distribution characteristics, with the population size of tourist source areas, spatial distance, Internet development level, and economic development level being the main factors influencing the spatial distribution characteristics of tourist network attention. Tourist attractions can enhance the effectiveness of tourism network marketing, develop differentiated tourism marketing and promotion strategies by utilizing the spatiotemporal distribution characteristics of network attention.
Keywords
Introduction
With the rapid growth of China’s national economy and the reform of the holiday system, tourism has become a daily leisure activity for the general public in China. According to official data released by the Chinese Ministry of Culture and Tourism, in 2023, the number of domestic trips in China reached 4.891 billion, with total tourist spending amounting to 4.91 trillion yuan. While the tourism economy is growing rapidly, the uneven distribution of tourism activities in time and space is intensifying. Spatial unevenness in tourism activities is manifested in the existence of popular and less-visited tourist destinations. Temporal unevenness is demonstrated by the differences in peak and off-peak seasons for tourism activities, with tourist influxes occurring during peak seasons while many attractions remain deserted during off-peak seasons. Therefore, analyzing the spatiotemporal distribution characteristics of tourist flows is of great significance for the healthy and orderly development of tourist destinations. With the development and popularization of Internet technology, Internet users can publish and search for the information they need according to their own needs and interests through the network. These network behavioral data not only reflect the degree of attention of Internet users to certain events, but also reflect the public's opinions on certain specific events (Meng & Zhao, 2019). The two main categories of online data are supply-based and demand-based. Supply-based data includes information posted on social media platforms such as Facebook and websites, while demand-based data consists of information actively searched for by individuals online (Ripberger, 2011). Demand-based data on Internet users’ active search for a certain information reflects the Internet users’ online attention to certain information.
Tourism decision-making is a complex process involving information collection, processing, comparison, and judgment. With the popularity of the Internet and mobile smart terminals, online searching has become an essential part of the tourist decision-making process. The Internet provides a platform for tourism service enterprises and individual tourists to release and share tourism information, and tourists use the Internet platform to obtain tourism information and then make tourism purchase decision behavior. Online tourism information plays a crucial role in tourists’ travel decisions and activities (Long et al., 2011). Tourists utilize search engines to find relevant information, including attractions, transportation, weather, and accommodations, ultimately leading to their travel decisions and activities (Feng et al., 2013; Li & Zhang, 2013; Pan et al., 2011). This indicates that search engines wield significant influence among travelers, as the travel information they provide achieves high access rates (Li & Yang, 2010). This phenomenon allows for the exploration of the intrinsic relationship between online search data and travel flows, gradually garnering academic interest in the connection between online search behaviors and travel dynamics (Sun et al., 2017). Tourism cyberspace attention is a precursor to the actual number of tourists (Li et al., 2008), and network attention can be used as an early warning indicator of visitor flow (Wang & Liu, 2014). Internet users who focus on travel information represent potential tourists. Thus, studying the online attention of potential travelers becomes particularly important. The spatial and temporal distribution characteristics serve as the foundation for this research (Lin et al., 2012).
According to the data of the 51st Statistical Report on Internet Development in China released by China Internet Network Information Center (CNNIC) in Beijing, as of December 2022, the number of Internet users in China reached 1.067 billion, an increase of 35.49 million compared with December 2021, and the Internet penetration rate reached 75.6%. Baidu index is a data statistical analysis platform based on Baidu netizen search behavior data, the search data of keywords, can be deeply excavated network public opinion, market demand, user interest and other aspects of the characteristics (Feng, 2022), is the current Chinese Internet the most common public use of network information analysis platform. The network search data of Baidu index has also become an effective tool for tourism researchers to analyze a certain region or thing (Zeng & Zhou, 2019). Dujiangyan is a famous ancient hydraulic engineering project in China, located in the west of Dujiangyan City, Sichuan Province, China. “Qingcheng Mountain & Dujiangyan” is a national scenic area and a 5A-level tourist attraction in China. In the process of development, the Dujiangyan Scenic Area faces several challenges, such as significant differences between peak and off-peak seasons, congestion during holidays, substantial environmental pressure, and inadequate quality of visitor experience. By utilizing online search data to analyze the spatiotemporal distribution characteristics of potential visitors, it can provide valuable insights for forecasting visitor numbers and enhancing tourism marketing strategies. This approach can help balance the discrepancies in tourist flow between peak and off-peak seasons, thereby promoting the sustainable development of the Dujiangyan Scenic Area.
Literature Review
In-depth research on online attention can provide monitoring and forecasting functions for various social activities. Previous studies have used data obtained from search engines such as Google, Yahoo, Baidu, etc., to measure the Internet attention or predict related events in the fields of medicine, economics, and communication. In the field of medicine, Ginsberg et al. (2009) used Google search engine query data to detect influenza epidemics. Ripberge (2011) utilized Google search data with epidemiologically relevant terms to track the spread of infectious diseases. Online search data can contribute to developing additional public health surveillance methods to support the COVID-19 response alongside established approaches (Lampos et al., 2021). In the field of economics, stock market trends are predicted by analyzing changes in Google queries for finance-related search terms (Preis et al., 2013), and the search volume for certain finance-related terms has predictive power for stock market trends (Zhong & Raghib, 2019). In the field of communication studies, search engine attention can effectively reflect changes in public sentiment surrounding unexpected events online (Chen & Lin, 2013). Jia (2015) studied the dissemination patterns of urban emergency event network information based on Baidu Index.
The online search trends of tourist destinations show a significant correlation with the actual number of visitors to that destination. By analyzing tourists’ online search behavior, it is possible to accurately predict the number of visitors (Sidhartha et al., 2017). Önder (2017) found Google Trends Index as a useful tool in improving the accuracy of forecasting tourism demand. Gunter and Önder (2016) utilized 10 Google Analytics website traffic indicators to predict tourism demand in terms of total tourist arrivals in Vienna. Sun et al. (2019) used Baidu Index and Google Trends data to analyze and found that there is a certain correlation between the online attention and the number of tourists in Beijing, and the online attention can predict the number of tourists more accurately. The number of tourists in a city and the online attention they receive have a stable Granger causality relationship, where online attention serves as a precursor to the number of tourists, and the precursor duration of tourist online searches shows a feature that increases as the traffic time increases (Ma et al., 2018). The online attention of tourists in 30 popular tourist cities in China is strongly correlated with visitor traffic in terms of temporal and spatial changes. For every 1% change in the online attention index, the visitor traffic index will increase (or decrease) by 0.611%. For every 10,000 increase (or decrease) in online tourist attention, the visitor traffic will increase (or decrease) by 125.866 thousand people (Ma et al., 2011). Wang et al. (2015) found that the tourist traffic and network attention of several attractions in Hangzhou City, Zhejiang Province, China, have a significant echoing relationship, and there is a significant positive correlation between the tourist traffic of the attractions and the density of network attention. Sun et al. (2017) analyzed the relationship between the Baidu index and the actual number of tourists on PC and mobile, and found that the Baidu index model on mobile has a better explanatory ability for the changes in the actual number of tourists than the Baidu index model on PC.
Based on Baidu index network search data, analyzing the temporal and spatial characteristics and influencing factors of the network attention of tourism destinations has become the mainstream direction of the current tourism network attention research. Nanjing, China’s tourism network attention varies by region and follows the law of distance attenuation. The ranking of tourism network attention and tourist flow shows a certain correlation (Tian et al., 2018). Xiamen’s tourism network attention is focused in the summer, with high weekdays and low weekends. Spatially, it is concentrated in the southeastern coastal area, especially Fujian Province and neighboring provinces and cities (Ding et al., 2018). Wuhan’s tourism network attention shows seasonality and holiday patterns, with a high regional concentration and fluctuation in spatial distribution (Chai et al., 2021). Besides urban tourism destinations, the online attention toward tourist attractions is also a hot research hotspot. The online attention of tourist attractions has a “long peak season and short off-season” compared to actual visitor flow, showing phenomena of “high on weekdays, low on weekends, and spike before golden week” (Lin et al., 2012). The overall online attention toward Huangshan Scenic Area in various Chinese provinces shows a good growth trend, but there are significant differences in attention levels among regions (Li & Dai, 2020). The online attention time of 23 4A-level and above scenic spots in Guangzhou shows a pattern of “high on weekends, low on weekdays” and “long peak season, short off-season” (Yan et al., 2018). The seasonal variation in online attention toward 5A-level scenic spots in Xinjiang is significantly different, with a short and concentrated peak season, long and dispersed off-season, and the high attention areas mainly in Xinjiang and eastern coastal cities (Liang et al., 2021).
Currently, research on the Dujiangyan Scenic Area focuses on tourist service management, including tourism guide design (Wang, 2002), safety within the scenic area (Wang et al., 2017), and tourists’ adaptive behaviors (Rao & Xiong, 2022). Based on an analysis of the features of the scenic area and its resources, Wang (2002) proposed a tourism guidance design plan for the Dujiangyan Scenic Area. Wang et al. (2017) conducted a study on the safety signage system for the Qingcheng Mountain-Dujiangyan scenic area from the perspective of visitor recognition. Rao and Xiong (2022) analyzed tourists’ adaptive behaviors in response to crowded situations in the scenic area using data from mobile app traffic. It is evident that the research on the Dujiangyan Scenic Area primarily emphasizes micro-level tourist service management, while there is still a lack of studies addressing the consumption demands of the scenic area’s tourism market, particularly the macro-scale regional research on the characteristics of tourism demand in Dujiangyan Scenic Area. The online attention of the Dujiangyan Scenic Area is a direct reflection of tourists’ actual attention and potential tourism demand. Given the strong correlation between online attention and actual visitor flow, the analysis of the spatiotemporal distribution characteristics of tourism network attention is of great significance for tourism forecasting, reception, reasonable regulation of visitor flow, and spatial diversion (Wang et al., 2013).
Research Design
Research Methodology
Seasonal Concentration Index
Seasonal concentration index reflects the degree of concentration and the degree of difference of tourism network attention in time. The larger the index is, the higher the seasonal concentration of network attention is. The more the index tends to 0, the more balanced the monthly distribution of network attention is. The formula of seasonal concentration index is as follows, where

Time Distribution Characteristics of Tourism Network Attention Index, 2017 to 2022.

Herfindahl Index
Herfindahl index reflects the dispersion level of tourism network attention in time and space. Herfindahl index takes the value range of 0 to 1, the more the value tends to be close to 1, indicating that the spatial and temporal concentration of tourism network attention is higher. The smaller the value is, indicating that the spatial and temporal distribution of tourism network attention is more dispersed. The formula is as follows, where Pi is the ratio of the total number of network attention of Dujiangyan scenic spots in a certain month or a certain region.

Geographic Concentration Index
Geographic concentration index is used to analyze the spatial distribution characteristics of tourism network attention. The value of Geographic Concentration Index ranges from 0 to 100. The closer the value is to 100, the more tourism network attention is concentrated in one or several regions. The smaller the value of Geographic Concentration Index is, the more spatially dispersed the distribution of tourism network attention is. The formula is as follows, where

Coefficient of Variation
The coefficient of variation reflects the relative equilibrium or degree of difference in the spatial distribution of tourism network attention. The smaller the value of coefficient of variation, the smaller the spatial difference of tourism network attention, and the larger the value of coefficient of variation, the more significant the spatial difference of tourism network attention. The formula is as follows,

Primacy Index
The primacy index reflects the degree of regional concentration of tourism network attention, and P1 and P2 are the network attention of Dujiangyan scenic spot in the largest and second largest regions. The larger the value of P, the more concentrated the spatial distribution of Dujiangyan scenic spot network attention. The calculation formula is as follows:

Geographic Detector
The geographic detector is mainly used to measure the explanatory power of various influencing factors on the spatial differentiation of the research object, revealing the influencing factors and the interaction of multiple factors (Wang et al., 2010). The study uses the factor detection of the geographic detector to detect the explanatory power of each factor on the spatial differentiation of network attention in the Dujiangyan Scenic Area. The formula for geographic detection is as follows:

In the formula, q is the detection force value of the detection factor, n and
Data Source
The article is based on the Baidu search index platform, using “Dujiangyan” as the search keyword to daily count the online search volume between January 1, 2017, and December 31, 2022. Then, summarize the search data by month and year respectively, as the basic data for the time distribution characteristics of Dujiangyan scenic spot’s online attention. Utilizing Baidu Index’s custom time period and regional filtering functions, using provinces as spatial units, respectively calculate the online search volume of 31 mainland China regions from 2017 to 2022 (data for Hong Kong, Macau, and Taiwan are missing), as the basic data for the spatial distribution characteristics of Dujiangyan scenic spot’s online attention. The factors influencing the online attention index include population size, level of economic development, residents’ purchasing power, etc. Data is derived from the “China Statistical Yearbook” published by the National Bureau of Statistics from 2017 to 2022. The level of Internet development data is sourced from the “China Internet Development Status Statistics Report.” The spatial distance between Dujiangyan Scenic Area and various provinces is calculated using Baidu Maps. Based on Baidu search data for the Dujiangyan Scenic Area from 2017 to 2022, this article takes 31 provincial spatial units in mainland China as research objects to analyze the spatiotemporal distribution characteristics of online attention to the Dujiangyan Scenic Area, exploring the spatiotemporal differences in tourism demand of the Dujiangyan Scenic Area from a regional macro perspective. It aims to reveal the temporal and spatial differentiation pattern of online attention to the Dujiangyan Scenic Area, thereby providing useful insights for online marketing of the Dujiangyan Scenic Area.
Research Content
Characterization of Time Distribution of Network Attention
Annual Distribution Characteristics of Dujiangyan Scenic Area Network Attention
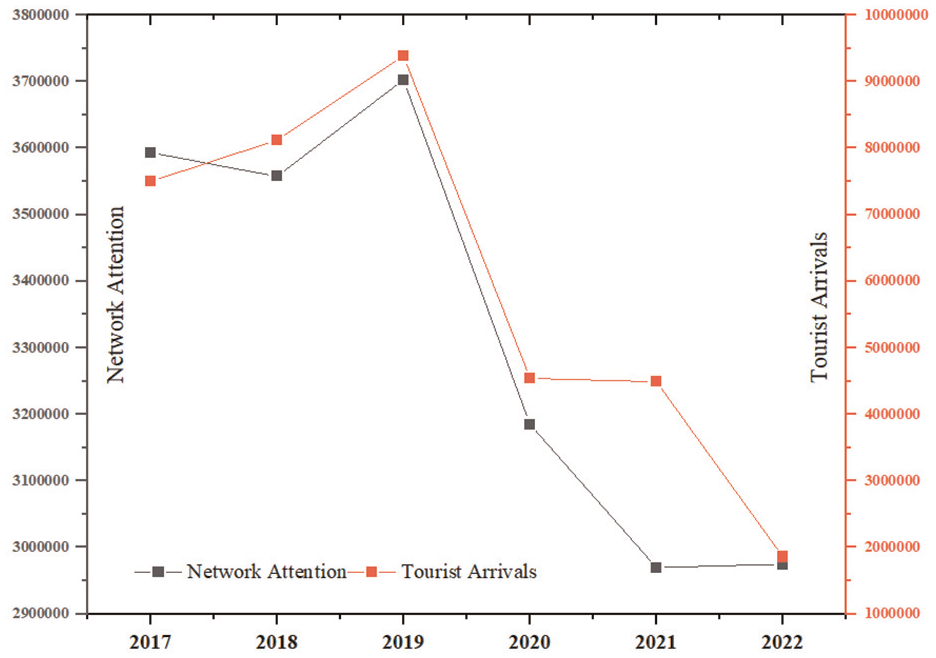
The network attention of Dujiangyan Scenic Area is counted in terms of years, and the annual trend of network attention is shown in Figures 1 and 2. 2017 to 2022, the network attention index of Dujiangyan Scenic Area is 3593173, 3557577, 3702573, 3184825, 2969693, and 2974731, respectively. During this period, there were significant fluctuations in the network attention toward Dujiangyan Scenic Area. From 2017 to 2018, there was a slight decrease in network attention, followed by a significant increase from 2018 to 2019, reaching the peak in 2019. Due to the impact of the COVID-19 pandemic on tourist travel, the network attention to Dujiangyan Scenic Area dropped significantly in 2020, with a 14% decrease compared to 2019. From 2020 to 2021, the network attention continued to decline. In 2021 to 2022, there was a slight increase in network attention toward Dujiangyan Scenic Area. 2017 to 2022, the visitor reception of Dujiangyan Scenic Area is 7.5, 8.12, 9.39, 4.54, 4.49and 1.86 million respectively. As can be seen from Figure 1, the annual trend of tourists’ reception in Dujiangyan Scenic Area has a significant correlation with the annual distribution trend of network attention, and the correlation coefficient between network attention and tourists’ reception reaches 0.945, and the R2 value of Goodness of Fit reaches 0.893, which further verifies the scientificity of the prediction of tourists’ reception using network attention.
Trend of annual distribution of tourism network attention from 2017 to 2022.

Trend of intra-year distribution of tourism network attention, 2017 to 2022.
From Figure 2, it can be seen that the distribution trend of online searches for the Dujiangyan Scenic Area has a significant similarity over the course of the year, showing clear bimodal peaks. Apart from the two peak values, other monthly attention values show clear low-value and moderate-value ranges, indicating a dispersed temporal pattern. From 2017 to 2019, the annual distribution trend of network attention for the Dujiangyan Scenic Area is quite similar. August and October are the two peaks of online searches each year, while the months with the lowest network attention are in the winter. The months with the lowest network attention for the Dujiangyan Scenic Area from 2017 to 2019 are January, December, and January. The Dujiangyan Scenic Area shows a significant upward trend in online searches in January to March, June to August, and September to October, with online attention peaking in August before declining. The decline between August and September is substantial, with a subsequent rise in September reaching a secondary peak in October, after which network attention remains low. From 2020 to 2022, the annual distribution trend of network attention for the Dujiangyan Scenic Area is also quite similar, with July and October being the two peaks of searches each year. There is a notable increase in online searches from February to May, with a slight decrease in May to June, followed by a rapid increase in June to July reaching a peak in July. There is a significant decline from July to September, with a rise in September peaking in October before declining until the following February. From 2020 to 2022, the network attention for the Dujiangyan Scenic Area peaks in July, with February being the month with the lowest network attention.
Monthly Distribution Characteristics of Network Attention
The network attention of Dujiangyan Scenic Area in 2017 to 2022 is summarized by month to analyze the monthly distribution characteristics of network attention of Dujiangyan Scenic Area, as detailed in Table 1. It can be seen that the network attention of Dujiangyan Scenic Area shows a bimodal distribution in the month, July-August is the highest peak of network attention of Dujiangyan Scenic Area, and the network attention is much higher than other months.October is another peak of network attention of Dujiangyan Scenic Area, and due to the influence of the National Day, the number of tourists' outing is higher in October. Overall, the network attention of Dujiangyan scenic spot is at the lowest value of the whole year in January-February and November-December. Starting from February, the network attention toward Dujiangyan Scenic Area significantly increases, reaching its peak in July and August. From September to November, there is a trend of rapid growth followed by a sharp decline in online attention toward Dujiangyan Scenic Area. In October, there was a peak in search activities, however, in November, there was a noticeable decline in online attention. The online search trends remained relatively stable from November to December.
According to the monthly data of Dujiangyan Scenic Area’s network attention, the ratio of each month’s network attention to the average value of monthly attention is calculated. As can be seen from Figure 3, the network attention value of Dujiangyan Scenic Area in January, February, November and December is significantly lower than the average value of monthly attention, and the ratio between the network attention and the average value of monthly attention in January, February, November and December is 0.838, 0.861, 0.899, and 0.904, respectively, which can be classified as the off-season of Dujiangyan Scenic Area’s network attention in the four months. March, April, May, June and September, the proportion of network attention to the average value of monthly attention to 0.978, 1.004, 1.028, 1.027, 0.978, the proportion value is close to 1, can be divided into these five months for Dujiangyan Scenic Area network attention to the flat season. in July, August and October, the proportion of network attention to the average value of monthly attention to 1.190, 1.188, 1.104, the proportion value are in the range of 1.190, 1.188, 1.104, and the ratio values are all above 1.1, which is the peak season of Dujiangyan Scenic Area network attention.

Monthly distribution characteristics of tourism network attention, 2017 to 2022.
The seasonal concentration index and Herfindahl index of Dujiangyan Scenic Area network attention are calculated to further analyze the time distribution characteristics of Dujiangyan Scenic Area network attention. The results show that from 2017 to 2022, the seasonal concentration indexes of network attention for Dujiangyan scenic area were 1.2901, 0.9922, 1.3692, 1.0523, 1.0764, and 0.8693 respectively. The seasonal concentration indexes are generally small, indicating that the network attention for Dujiangyan scenic area is relatively dispersed over time. The seasonal concentration indexes for 2017 and 2019 are relatively high, with higher network attention in July and August. The Herfindahl index of network attention for Dujiangyan scenic area shows little difference from 2017 to 2022, maintaining around 0.08. This further indicates that the monthly distribution of network attention for Dujiangyan scenic area is relatively dispersed, with no clear trend of concentration in one or a few months.
Characterization of the Spatial Distribution of Network Attention
Baidu Index can identify the spatial source of network search information flow based on users’ IP addresses, and statistically analyze the spatial distribution characteristics of Dujiangyan Scenic Area’s network attention in 31 regions in Mainland China from 2017 to 2022. As illustrated in Figure 4, the region with the highest network attention to Dujiangyan Scenic Area in 2017 to 2022 is Sichuan Province, with a cumulative network attention index of 3,618,606, accounting for 18.11% of the overall national attention value. Dujiangyan Scenic Area is located in Chengdu, Sichuan Province, China, and residents in Sichuan Province are the core source market of Dujiangyan Scenic Area, maintaining the highest network attention to Dujiangyan Scenic Area. Guangdong, Beijing, Jiangsu, Shandong and Zhejiang have a better level of economic development and are the main tourist source outputs in China. The willingness to travel and the travel rate of local residents are at a higher level in the country, and they also maintain a high level of online attention to the Dujiangyan Scenic Area in the 2nd-6th places. Due to the geospatial location of Chongqing and Shaanxi, which are close to Sichuan, the transportation cost and time cost for residents to travel are lower, and the Dujiangyan Scenic Area also maintains a high level of network attention. The region with the lowest network attention to Dujiangyan Scenic Area is Xizang, the proportion of network attention is only 0.93%. Ningxia, Qinghai, Hainan, Xinjiang, Inner Mongolia, Jilin and other regions are farther away from Sichuan in terms of spatial distance, and the level of economic development of these regions is also in the middle of the lower position in the country, and the network attention to Dujiangyan Scenic Area is in the back of the position.
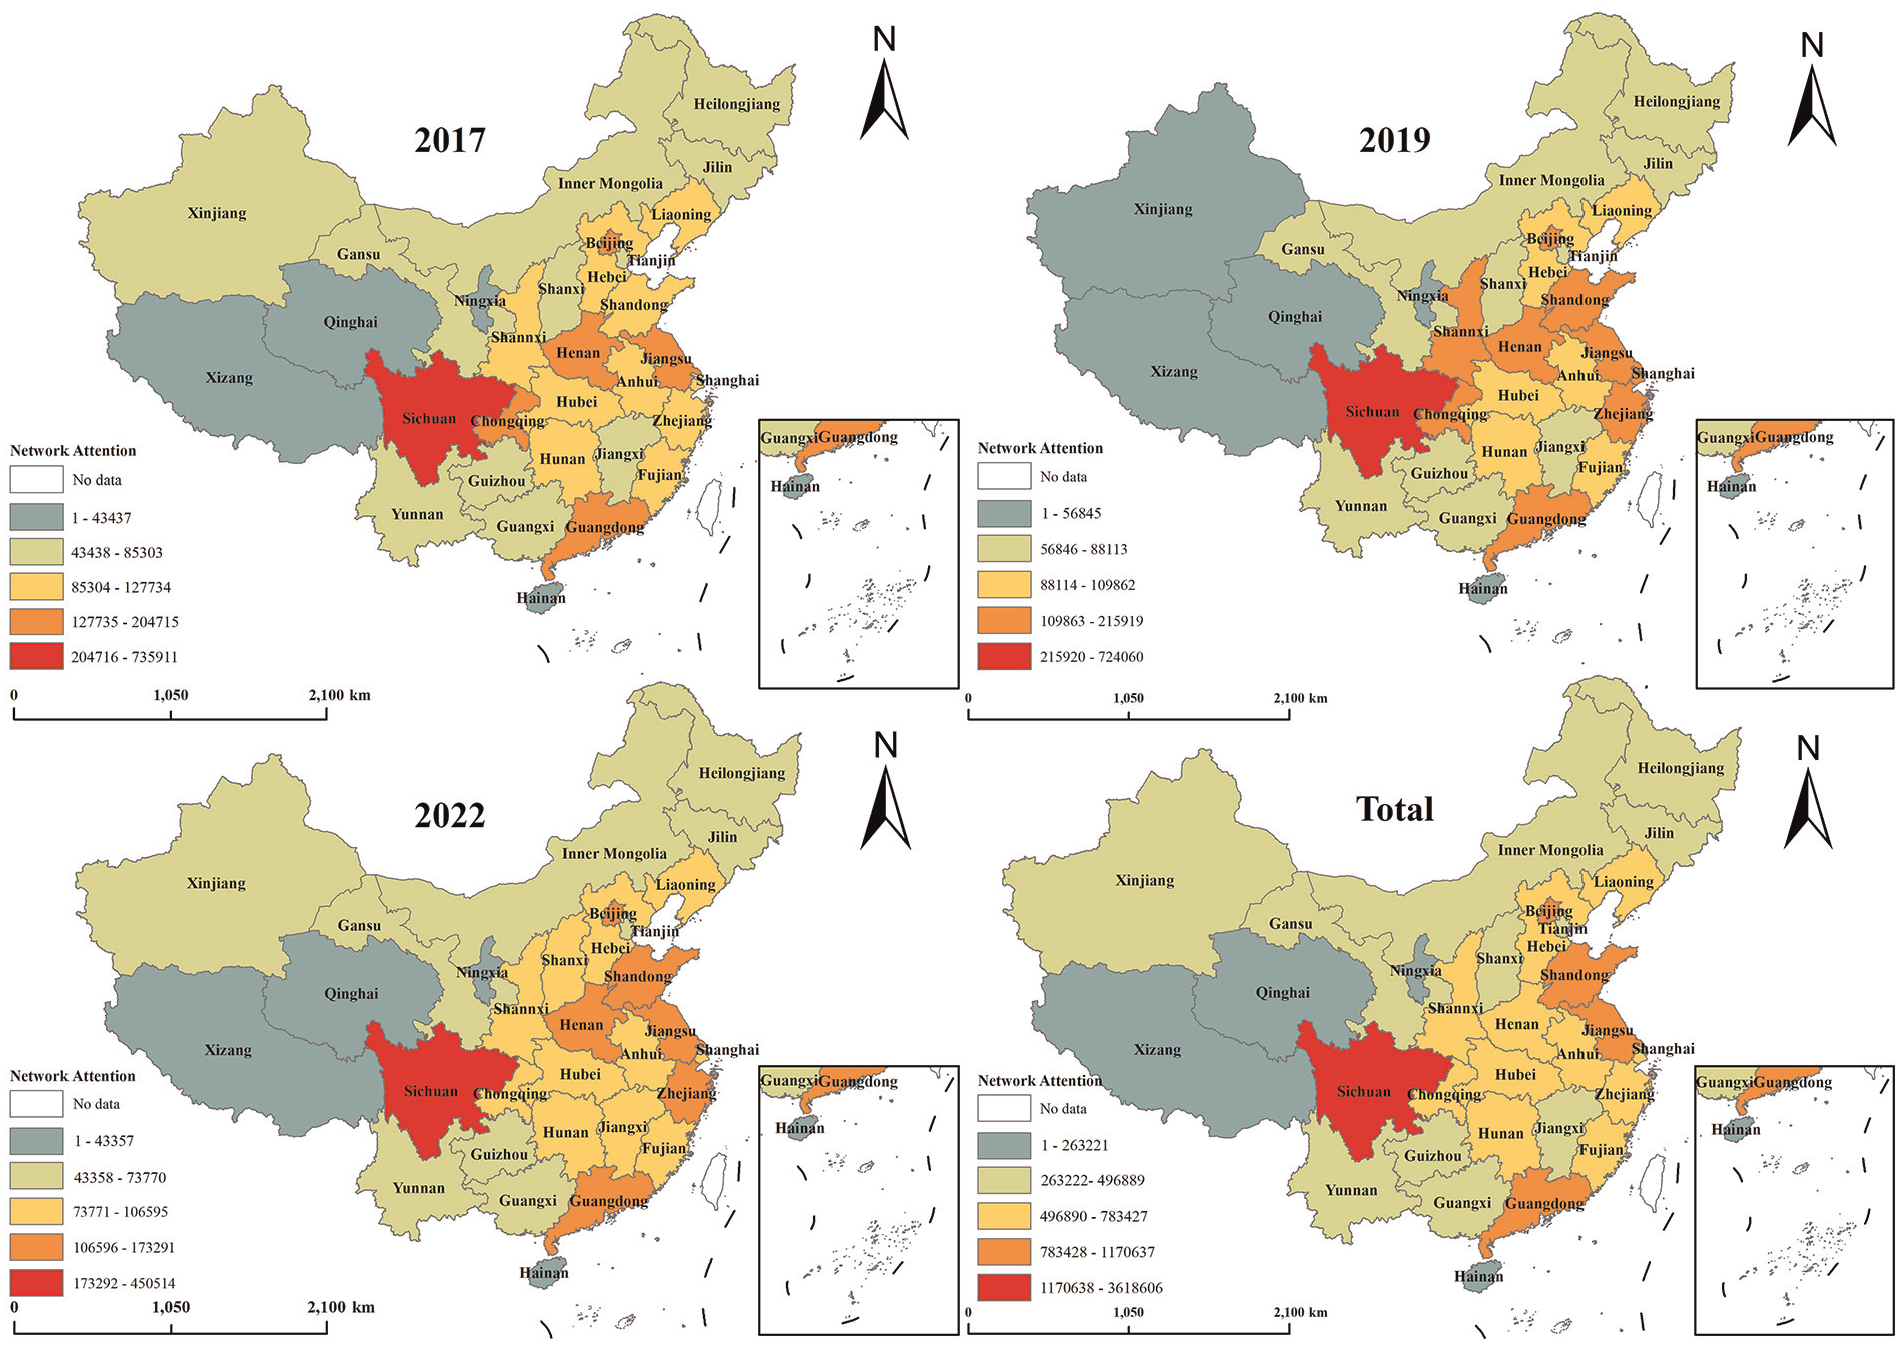
Spatial distribution of scenic area tourism network attention Index, 2017 to 2022.
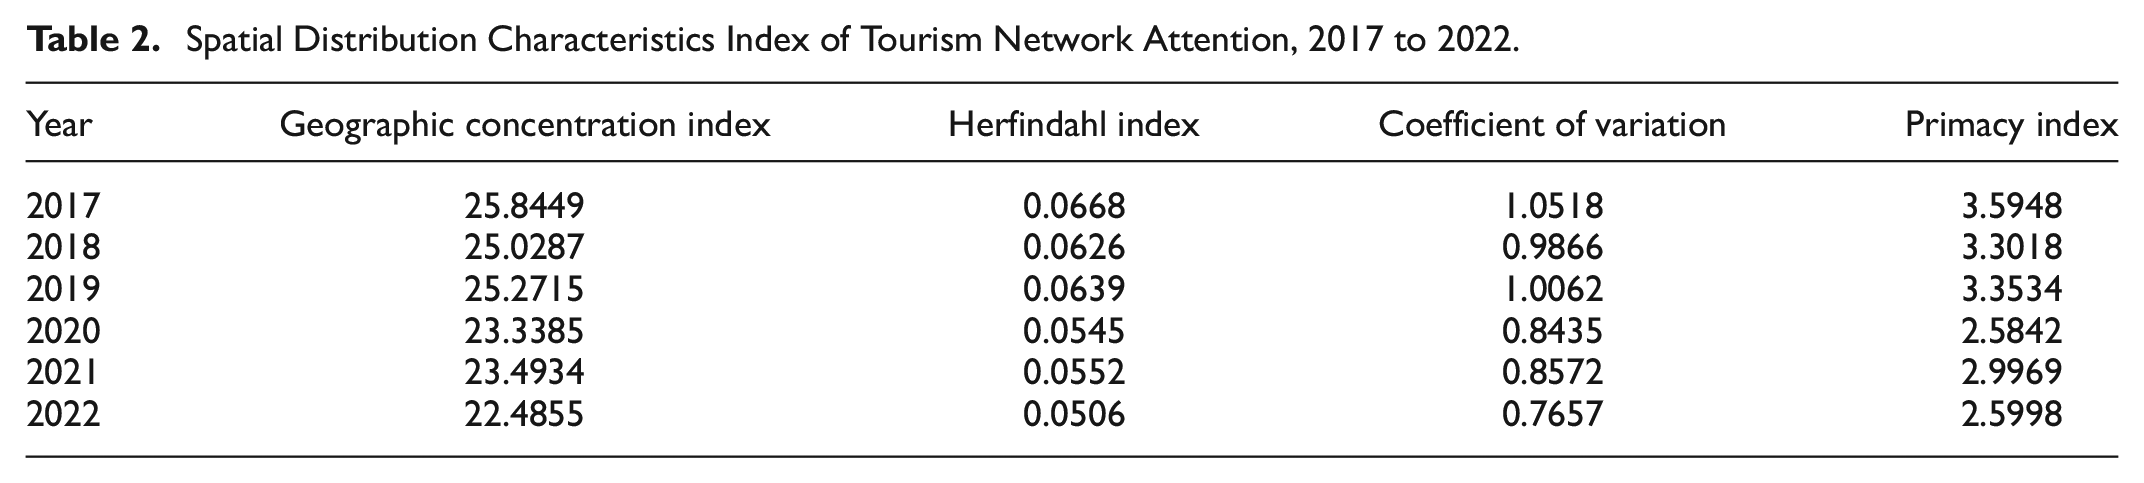
Using the Geographic Concentration Index (G), the Gini Coefficient (H), the Primacy Index (P), and the Coefficient of Variation (CV) to analyze the spatial differentiation characteristics of online attention to the Dujiangyan Scenic Area. Detailed results are presented in Table 2. It was found that from 2017 to 2022, the Geographic Concentration Index, Gini Coefficient, Primacy Index, and Coefficient of Variation of online attention to the Dujiangyan Scenic Area showed an overall decreasing trend. The geographic concentration index decreased from 25.8449 to 22.4855, indicating that the spatial distribution of network attention in Dujiangyan scenic area showed a more decentralized trend of change. The Herfindahl coefficient is smaller in 5 years, 0.0668 in 2017, and decreases to 0.0506 in 2022, indicating that the regional spatial concentration of Dujiangyan Scenic Area network concern is decreasing. The coefficient of variation of Dujiangyan Scenic Area network concern is 1.0518 in 2017, and decreases to 0.7657 in 2022, which decreases more obviously, indicating that the regional difference of Dujiangyan Scenic Area network concern is gradually shrinking. In 2017 to 2022, the first place index of Dujiangyan Scenic Area network concern is between 2.59 and 3.59, indicating that the difference between the top two regions of Dujiangyan Scenic Area network concern is larger, and the trend of network concern in the first place is more obvious. 2017, Dujiangyan Scenic Area network concern is sorted by the top ten regions of the national network concern. The proportion of the top ten regions accounting for the national network attention is 55.33%. The proportion of 2018 is 57.09%, the proportion of 2019 is 56.92%, the proportion of 2020 is 57.02%, the proportion of 2021 is 54.36%, and the proportion of 2022 is 53.44%. It can be seen that, in addition to Sichuan Province, other regions have smaller differences in the network attention to Dujiangyan Scenic Area, and the spatial distribution is more balanced.
Spatial Distribution Characteristics Index of Tourism Network Attention, 2017 to 2022.
Analysis of Influencing Factors on the Temporal and Spatial Distribution of Network Attention
Analysis of Influencing Factors on the Time Distribution of Network Attention
Climate comfort and vacation system are important factors affecting the temporal distribution of tourism network attention (Yan et al.,2018). From the monthly distribution of online attention to the Dujiangyan scenic area from 2017 to 2022, it can be seen that the months of January, February, November, and December are at the lowest levels of attention throughout the year. These four months fall in late autumn and winter among the four seasons, with lower temperatures leading to decreased willingness of tourists to travel, thereby affecting the online search behavior of residents from tourist source areas. From March to May is spring, as the weather gradually warms up, the number of tourists for spring outings starts to increase. Additionally, during this period, there are two national holidays, Tomb-Sweeping Day and Labor Day. As a kind of tourist attraction, the organization of festivals will cause an increase in the number of tourists in a short period of time. Dujiangyan organizes the Water Release Festival in April every year, which causes an increase in Internet searches during this period of time. Internet searches in June slightly decrease compared with those in May. July and August are in the summer, which are the two months of the highest Internet interest in the scenic spot of Dujiangyan. The summer temperature of Dujiangyan Scenic Area is relatively cooler than that of the surrounding areas, which is a good place for summer vacation and a peak season for Dujiangyan Scenic Area, and tourists increase the frequency of searching for tourism information about Dujiangyan. At the same time, July and August are also the summer vacations of Chinese universities, middle schools, elementary school and other schools, and the demand for the tourism market is strong. October is the month in which the traditional Chinese Mid-Autumn Festival and National Day are located, and the more generous vacation provides time guarantee for tourists to travel to Dujiangyan. After October, along with the drop of temperature and the decrease of festivals, the Dujiangyan scenic spot enters into the off-season, and the attention of online searches decreases significantly. Overall, climate comfort, vacation system, and festival activities are the main factors affecting the time distribution of Dujiangyan Scenic Area’s network attention.
Analysis of Influencing Factors on the Spatial Distribution of Network Attention
Tourists’ online attention to destinations is the result of active information searching behavior on the Internet to reduce the risk of decision-making under the constraint of demand (Wang, 2001). Obviously, the factors that constrain residents’ demand for tourism and Internet search all have an impact on Internet attention. The level of Internet development in the origin is one of the main factors affecting Internet users’ Internet search (Zhang & Zhou, 2018), the population size and purchasing power of the tourism origin is an important factor affecting tourism demand (Xi, 2011), the purchasing power of residents in the tourism origin is closely related to the level of economic development of the locality, and factors such as the level of economic development, the size of the population, and the distance to the destination have been proven to have an impact on the Internet attention in the existing literature (Chai et al., 2021; Liang et al., 2021; Yan et al., 2018). Therefore, selecting Internet development level, economic development level, purchasing power of residents, population size, and spatial distance as influencing factors, calculating the correlation between each influencing factor and the online attention to the Dujiangyan Scenic Area using the Pearson correlation coefficient, and using a geographical detector to calculate the strength of the effects of each influencing factor.
From Table 3, it can be seen that spatial distance has the greatest impact on the spatial distribution of network attention to the Dujiangyan Scenic Area, with a detection value of .850 and a correlation coefficient of −.405. This indicates that the closer the spatial distance between the tourist source and the Dujiangyan Scenic Area, the higher the network attention of residents from the tourist source to the Dujiangyan Scenic Area. Tourism activities are manifested spatially as the transfer and flow of tourists from the tourist source to the destination. The cost of tourist flow transfer between spatially adjacent areas is low, leading to more frequent occurrence of tourism activities and consequently generating a higher frequency of tourism network searches. The influence of population size ranks second only to spatial distance, with a detection value of .584 and a correlation coefficient of .484. Population size, as an important factor influencing tourism demand, reflects the potential number of tourists in the Dujiangyan Scenic Area tourism market. The level of Internet development and economic development in the source of tourists significantly affects the spatial distribution of attention to the network. The Pearson correlation coefficients are .484, .505, .419, .474, and the detection values q are .397, .298, .272. Network attention as a result of the online information search behavior of potential tourists, the higher the level and popularity of Internet development in the source of tourists, the higher the online search volume. The generation of tourism consumption behavior requires disposable income and leisure time as the basis. Regions with higher economic development levels have a larger scale of residents traveling, such as Guangdong, Beijing, Jiangsu, Shandong, Zhejiang, and other regions with relatively high economic development levels domestically in China. The attention to the network in the Dujiangyan Scenic Area also ranks high. Although residents’ purchasing power is also an important factor influencing tourism demand, the choice of tourism consumption is diverse and not limited to specific things or destinations. There is no significant impact on the spatial distribution of network attention to the Dujiangyan Scenic Area.
Detection Results of the Causes of the Spatial Distribution of Network Attention.

p < .05. **p < .01.
Conclusion and Discussion
Conclusions
The article is based on the Baidu search data of the Dujiangyan Scenic Area from 2017 to 2022. The study takes the 31 provincial spatial units in mainland China as the research objects, analyzing the network attention characteristics of the Dujiangyan Scenic Area from both temporal and spatial perspectives. It explores the factors influencing the spatiotemporal distribution characteristics of the network attention on the Dujiangyan Scenic Area to provide theoretical guidance for its tourism marketing. The study draws the following conclusions:
(1) The network attention of the Dujiangyan Scenic Area shows significant fluctuating trends over time. From 2017 to 2019, the network attention of the Dujiangyan Scenic Area showed an increasing trend. In 2020, due to the impact of the COVID-19 pandemic on tourist travel, the network attention decreased significantly. The network attention of the Dujiangyan Scenic Area exhibits a bimodal distribution by month, with July and August being the peak months of network attention and October being another peak month. The annual distribution trend of network attention shows a significant correlation with the annual variation trend of actual tourist reception volume. Months with high network attention are usually the peak tourist seasons of the Dujiangyan Scenic Area. January to February and November to December are considered the off-peak seasons for network attention, while March to June and September are the shoulder seasons, and July-August and October are the peak seasons. Similar to existing literature (Hao & Zhao, 2019; Ji et al., 2020), the temporal distribution of network attention for the Dujiangyan Scenic Area is mainly influenced by factors such as climate comfort, holiday system, and festival activities.
(2) The network attention of Dujiangyan scenic spot shows a relatively dispersed distribution pattern in space. Sichuan province has the highest network attention, with Guangdong, Beijing, Jiangsu, Shandong, Zhejiang, Shanghai, Henan, Shaanxi, Chongqing, and other areas maintaining a high level of network attention for Dujiangyan scenic spot. Factors such as spatial distance, population size, Internet development level, and economic development level are the main factors affecting the spatial distribution of network attention. This is consistent with the research findings in existing literature (Ding et al., 2018; Xiao & Hu, 2022; Yan et al., 2018). Due to the lack of specificity in the spatial direction of tourism consumption demand, residents’ purchasing power has a non-significant spatial impact on network attention. From 2017 to 2022, the spatial distribution of network attention for Dujiangyan scenic spot shows a more dispersed trend, with the degree of regional concentration of network attention decreasing and the difference in network attention between different regions narrowing. The trend of network attention being concentrated in the leading area (Sichuan province) for Dujiangyan scenic spot is more pronounced. Apart from Sichuan province, other regions show relatively small differences in network attention toward Dujiangyan scenic spot.
Discussions
(1) By utilizing the temporal distribution characteristics of online attention, the effectiveness of tourism online marketing can be enhanced. The temporal distribution characteristics of online attention reflect the potential tourism consumption demands of residents from different source markets at different times. It is important to strengthen marketing efforts during the peak tourism season each year, by increasing the frequency of tourism marketing and promotion during the period from July to October annually. In conjunction with the summer resort tourism products at Dujiangyan Scenic Area, precise marketing targeting families, parent-child groups during summer vacation, and educational tours should be carried out. Emphasis should be placed on advance marketing before holidays, such as International Labor Day, National Day, and Chinese New Year, by disseminating tourism marketing information early. Effective marketing of festival activities during the tourism off-season can be achieved by organizing unique themed cultural tourism events and promoting them across various media channels. Alongside corresponding price incentives, the online attention and attraction of potential tourists to Dujiangyan Scenic Area can be enhanced. It is crucial to update tourism online marketing content at different times, improving the temporal alignment of tourism online marketing promotions and adjusting marketing strategies promptly based on changes in climate comfort.
(2) Based on the spatial distribution of online attention, differentiated tourism marketing and promotion strategies are formulated. The spatial distribution characteristics of online attention reflect the spatial distribution of the potential target tourist market of the scenic area. For regions with high attention such as Guangdong, Beijing, Jiangsu, Shandong, Zhejiang, Shanghai, and Henan, the focus should be on marketing and promotion efforts. It is essential to maintain high attention to the Dujiangyan Scenic Area in these regions, as well as to increase the conversion rate from online attention to actual offline tourism consumption. For geographically neighboring regions such as Chongqing and Shaanxi, in addition to tourism online marketing channels, advertising can also be posted at transportation hubs, highways, and other locations. Alternatively, conducting offline tourism promotion activities in the area can attract residents of surrounding provinces and cities to visit the Dujiangyan Scenic Area. Emphasis should be placed on the role of online platforms in tourism marketing, enhancing the construction of marketing channels on the Internet. Utilizing social media, short videos, tourism websites, video websites, and other media for dissemination, to expand the market audience for tourism marketing, enhance the visibility and attractiveness of the Dujiangyan Scenic Area, and cultivate new tourist source markets.
Limitation and Prospects
The article analyzed the temporal and spatial characteristics of the tourism market demand of the Dujiangyan Scenic Area from the perspective of online attention. It not only provides guidance for the tourism marketing and reception management of the Dujiangyan Scenic Area, but also enriches and expands the content of online attention research. However, there are some shortcomings in the article that need to be improved. Firstly, due to the inability to accurately distinguish between the names “Dujiangyan Scenic Area” and “Dujiangyan City,” the article uses “Dujiangyan” as a search keyword to refer to the Dujiangyan Scenic Area, which may not completely cover the online attention of the Dujiangyan Scenic Area. It can be improved by adding vocabulary highly related to the Dujiangyan Scenic Area for retrieval to increase the breadth of data collection. Secondly, when online users search for tourist information about the Dujiangyan Scenic Area, they may use search engines other than Baidu. The article only selects Baidu search index as the basic data, which lacks comprehensiveness. In the future, data from various search engines can be compiled for comparative analysis. Lastly, due to data limitations, the relationship between visitor reception and online attention before and after holidays was not analyzed. This relationship is of great practical significance for predicting and warning about tourist flows at the scenic area.
Footnotes
Declaration of Conflicting Interests
The author declared the following potential conflicts of interest with respect to the research, authorship, and/or publication of this article: It is declared by the authors that this article is free of any conflict of interest.
Funding
The author disclosed receipt of the following financial support for the research, authorship, and/or publication of this article: This research is funded by the Philosophy and Social Science Planning Program in Sichuan Province (SC23E032) and the Philosophy and Social Science Key Research Base Program in Sichuan Province (LY23-02).
Data Availability Statement
The datasets used and/or analyzed during the current study are available from the corresponding author upon reasonable request.