
Abstract
The study aimed to verify the psychometric properties of the emotional-style scale and explore different clusters of emotional styles. An emotional style scale was completed in three districts of western Taiwan using stratified random sampling. The study confirmed the reliability and convergent validity of each subscale in a sample of 712 academically gifted students. An emotional style scale for gifted junior high school students was validated with a 25-item self-reported measure. A bi-factor structure model proved the best theoretical factor structure for emotional style. In addition, three clusters of emotional styles were identified in the study. Researchers and educators could use the emotional-style scale in the future to identify and address the emotional needs of gifted junior high school students.
Plain language summary
The study aimed to confirm the content and types of the emotional style scale for the Chinese version. The study adopted stratified random sampling in three areas in western Taiwan and investigated 712 academically gifted teenagers from seventh- to ninth grade. The study used confirmatory factor structure and cluster analysis to analyze the data. The result showed the bi-factor structure model was the most accurate theoretical factor structure for emotional style. There were 25 items in the Chinese version of the emotional scale and three categories of emotional styles. The validity and reliability of each subscale were also proved. Researchers and teachers may use the emotional-style scale to identify the emotional characters and needs of gifted junior high school children in the future.
Keywords
Introduction
Adolescence’s primary social and psychological task is the formation of identity, which entails the developmental conflict stage over identity and role confusion (Erikson, 1968). Junior high school students are in an early stage regarding self-discipline, facing several development tasks and challenges. Gifted students were especially burdened with lots of pressure from their high standards and parents’ and teachers’ expectations of being at the top. Due to their sensitivity, these demands and pressures lead to internal instability and impulses among young people, who are vulnerable to the influences of others. If they do not learn to vent or control their emotions, they will likely to make mistakes (Kuo, 2011; Tsai & Yang, 2013). Students may exhibit inappropriate behaviors, especially during adolescence, if schools do not guide them toward developing positive emotions. Junior high school students experiencing physical, psychological, and social changes are more likely to develop emotional distress and behavioral problems.
Gifted students’ cognitive complexity could enhance their emotional depth, complicating their emotional concerns (Brown, 2009; Silverman, 1993). As gifted students have higher potential, especially in cognitive learning, parents and teachers often focus on their cognitive development, emphasizing the depth and breadth of the curriculum but ignoring their social and emotional needs (Wu, 2000). Teenagers’ mood swings go ups and downs when they enter puberty. Gifted teenagers also experience cognitive development more rapidly, unstable and intense emotions, impulse behaviors, and even improper actions. Emotions and affect are central to scientific models of well-being, human development, interpersonal processes, psychopathology, and decision-making (Nazari & Griffiths, 2020). Therefore, it is necessary to develop an emotionally relevant scale to understand the emotional state of gifted teenagers. Researchers have gained insight into what happens in the brain when individuals are exposed to emotional situations or trauma through advanced neuroimaging and other technologies (Nazari & Griffiths, 2020) and found the basic six units of emotion in the brain. Using the basic emotional units identified in neuroscience, people’s resilience, attention, outlook, self-awareness, social intuition, and context-sensitivity have been examined (Alexander, 2013; Hong, 2013). The study tried to develop the emotional style scale to understand gifted teenagers’ inner world.
Through investigation of the six dimensions of emotional style, it would be helpful to understand their inner response to external stimuli (related to self-awareness and attention), emotional recovery (related to resilience), positive attitude (related to outlook), and interpersonal relationship (related to social intuition and sensitivity to context). Peer group identification is also a required developmental task for teenagers to cultivate their self-concept. The study explored the factor structure, psychometric properties, and typologies of the emotional-style scale for gifted students in junior high school. The purpose of the study was (a) to confirm the six-factor structure of the Chinese version of the Emotional Style Scale (CESS), (b) to reveal its internal consistency and convergent validity, and (c) to find out the emotional types based on the results of the CESS based on neuroscience.
Emotion, Emotional Intelligence, and Emotional Style
Several terms about feeling need to be understood, such as mood, emotion, and, etc. Affective states are the most minor and evanescent emotional units aroused by internal mental activities or the real world (Davidson & Begley, 2012). Each affective state is replaced by the next and then disappears. The mood is consistent, a continued feeling that lasts for a few minutes, hours, or days. An affect is a feeling that may last for a few days or even a few years. Emotion, an affective state, is an event-focused, complex reaction pattern involving experiential, behavioral, and physiological elements (VandenBos, 2015). Emotional style is a consistent response to life experiences that may lead to specific emotional states, traits, or moods (Davidson & Begley, 2012; Hong, 2013). Based on the lasting time from short to long, the affect state (emotion), mood, affect, and emotional style are in turn.
There are many definitions of emotion in psychology, anthropology, sociology, neuroscience, and philosophy, among others (Gammerl, 2012). Emotion is a very elusive concept, and there is no absolute consensus on its definition. Two main emotional concepts appear in the Western tradition. First, emotions are mental activities rooted in an individual’s internal chaos, potentially destructive and needing control. Second, emotions are personal, organizational responses in which emotional adaptation focuses on cognitive activities and follow-up actions rather than adopting emotional characteristics that are chaotic and random (Salovey & Mayer, 1990). Emotions are the primary motivating force that stimulates and guides activities (cited in Salovey & Mayer, 1990). People need to control their emotions (self-regulation) and not be controlled by them (Salovey & Mayer, 1990). The concept was analogous to emotional intelligence, a new function that could be learned or exist innately in certain people (Samad, 2014). Emotional regulation is the process of modulating one or more aspects of an emotional experience or response (Gross & Jazaieri, 2014). Thus, it is necessary to identify and manage one’s emotions, regarded as motivational resources.
Social psychologists have also pointed out that emotion has two primary conditions: first, physical stimulation can provide emotional energy, and second, the emotional components include cognitive assessment (Davidson & Begley, 2012). Emotion is the cognitive assessment of a situation that determines what the individual feels based on the assessment of the inner physiological reaction at the time (Davidson & Begley). External environmental stimulation caused personal emotional and physical responses, such as smiling, a sign of positive emotion. Scherer (2005) proposed the emotional component process model, defining emotion as an episode of interrelated, synchronized changes among the states of all or most of the five organismic subsystems in response to the evaluating an external or internal stimulus event about significant concerns for the organism in 1978. The components of an emotional episode are the respective states of the five subsystems, which operate independently most of the time, and the process consists of coordinated changes over time (Scherer, 2005).
The component process model presented in Table 1 reserves the use of this term for the subjective emotional experience component of emotion, which is presumed to have a critical monitoring and regulation function (Scherer, 2005). Cognition and emotion are often treated as independent but interacting systems. Emotion influences reactions and behaviors through personal cognitive appraisal and simultaneously creates constructs and adjustments in these system processes. Thus, emotional components include cognitive, neurological, motivational, and physical responses. Emotions affect cognitive evaluation, guiding actions, communication responses, and self-monitoring of the internal and external environment through the operation of the brain system.
Relationships Between Subsystems and the Functions and Components of Emotion.

Note. CNS, central nervous system; NES, neuro-endocrine system; ANS, autonomic nervous system; SNS, somatic nervous system (cited in Scherer, 2005, p. 698).
Mayer and Salovey (1993) have defined emotional intelligence as “a type of social intelligence that is concerned with the ability to monitor one’s own and other’s emotions, to discriminate among them, and to use that information to guide one’s thinking and actions (Salovey & Mayer, 1990). Thorndike (1920) defined social intelligence as the ability to perceive one’s internal state, motivation, and behaviors and those of others, together with the ability to take appropriate actions based on this information (cited in Salovey & Mayer). Weinstein found that social intelligence can be summarized as the ability to respond to others (cited in Salovey & Mayer). The definition of emotional intelligence (EI) is the ability to empathize, persevere, control impulses, communicate, make thoughtful decisions, solve problems, and work with others in a way that earns friends and success (Stone-McCown et al., 1998; cited in Srikanth & Sonawat, 2014). Social intelligence contained and expanded the concepts of emotional intelligence. Besides identifying the feelings and emotions of oneself and others, one also adopts emotional cues to guide oneself in appropriate responses and conducting interpersonal interactions. Emotional intelligence consists of a healthy way of life that will guarantee your success professionally and personally.
According to Mayer et al. (2000), emotional intelligence is the ability to perceive, express, assimilate, understand, and regulate emotion. In order to maximize children’s social advancement in all aspects of their lives, it is crucial to understand the properties of emotional intelligence. Most emotional intelligence models contain these four generic categories: self-awareness, self-management, social awareness, and relationship management (Goleman, 2011a). Each core ability is a learned workplace competency distinguishing the most successful leaders. The development of emotional intelligence can benefit leaders at any point in their careers or lives since, in addition to being brilliant intellectually (IQ), leaders must also be highly sensitive to themselves and their abilities to manage themselves, others, and relationships. (Goleman, 2011a; Goleman, 2011b). While emotional intelligence determines the potential for learning the fundamentals of self-mastery and the like, emotional competence shows how much of that potential we have mastered in ways that translate into on-the-job capabilities (Goleman, 2011a). To be adept at emotional competence, such as teamwork, one requires an underlying ability in emotional intelligence fundamentals such as social awareness and relationship management (Goleman, 2011a). The emotional intelligence competencies, such as sensitivity, self-awareness, and social awareness, were similar to the elements of emotional style, which were proved by affective neuroscience.
From the affective neuroscience perspective, emotional style is the basis on which people express emotional responses through the construction of brain activities. Emotional styles are governed by the circuits of the following brain structures: the ventromedial PFC, the orbitofrontal cortex (OFC), the amygdala, the hippocampus, the anterior cingulate cortex, and the insular cortex (Davidson, 2000). Everyone’s emotional styles affect their daily lives through the circuits of specific brain structures. As emotions are experienced, cultivated, and displayed, emotional styles oscillate between discursive patterns and embodied practices, and between standard scripts and specific adaptations (Gammerl, 2012). The characteristic emotional expressions of an emotional style call forth responses that observers recognize as warranting these expressions (Karafyllis & Ulshöfer, 2008). Psychiatrists and mental health workers have the authority to define and legitimize an emotional style in a particular field called emotional competence (Karafyllis & Ulshöfer). The emotional style could be converted into social currency or capital and articulated as a new language of self-hood to seize such capital (Karafyllis & Ulshöfer). From a cultural perspective, emotional style is similar to social capital and affects individual development through cooperation, communication, and interpersonal relationships toward success. The study further explored the concept of the emotional style scale.
Emotion Style Questionnaire
Allen and Hamsher (1974) developed their Test of Emotional Styles based on three dimensions of emotionality: responsiveness (intensity of affect), expressiveness (interpersonal communication of affect), and orientation (attitude toward emotion), and they found that women scored significantly higher than men on all dimensions in a sample of 120 undergraduates. Woods et al. (1977) tested the construct validity of the subscales of the Test of Emotional Styles among undergraduates, finding that its dimensions failed to correlate significantly with any reported variables . However, they were significantly intercorrelated among themselves. Hossein (2013) found that the dominant affective style of bachelor’s students was emotional adjustment. A statistically significant negative relationship was found between concealment and aggression and between emotional adjustment and aggressive attitudes (Hossein). However, there is no significant relationship between aggressive attitudes and emotional tolerance (Hossein). Regarding the components of the emotional style scale, different researchers adopted different variables, such as emotional responsiveness, expressiveness, orientation, aggressive attitude, tolerance, and adjustment.
The emotional style questionnaire (ESQ), a novel and multidimensional psychometric instrument, was developed by Kesebir et al. (2019) to assess the six dimensions of emotional style, which reflect the characteristics and patterns of the brain and could be used to account for all existing personality traits and temperament types. The ESQ’s six dimensions are outlook, resilience, social intuition, self-awareness, sensitivity to context, and attention, and each of these dimensions describes a continuum with two extremes (Nazari & Griffiths, 2020). The definition and neural basis of the six dimensions are gathered from a range of prior studies, and the brief introduction was as follows (cited in Alexander, 2013; Davidson & Begley, 2012; Hong, 2013; Jekauc et al., 2021; Nazari & Griffiths, 2020).
Resilience allows people to quickly bounce back from adverse events, regardless of their outcome, and maintain a positive attitude in the face of difficulties. Those who can recover their emotional poise after minor daily hardships also tend to recover faster from more considerable life challenges. Psychological well-being is closely related to this dimension. People with a higher capacity for this can recover more quickly from negative emotions such as fear, sadness, or anger, while those at the low end are slower to heal and can be crippled by adversity.
Social intuition refers to the ability to perceive and correctly interpret nonverbal social signals (e.g., facial expressions, body language, and gestures). Intuitive people can read nonverbal cues and decode others’ motives and intentions. High performers share the ability to read nonverbal cues such as facial expressions, body language, and vocal intonation and to infer social information from others’ emotional states. By contrast, low performers struggle to pick up and decoding subtle emotional signals. Low levels of social intuition are predicted to correspond to lower well-being because failure to read others’ emotions may lead to broken interpersonal relationships.
Context-sensitivity denotes the degree to which emotional and behavioral responses consider the social context. Sensitivity to context, which reflects an observable awareness of the social environment, is a prerequisite for social interaction and learning. Social engagement requires sensitivity to social rules and the ability to regulate behavior accordingly. People with high context-sensitivity can modify their responses to the implicit rules and expectations that govern different social situations. However, people with low context-sensitivity can be insufficiently sensitive to the surrounding context, and their behaviors can be considered oblivious or inappropriate (e.g., talking loudly during a movie, telling dirty jokes to one’s in-laws).
Self-awareness is the ability to perceive one’s bodily signals that are associated with emotions and to interpret them correctly. A high level of activation of the insula promotes higher self-awareness and the ability to empathize with others’ anxiety and pain. The ability to recognize and interpret physical and emotional signals from the body allows people to be sensitive to their internal states. Low activation can lead to low self-awareness. It is difficult for people to describe their own emotional experiences and to understand why they act and react the way they do.
Outlook refers to the ability of individuals to maintain positive emotions (e.g., joy, pride) in diverse life situations. The striatum is a critical area in the brain for producing rewards. Signals from the prefrontal cortex maintain high activation in the striatum. At the high extremes, the striatum activation promotes a positive attitude; at the low extremes, people have shorter-lived responses to positive stimuli, resulting in a more pessimistic outlook over time. The outlook dimension thus encompasses both the ability to maintain positive emotions that arise at the moment and the general disposition toward positivity experienced over time.
Attention refers to the clarity of an individual’s focus and ability to screen out distractions and stay focused. Selection and open, non-judgmental awareness are two types of attention relating to emotional styles. The former refers to consciously choosing to focus on a particular trait in the environment. In contrast, the latter refers to receiving external environmental signals and the thoughts and feelings emerging from the brain. People with a higher ability to focus their attention showed a strong genlocking phenomenon in the prefrontal cortex (referring to the restriction of brain activity by external stimuli to produce synchronized performance) and a solid positive wave response. People with high values in this dimension have a sharp and clear focus. By contrast, the attention of those low on this dimension is quickly captured by the most attention-grabbing stimuli in their environment. Emotional stimuli (as opposed to sensory stimuli) command an untoward share of our attention, and the ability to filter out emotional distractions is closely linked to psychological well-being. People who are good at screening out emotional distractions tend not to be easily pushed and pulled by constant emotional ups and downs.
Each of the six affective styles features two extremes, usually resulting from the strengthening or weakening of neural circuits. When facing an external environment, individuals can their emotions and self-awareness triggers based on their sensitivity to the situation and social intuition. If the individual can quickly recover from setbacks and maintain positive emotions over a long period, they may develop good emotional management. The relationships among these six emotional traits are close throughout the process of emotional initiation.
Kesebir et al. (2019) conducted four studies to construct and verify a 24-item self-report emotional style questionnaire, including six dimensions of a healthy emotional life. Then, a model was tested that grouped the six dimensions into one second-order factor indicating healthy emotionality according to AMOS, which yielded a good fit for this model. Each dimension of the ESQ was partly correlated with the Revised Life Orientation Test (LOT-R), the Brief Resilience Scale, the Mindful Attention Awareness Scale, the Multidimensional Assessment of Interceptive Awareness, and the Attentional Control Scale. A relationship was also established between ESQ and various indicators of well-being, and six first-order factors representing each emotional-style dimension yielded a good model fit (Kesebir et al., 2019). The results showed that the ESQ subscales relate to theoretically relevant constructions expectedly. The emotional-style scale had good criteria-related validity. The six-structure original version of the ESQ showed excellent reliability and convergent validity.
Then, the ESQ was translated into Persian, Italian, Polish, and German versions and verified for factor structure, reliability, validity, etc. The Polish and Persian versions of ESQ had similar reliability, validity coefficients, and factor structure to the English version (Gasiorowska et al., 2022; Nazari & Griffiths, 2020). Tsai (2020, Feb 5–7) also found the six-factor model of the Chinese version of the ESQ. In addition, some studies found that the outlook and resilience dimensions were strongly correlated (Jekauc et al., 2021; Kesebir et al., 2019; Malandrone et al., 2022; Nazari & Griffiths, 2020), suggesting that they might be two overlapping concepts (Malandrone et al., 2022). However, Jekauc et al. (2021) found that the six-factor model showed better model fit than the five-factor model in the German version of the emotional style scale. The German version of the ESQ also supported the six-factor structure postulated by Davidson and colleagues, which had good reliability and validity (Jekauc et al., 2021). Malandrone et al. (2022) also found the five-factor structure of the Italian version of the emotional style questionnaire (ESQ-ITA) through exploratory factor analysis, including outlook/resilience, sensitivity to context, attention, social intuition, and self-awareness. The study adopted the emotional style questionnaire (ESQ) developed by Kesebir et al. (2019). Because the Chinese version of the ESQ was unavailable and unsuitable for teenagers, the study verified the theory model and applicability of the emotional-style scale for gifted students to understand their emotional development in junior high school.
Regarding criterion-related validity, the Persian version of ESQ was positively correlated with scores on the WHOQOL-BREF and PANAS-positive affect, and it was negatively correlated with scores on the OASIS, DERS, and PANAS-negative affect (Nazari & Griffiths, 2020). Substantial correlations were found between the dimensions of the ESQ in the German version and other validated scales (Big Five Inventory, Multidimensional Assessment of Interoceptive Awareness, Flourishing Scale, Self-Rating Questionnaire for the Diagnosis of Attention-Deficit/Hyperactivity Disorder), and Subjective Vitality Scale), confirming the criterion validity of the questionnaire (Jekauc et al., 2021). Unlike Kesebir et al. (2019), the emotional awareness subscale had a relatively low correlation with self-awareness in the German version of the emotional style (Jekauc et al., 2021). Self-assessed ADHD was also moderately to weakly correlated with attention (Jekauc et al., 2021). The total score of the emotional style represented healthy emotions, and the relationship could distinguish each subscale between interoceptive awareness, flourishing, ADHA, and vitality.
ESQ, outlook, and resilience each correlated most with trait optimism and stress management as subscales of TEIQ, neuroticism as a subscale of the Big Five, the Flourishing Scale, and the Subjective Vitality Scale (Jekauc et al., 2021). According to the relationship between the German version of the emotional style and the Trait Emotional Intelligence Questionnaire, optimism correlated most strongly with outlook, stress management the most with resilience, empathy the most with social intuition, and relationship skills the most with context-sensitivity (Jekauc et al., 2021). According to the ESQ-ITA, the overall score positively correlates with optimism, resilience, attention, self-awareness, and interoceptive awareness. In contrast, it is negatively correlated with autistic features, depression, anxiety symptoms, and stress (Malandrone et al., 2022). Therefore, other subscales tend to be positive, except for stress management.
Three Types of Emotional Style
The study found three types of emotion styles from the literature review (Cuncic, 2021; Marazziti et al., 2019; Thorndike & Hagen, 1979), corresponding to the six dimensions of the emotional style scale. Three types were presented as follows: First, emotional stability is defined to label whether a complex emotional system automatically maintains its equilibrium efficiently, and the construct of the scale had five dimensions, including pessimism vs. optimism, anxiety versus calm, aggression versus tolerance, dependence vs. autonomy, and apathy versus empathy (Chaturvedi & Chander, 2010). Emotional stability is characterized by the evenness of moods, intent, interests, optimism, cheerfulness, and composure, accompanied by a feeling of being in good health; a lack of feelings of guilt, worry, or loneliness; and freedom from daydreaming and the perseveration of ideas and moods (Thorndike & Hagen, 1979). Corresponding to the construct of emotional style, pessimism vs. optimism was analogous to the dimension of outlook. The feeling of anxiety versus calm was related to self-awareness or the resilience dimension. The aggression versus tolerance of social interaction was related to social intuition. Perhaps dependence versus autonomy could be similar to attention or sensitivity to context. The study hypothesized that students with emotional lability would have lower scores in six dimensions of their emotional style. The study hypothesizes that students with higher scores in six dimensions of the emotional style have more excellent emotional stability.
Second, emotional blunting is the inability to express feelings verbally or nonverbally, particularly when discussing issues that are typically expected to elicit emotional responses (Marazziti et al., 2019). People with emotional blunting gestures who express themselves expressively rarely have reduced facial expression reactivity and decreased vocal inflection (Marazziti et al., 2019). They report feeling flattened or evened out, and their emotional responses to all events tend to be reduced and lack emotional expression, regardless of whether the emotion is decreased (Marazziti et al., 2019; Marin, 1990). They exhibit a calm attitude in response to all events, just like the moderate outlook dimension but with a lower sensitivity to context. They can continue to respond to emotional situations appropriately but without what they consider to be genuine feelings (Liddle, 2007; cited in Marazziti et al., 2019; Price et al., 2009). Their behaviors resemble moderate attention and social intuition. The dysregulation of emotional sensitivity reduces the quantity and quality of daily emotions, accompanied by a lower capacity to experience intense emotions (emotional detachment) and diminished emotionality in interpersonal relationships (Marazziti et al., 2019). They feel reduced sympathy and empathy during social interactions with their friends and family, including their partners and children, and there is also a reduced intensity and frequency of positive or negative emotions (Marazziti et al., 2019). Due to their lack of mood swings or relatively even mood, they might not require much resilience to recover from negative emotions, and they may have moderate self-awareness. Thus, those with emotional blunting exhibit a moderate outlook, resilience, attention, self-awareness, and social intuition, with a lower context-sensitivity and resilience.
Finally, emotional lability tends to shift rapidly and dramatically between emotional states (Cuncic, 2021). People with high emotional lability experience sudden, dramatic changes in emotion that may not be triggered by something specific and have the typical signs of intense emotions, rapid mood changes, inappropriate reactions to events that could affect moods, and difficulty controlling emotions (Cuncic, 2021). This group might show irritability, hot temper, low frustration tolerance, and sudden, unpredictable shifts to negative emotions such as anger, dysphoria, and sadness, occurring with intensity or frequency that is considered culturally inappropriate about the given context and the individual’s age and developmental stage (Sobanski et al., 2021). Individuals of this type may avoid social activities or professional events because they fear their moods may make it hard to focus on tasks or stay organized. The study further explored the different types of emotional states through the six dimensions of emotional styles.
Method
Research Design
The study adopted survey research with stratified random sampling. The study aimed to examine the six-factor structure of the emotional style with 40 items, and found a suitable model with 25 items. Then, the different models will be verified, and the emotional style will be determined. Finally, the emotional style is classified into different clusters, such as emotional stability, blunting, and lability. A large sample of gifted students was asked to complete the Chinese version of the emotional style scale (CESS) to achieve these purposes.
Participants and Recruitment
The subjects of the survey were the seventh-to ninth-grade academically gifted students studying in junior high schools in Taiwan. The survey was based on the statistical regional standards of the Republic of China. A stratified random sampling was conducted in three districts of western Taiwan. The northern sites were Yilan, New Taipei City, and Hsinchu; the central sites were Taichung and Changhua; and the southern sites were Chiayi and Kaohsiung. Cluster sampling was used to select gifted education classes from these cities. Cluster sampling was performed on four schools in the northern district, five in the central district, and five in the southern district. There were 739 gifted students selected from cluster sampling. In all, 712 questionnaires were returned, and the questionnaire response rate was 96.34%. Five students who did not complete the questionnaires, and the valid sample was 707 gifted students. There were 230 seventh-grade students, 232 eighth-grade students, and 245 ninth-grade students, including 408 males and 298 females.
Instrument
The study adopted the Chinese version of the emotional style scale from the study of Tsai (2020, Feb. 5–7), which was revised from the items of the emotional style questionnaire from the book of Davidson and Begley (2012). The factor structure of the CESS was the same as that of the emotional questionnaire made by Kesebir et al. (2019). The scale had a six-factor structure with 52 items, which were reduced from the original 60 items through item analysis, and exploratory factor analysis was adopted to make sure the factor structure model was the same as the original scale.
Then, the same sample of 375 junior high students was analyzed by exploratory factor analysis again and 40 items were selected for further analysis. The explained variances of the six factors are 15.47%, 8.09%, 3.58%, 3.07%, 2.51%, and 2.24%. The proportion of each variable’s variance that can be explained by the six factors was 5.42%, 3.74%, 2.40%, 2.88%, 3.39%, and 3.12%. There are ten items in social intuition (12, 35, 36, 38, 40, 41, 42, 47, and 52), nine items in context-sensitivity (10, 22, 24, 26, 37, 39, 44, 45, 46, and 49), seven items in resilience (9, 14, 21, 28, 29, 31, and 32), five items in outlook (19, 20, 23, 25, 30, and 34), four items in self-awareness (6, 13, 15, and 16), and five items in attention (1, 2, 3, 5, and 8). The total scale included 40 questions, and the opposite question included items 9, 10, 14, 21, 23, 24, 26, 28, 29, 44, 45, 46, and 49. Cronbach’s coefficient for the total scale with 40 items was .781, and all subscales’ coefficients were between .639 and .842. The reliability of the total scale was evidenced.
Procedure and Analysis
After giving their informed consent, participants completed the CESS. Participants responded to the 40-item list in an emotional style. For each item, they indicated their agreement on a scale from 1 (strongly disagree) to 5 (strongly agree). The study adopted structural equation modeling to verify the measurement model of emotional style through confirmatory factor analysis. The convergent validity was confirmed based on composite reliability (CR greater than 0.6), average variance extracted (AVE greater than 0.5), and the standardized factor loading of each item (larger than 0.5) (Fornell & Larcker, 1981). Cronbach’s alpha was used to assess reliability. The clusters of emotional styles were then explored by cluster analysis.
The eight model fit indexes were used to compare different measurement models to decide the best model, including Chi-square (χ2), relative Chi-square (χ2/df), root-mean-square error of approximation (RMSEA), standardized root-mean-square residual (SRMR), comparative fit index, (CFI), Yucker-Lewis index (TLI), Aikaike information criterion (AIC), and Bayesian information criterion (BIC). Chi-square, RMSEA, and SRMR represented badness-of-fitness indices. Because Chi-square is easily affected by the sampling amount and the complex model, χ2/df modified the effect of the sampling amount, and χ2/df smaller than three represented the accepted model fit (Zhao et al., 2019). RMSEA and SRME smaller than .50 represented the best model fit, and those that were smaller than .80 represented the accepted model fit (Zhao et al.). CFI and TLE represented goodness-of-fit indices; the bigger the value, the better the model fit (Zhao et al.). CFI and TLE that were more significant .90 represented the good model fit (Zhao et al.). The Aikaike Information Criterion (AIC) and Bayesian Information Criterion (BIC) didn’t have absolute standards and depended on their relative amounts to decide the best model fit (Song, 2020). The smaller the value of AIC and BIC, the better the model fit.
Result and Discussion
Confirmatory Factor Analysis
Data from 712 participants were used to verify the six-factor structure and item appropriateness of the emotional style with confirmative factor analysis. The study used maximum likelihood estimates to estimate the parameter estimates of each item and discovered that all of the parameter estimates qualified for significance. The chi-square value of the model was 2333.93 and reached a significance level. In Figure 1, the factor loadings of items 6 (.38), 9 (.39), 34 (.37), 47 (.35), 49 (.36), and 51 (.39) were all below.40. According to the fit index of the model, most indices did not reach the standard, including CMIN/DF = CMIN/DF = 3.219 (standard < 3), IFI = .761 (standard > 0.9), CFI = .759 (standard > 0.9), AGFI = .831 (standard > 0.9), and NFI = 0.687 (standard > 0.9), with the exception of RMSEA = .056 (standard < 0.05: good, standard < 0.08: accepted), RMR = 0.073 (standard < 0.08), SRMR = .0684 (standard<0.05: good, standard < 0.08: accepted). The data do not support the theoretical model. Thus, the first version of the model was revised.
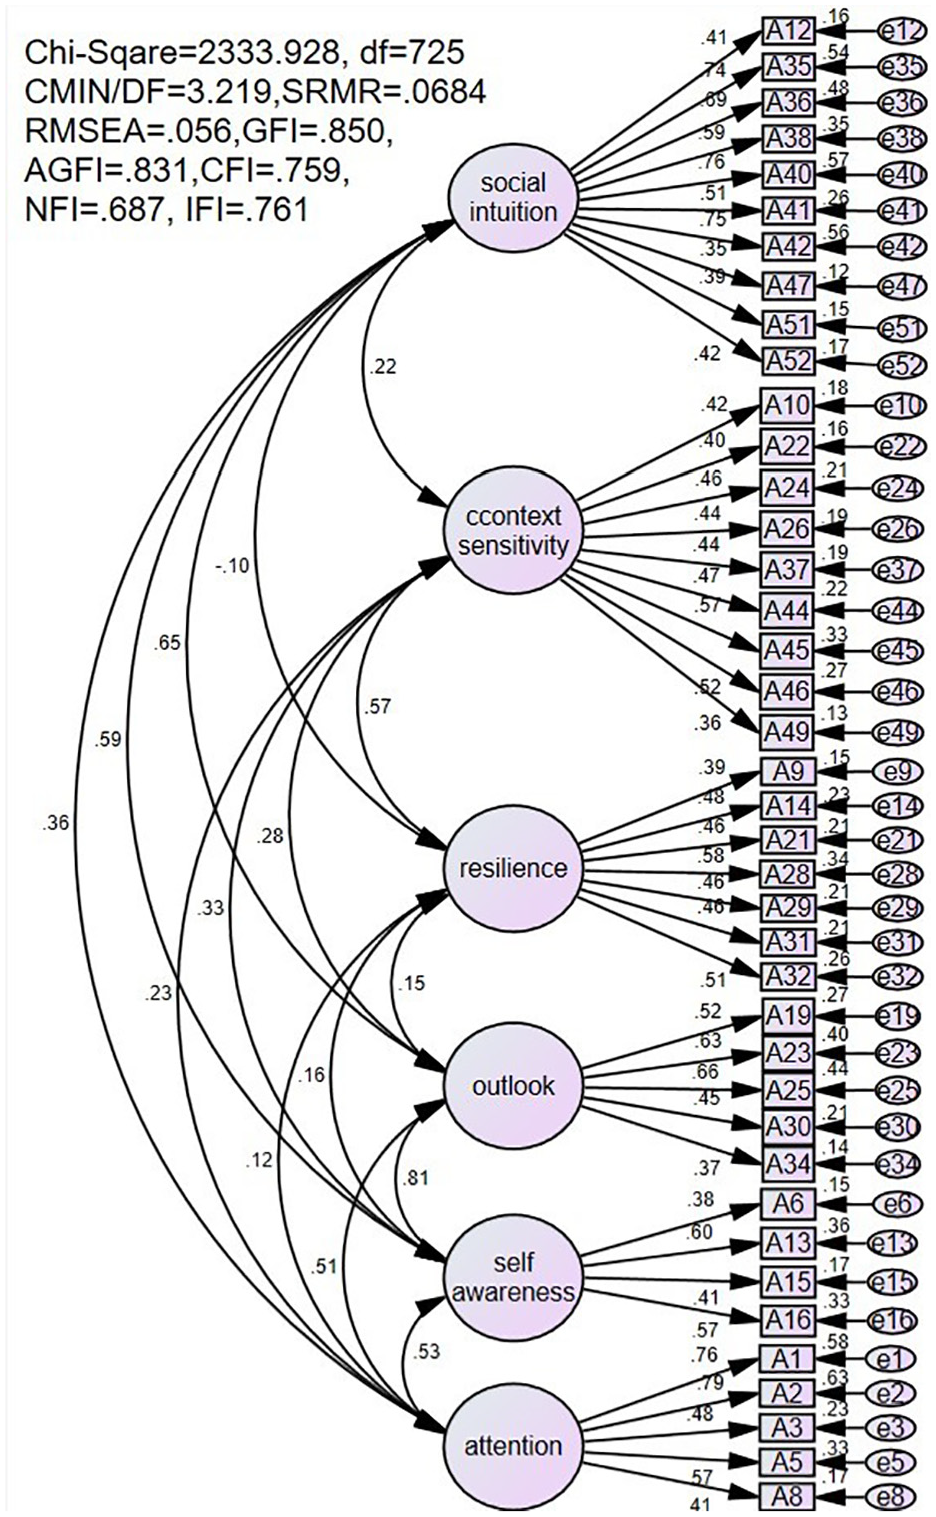
The measurement model of the emotional scale in the first version.
The model was revised several times due to the modification index analysis. The standard chosen was based on the amount of the modification index, with more significant amounts indicating that items should be deleted. If the residuals of each item were correlated, mainly if two related items were located in different factors or both items were related to the same factor, the item could contain more than one meaning of the factors or the meaning of the two items was too similar for this item to replace another. Such items could be removed to shorten the scale. According to the modification indexes, to revise the six-structure model with 40 items, the study deleted 15 items step by step until it reached a good model fit. Items 1, 6, 8, 9, 10, 12, 14, 22, 24, 26, 30, 34, 35, 47, and 51 were deleted by the preceding principle.
The chi-square value of the correlated model was 613.585, and it reached the significance level, as shown in Figure 2. According to the fit index of the model, most indexes reached standards, including CMIN/DF = 2.360, IFI = .902, CFI = .900, GFI = .936, AGFI = .920, RMR = .059, SRMR = .0549, except NFI = 0.841, and RMSEA = .044. This version of the model was considered adequate. The factor loadings of each item were positive and up to .40, except for item 15 (.36), and each item was significantly related to that subscale.
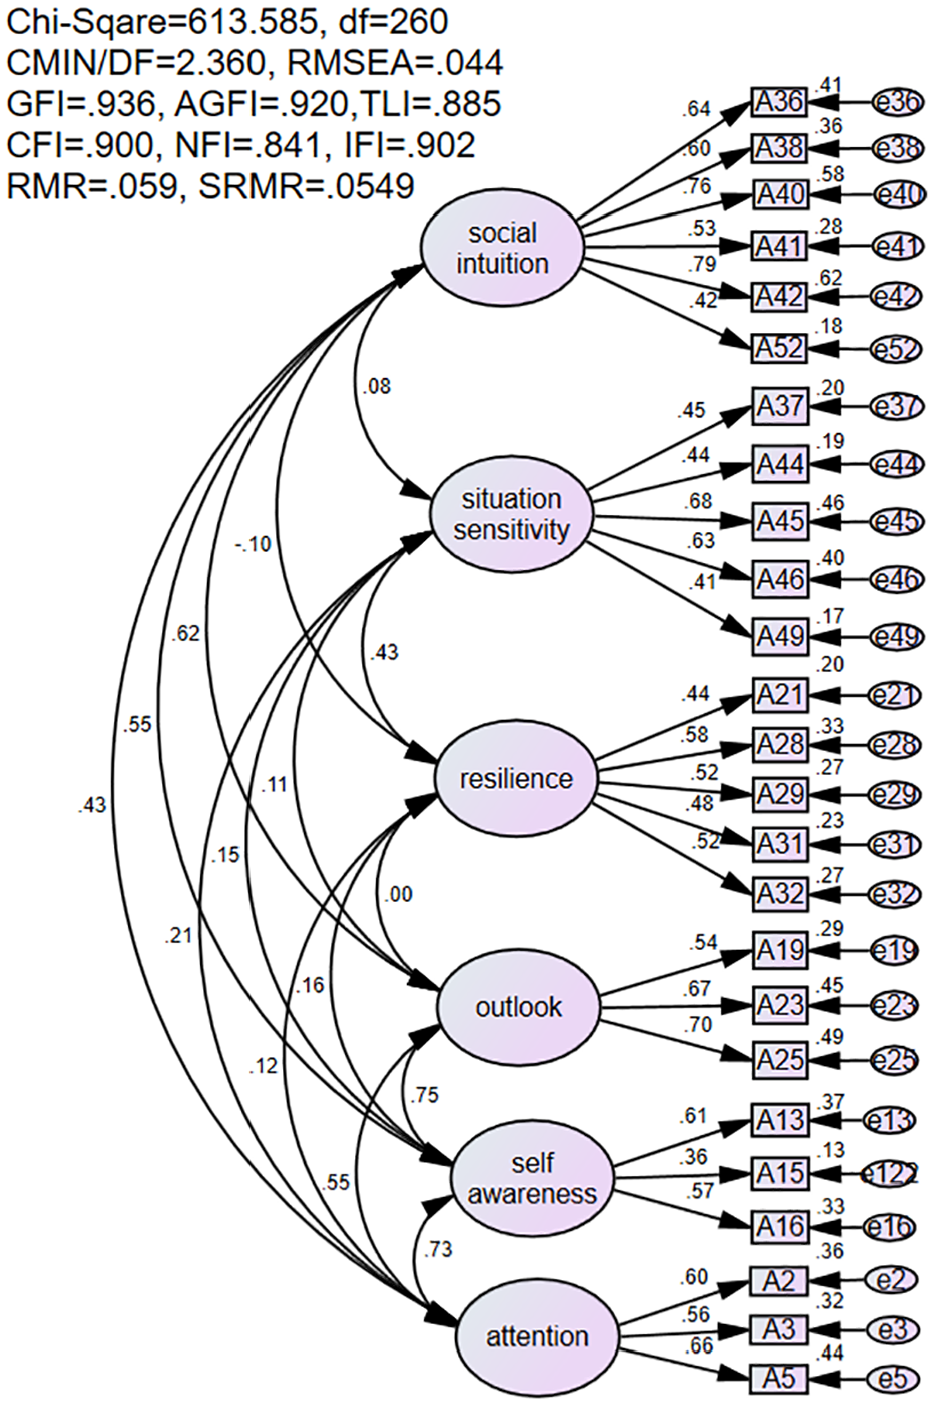
The correlated model of the emotional style in the final version.
All of the items in each subscale were strongly connected to that subscale, according to the regression analysis. Except for the connections resilience and social intuition (p = .052), between attention and resilience (p = .056), and between outlook and situation context-sensitivity (p = .059), which approached significance and the connection between social intuition and context-sensitivity (p = .104) and between outlook and resilience (p = .670) which were not statistically significant, each of the other subscales reached a significant level. context-sensitivity The positive association between each of the other subscales was demonstrated, and the correlation coefficient ranged from .002 to .747, except the negative relationship between resilience and social intuition (r = −.103).
The study also examined the model fit of the unidimensional model of emotional style to see if all 25 items contributed to the g factor. The chi-square value of the unidimensional model was 1826.330, and it reached the level of significance, as appeared in Figure 3. According to the fit index of the model, most indexes didn’t reach standards, including CMIN/DF = 6.641, IFI = .566, CFI = .563, GFI = .775, AGFI = .734, RMR = .099, SRMR = .0943, NFI = 0.526, and RMSEA = .089. This version of the model was not good. The estimates of items 21, 28, 32, 44, 46, and 49 didn’t significantly relate to healthy emotion, and the factor loadings of items 28, 29, and 32, and 49 were negative.
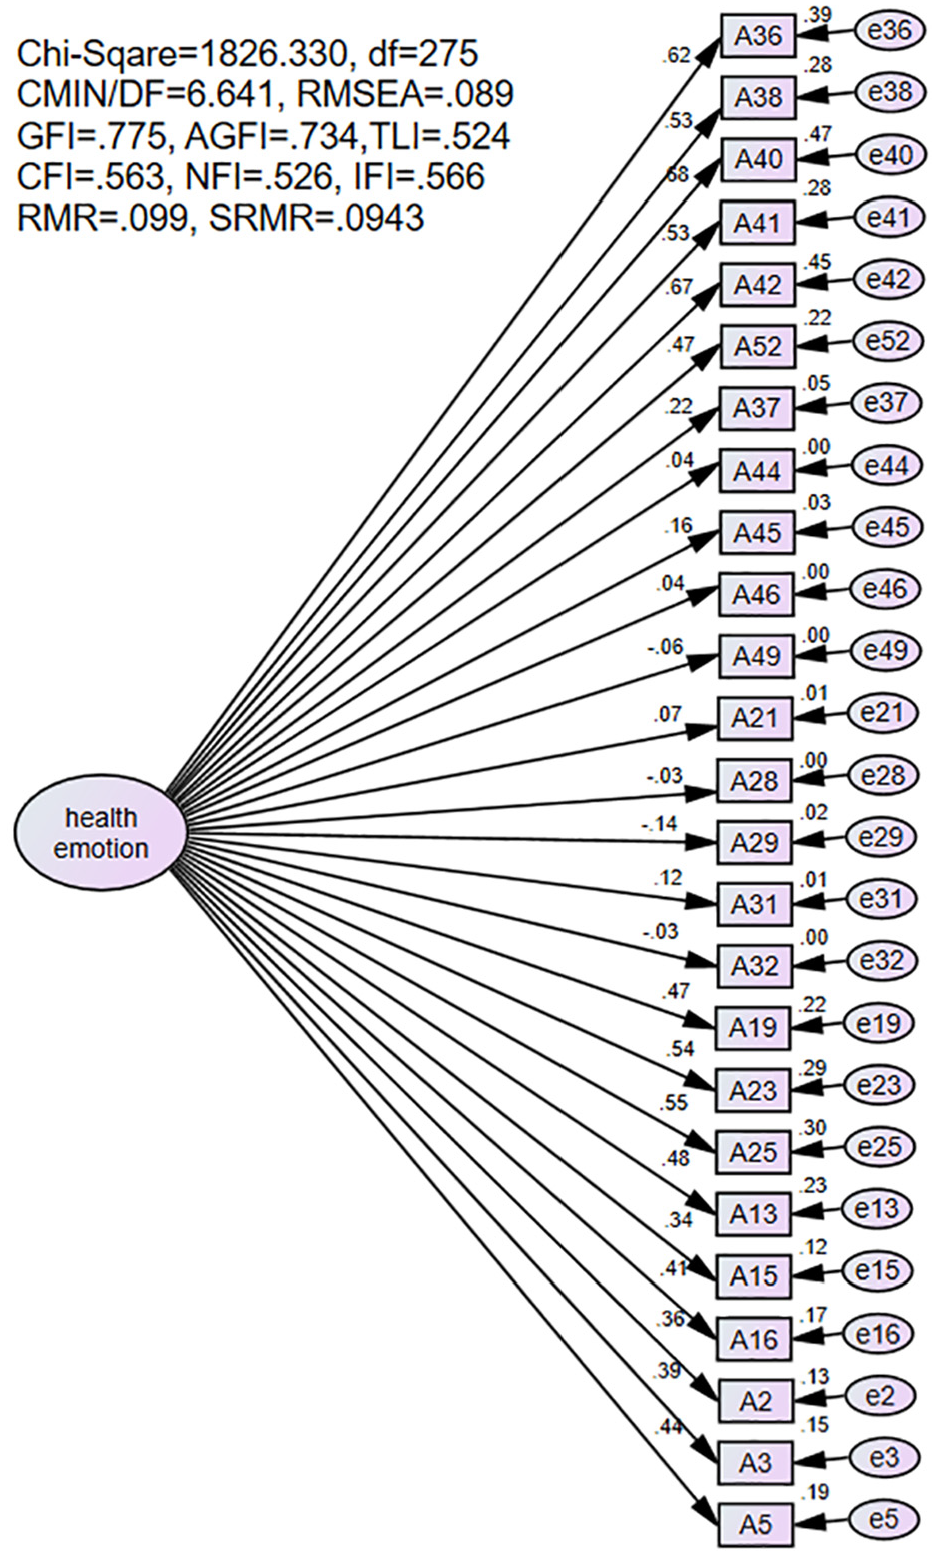
The unidimensional model of the emotional style in the final version.
It is possible that if items 21, 28, 29, and 32 from the resilience subscale and 44, 46, and 49 from the context-sensitivity subscale were not included in the resilience and context-sensitivity subscales, they were unrelated to healthy emotion. The seven items in the subscales for resilience and context-sensitivity were not required to be included in the total score calculation. Several items weren’t linked to the g factor when all factors were combined (a healthy emotion). It demonstrated that even though the model incorporated the g component, the six factors still required to be included in the measuring model of the emotional style.
This study builds the second-order factor structure and bi-factor model based on the first-order correlated model of emotional style to examine model fit. Regarding the fit index of the second-order factor structure model in Figure 4, most indexes failed to meet the standard, including IFI = .878, CFI = .877, and NFI = .816, whereas chi-square = 707618, CMIN/DF = 2.631, AGFI = .911, RMR = 0.073, RMSEA = .048, and SRMR = .0673 did. The second-order factor structure model’s model fit was acceptable. Furthermore, except for the resilience subscale, which was not significantly related to healthy emotion, the other subscales were significantly related to that subscale. The estimate of each item significantly related to the subscales.
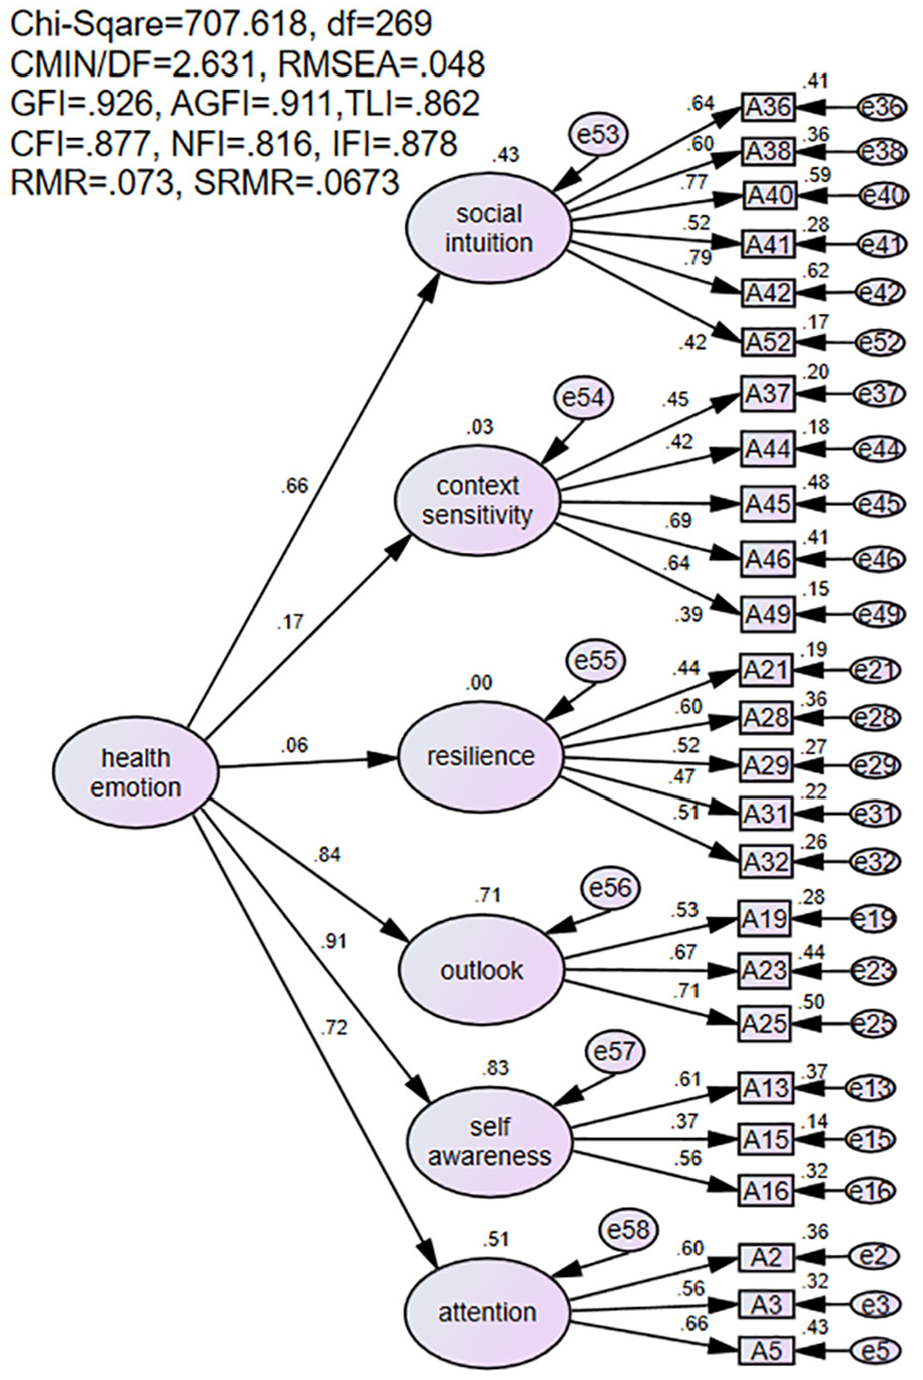
The second-order model of the emotional style in the final version.
Most of the indices for the correlated bi-factor structure model met the threshold, except for NFI = .870 in Figure 5. These indices included chi-square = 501.966, CMIN/DF = 2.092, GFI = .947, AGFI = .928, CFI = .926, IFI = .928, TLI = .908, RMR = 0.048, SRMR = .0438, and RMSEA = .039. The bi-factor structure model had an excellent model fit.

The correlated bi-factor model of the emotional style in the final version.
Moreover, neither the estimate for item 15 nor the estimates for items 28, 29, 32, and 49 indicated a significant relationship with healthy emotion. Context-sensitivity and social intuition did not significantly relate to one another. Resilience, context-sensitivity, and social intuition subscales were not substantially correlated with the attention subscale. The situation sensitivity and resilience subscales were not substantially correlated with the self-awareness subscale. Resilience and situation sensitivity were not substantially correlated with the outlook subscale. Based on the results, the study hypothesized that there was no relationship between any of the emotional style factors, and it then further investigated the emotional style’s simple bi-factor model.
Most indexes for the bi-factor structure model met the standard, including chi-square = 662.382, CMIN/DF = 2.598, GFI = .930, AGFI = .910, RMR = 0.077, SRMR = .0676, and RMSEA = .048, with the exception of CFI = .885, IFI = .887, TLI = .885, and NFI = .828 in Figure 6. The bi-factor structure model did not outperform the bi-factor correlated structure model in model fit. Each emotional style subscale appeared to have a significant correlation. However, the estimates of items 15 and 16 were not significantly related to self-awareness, nor were the estimates of items 29, 32, and 49 to healthy emotion.
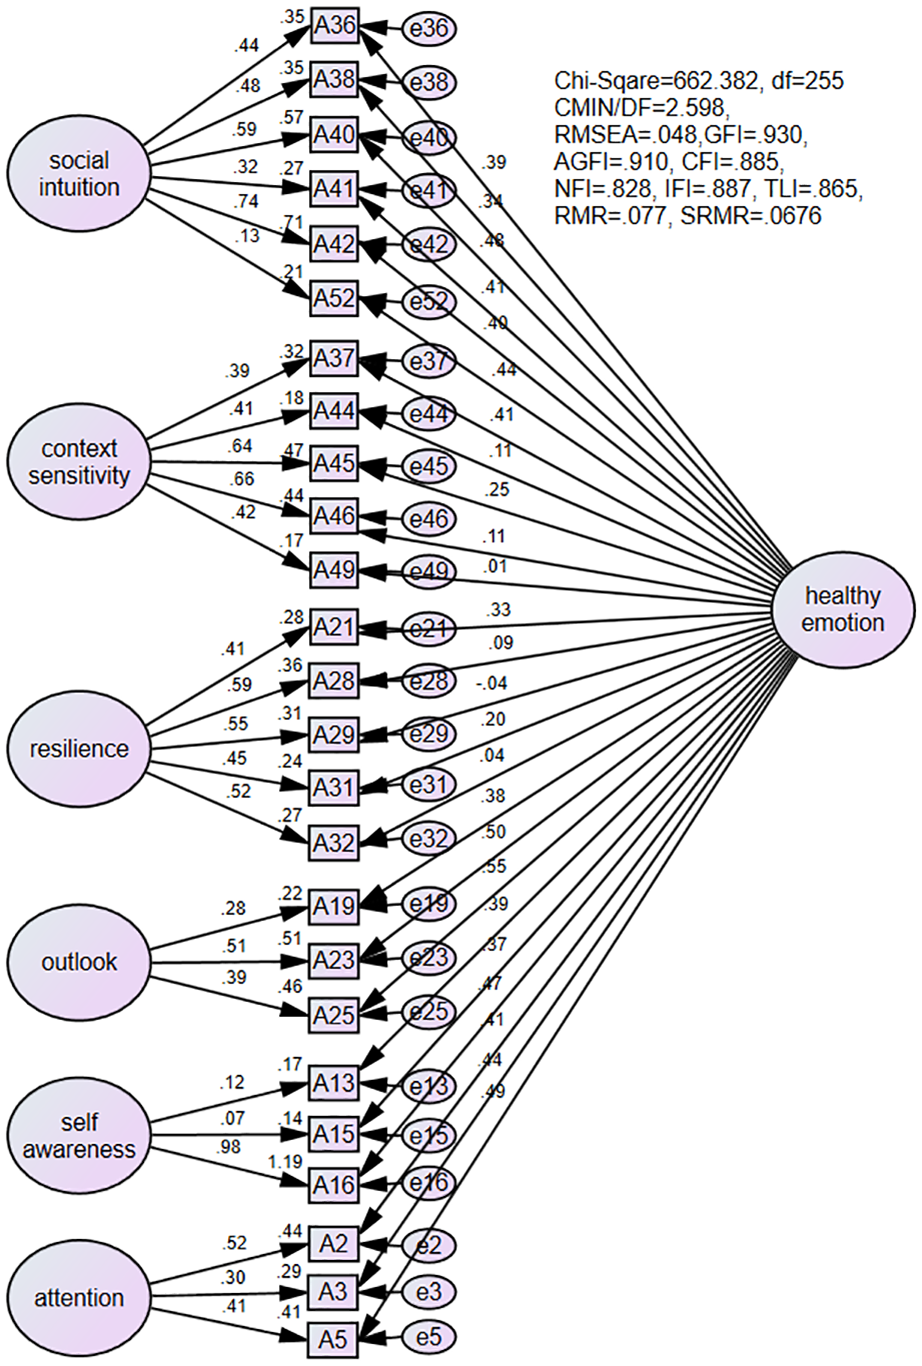
The bi-factor model of the emotional style in the final version.
As shown in Table 2, the study used eight model fit indices to assess six measurement models and select the best model. The χ2 value of each model achieved a significant level. The other models, except the unidimensional model that satisfied the requirement, were CMIN/DF, RMSEA, and SRMR. Only three models met the CFI value standard, including the first-order correlated model, correlated bi-factor, and second-order, bi-factor models. Only two models met the TLI value standard: the correlated bi-factor and the second-order, bi-factor models. The correlated bi-factor model had the lowest AIC value, and the second-order and bi-factor model had the lowest BIC value. The correlated bi-factor or second-order, bi-factor model outperformed the others.
The Comparison of the Emotional Style Fit Measures Among Different Factor Models.

reach the standard. ***P < .001.
The correlated bi-factor model and second-order and bi-factor models that met the standard, CFI, TLI, and RMSEA values were the most similar to Jekauc et al. (2021). Furthermore, the correlated bi-factor model’s AIC value (671.966) was closer to that of Jekauc et al. (2021) (637.6). The correlated bi-factor model was the most similar to the six-factor model of the German version of the emotional style scale developed by Jekauc et al. (2021), according to the model fit index. In comparison to Kesebir et al. (2019), the six-factor model with 24 items was identical to the six first-order factors and second-order factors with 33 items; however, the GFI, AGF, and RMSEA values of the first-order correlated model and second-order model in the study were better than those of the six first-order factors and second-order factors model (Kesebir et al., 2019).
The model fit indexes and factor structure of the first-order correlated model were similar to those of Nazari and Griffiths’ (2022) six first-order factors, but the model fit indexes of the six factors first-order model were nearly as good as those of the first-order correlated model. Malandrone et al. (2022) did not achieve the same results since the six-factor model outperformed the five-factor model. The outlook subscale and the resilient subscale didn’t need to be combined because of a weak association between them. It demonstrated that as opposed to the five-factor model revealed by Malandrone et al.‘s (2022) study, the majority of investigations supported the six-factor model of emotional style. The study proved that the correlated bi-factor model, which matched the emotional style’s six elements and the g factor, was the best model.
The reliability of self-awareness failed to meet the criterion in Table 3. If the AVE was more significant than 0.5, all factor loadings for each item had to be higher than 0.7 (Fornell & Larcker, 1981). According to Fornell and Larcker (1981), an accepted threshold for average extracted variance was 0.36. The average variance extracted for social intuition, outlook, and attention was 0.41, 0.41, and 0.37, respectively, which was above 0.36, whereas those for context-sensitivity, resilience, and self-awareness were not over 0.36. Although convergent validity was not ideal, it may be used and referred to. The results of CR and AVE from each subscale were less favorable than those of the emotional style questionnaire created by Nazari and Griffiths (2022) and Gasiorowska et al. (2022), but the CR of social intuition, context-sensitivity, resilience, outlook, and attention did. These values were 0.80, 0.65, 0.64, 0.67, and 0.64, respectively. The emotional scale’s overall reliability was excellent. The AVE from each factor failed to satisfy the criterion. Compared to previous studies, the CESS’s reliability and construct validity were not ideal.
Analytical Result of Composite Reliability and Average Variance Extracted.

Descriptive Statistics and Internal Consistency Reliability
According to Table 4, the overall score and the average of each subscale were higher than 0.30. Research shows gifted junior students usually have practical, emotional coping skills. The means for each component were included within the 95% confidence interval. The final version of the emotional-style scale had items that had been separately evaluated, and the reliability coefficients for each factor and the overall score ranged from .510 to .785. The outcomes were in line with those of Malandrone et al. (2022), and the scale’s internal validity was satisfactory.
Descriptive Statistics and Alpha Value of the Last Version of the Emotional-style Scale.

On the emotional style questionnaire, the findings of Kesebir et al. (2019), Nazari and Griffiths (2022), and Jekauc et al. (2021) produced much higher Cronbach alpha values than those of the study. Because the study adopted a 5-point Likert scale and other questionnaires adopted a 7-point Likert scale, the means of each subscale that was neural to positive were similar to the studies of Kesebir et al. (2019) (4.45–5.30), Malandrone et al. (2022) (4.5–5.5), and Jekauc et al. (2021) (4.05–5.23), but higher than those of Gasiorowska et al. (2022) (3.74–4.87).
This measure was shown to be equivalent to the Emotional Style Questionnaire’s original English version (Kesebir et al., 2019), the German version (Jekauc et al., 2021), the Persian version (Nazari & Griffiths, 2022), and the Italian version (Malandrone et al., 2022), demonstrating the scale’s reliability (ESQ). The original English version of the Emotional Style Questionnaire (ESQ), as well as the Iranian (Nazari & Griffiths, 2022) and Polish (Gasiorowska, et al., 2022) versions, all had the same six-factor structure of the scale. The Emotional Style Questionnaire has 25 items, as opposed to the 24 items in the original English, Persian, Polish, and Italian versions (ESQ).
Cluster Analysis
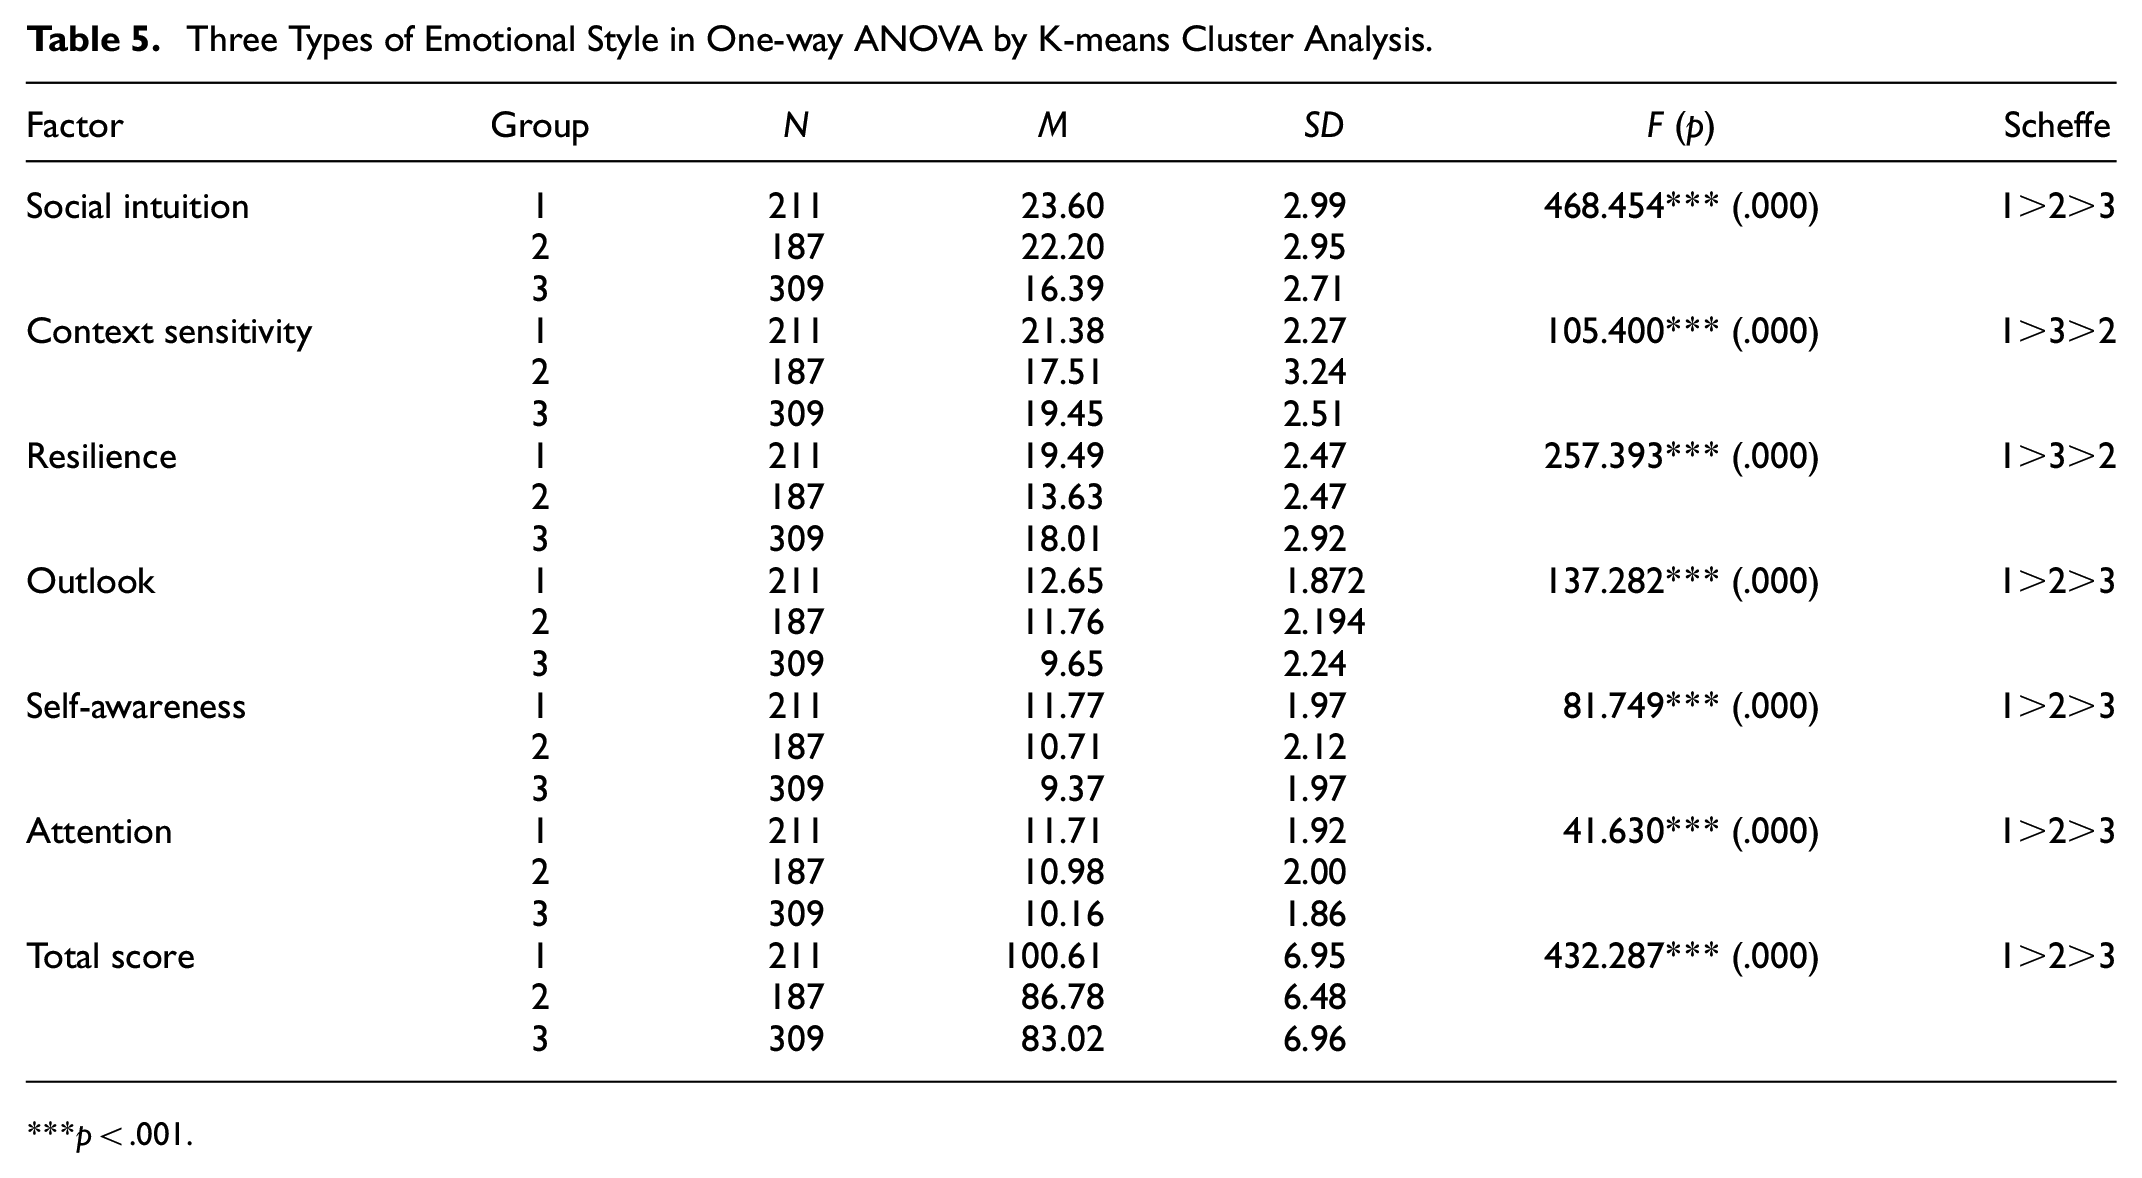
The study adopted k-means cluster analysis to distinguish the emotional style of gifted students and set up three groups. There were 211 students in Group 1, 187 in Group 2, and 309 in Group 3. A one-way ANOVA was adopted to compare the differences among the three groups, with the results presented in Table 5. The values for each subscale and the total scores in Group 1 were significantly higher than those in Groups 2 and 3, likewise for emotional style. Group 1 was named the emotional stability group, including 29.8% of the students. Students in group 1 who had the highest scores in the six categories of emotional style matched the hypothesis of emotional stability.
Three Types of Emotional Style in One-way ANOVA by K-means Cluster Analysis.
p < .001.
The attention, self-awareness, outlook, resilience, social intuition, and overall score of group 2 were significantly higher than the values for group 3, except resilience and context-sensitivity. Students in group 2 exhibited moderate levels of attention, self-awareness, outlook, resilience, social intuition, and emotional style but low levels of resilience and context-sensitivity. 26.4% of the total were in group 2, which was referred to as the emotional blunting group. Reduced emotional responsiveness is known as emotional blunting, or lowered affect (Marazziti et al., 2019). These individuals have little emotional arousal and don’t require the resilience to overcome unpleasant emotions. During social interactions with their friends and family, especially their partners and kids, they experience less sympathy and empathy, as evidenced by their lowered context-sensitivity. The outcome supported the emotional blunting concept.
Group 3 students demonstrated average resilience and context-sensitivity but poor attention, self-awareness, outlook, and social intuition. 43.7% of students made up group 3, known as the emotional lability group. Students in group 3 who got the lowest scores in the six elements of emotional style, except for resilience and context-sensitivity, didn’t fulfill the hypothesis of emotional lability. A lower outlook, attention, self-awareness, social intuition, moderate resilience, and sensitivity to context, may result from these people’s propensity for intense emotions and quick mood swings. They might also have difficulty controlling emotions and inappropriate reactions to situations that could affect their moods (Cuncic, 2021). So, their resilience and context-sensitivity weren’t too awful.
Discussion and Conclusion
Junior high school students tend to exhibit emotional instability and impulsive behavior when affected by internal physiological changes in puberty. Gifted students, burdened with increased pressure from their schoolwork and seeking peer recognition, are more likely to experience emotional distress, especially in Eastern culture. Therefore, the study attempted to determine the most appropriate emotional style scale based on affective neuroscience in order to assess gifted junior high students. The formal questionnaire contained 25 questions, and the Cronbach’s α coefficient of the full scale was .78, with an α coefficient of each subscale of 0.51 to 0.79. The CI of each subscale was 0.52 to 0.80, and the AVE values for each subscale were in the range 0.26 to 0.41. The reliability of this scale was good and the convergent validity was accepted. The study found that the six-factor structure of the emotional-style scale with 25 items was suitable for assessing the emotional state of gifted students, and researchers or educational practitioners could use it.
The study compared different factor models of emotional style and matched the findings of previous studies. As a result, it was better to have the g factor and six factors with 25 items when comparing models than to have just six factors or the g factor. The bi-factor model and the second-order factor model both provided a superior fit to the data, according to a comparison of the two models. The g component of healthy emotion comprised 25 emotional style items and six subscales. Each item’s construct may signify a healthy emotion, but the relationships between the six components, which displayed either positive or negative correlations, may impact the model-fit index. As a result, the bi-factor model outperformed the second-order model.
In light of the logic above, the bi-factor model was superior to the first-order correlated and unidimensional models because each element in six factors could also make up one factor. Also, the components that had no bearing on the g factor were excluded from consideration when computing the total score. In addition, the second-order, bi-factor model included two factors linked to the social level and another four factors related to the personal level. Six factors could reportedly be further split into two dimensions to make up the g factor. The result was similar to the findings of Kesebir et al. (2019), Jekauc et al. (2021), Malandrone et al. (2022) and Nazari and Griffiths (2022), in which the model fits the first-order models or second-order model with six factors were good. However, the bi-factor model that appropriately characterized the data was better than the first-order and second-order factors models. According to the result, the bi-factor model proved that each item in the six factors could constitute the health emotion proposed in the study by Kesebir et al. (2019). Different objects had similar inner emotional states based on the result of descriptive statistics. So, the ESQ was available for different objects.
This study divided gifted students into three groups by cluster analysis, finding 29.8% of students in an emotional stability group, 26.4% in an emotional blunting group, and 43.7% in an emotional liability group. Emotional stability refers to people with good attention, self-awareness, outlook, resilience, social intuition, and sensitivity to context. Emotional lability refers to people with unstable and temporary emotions in which one emotion quickly becomes another. Their resilience is not inadequate, and a proper emotional state is only reluctantly expressed in response to different situations. Emotional blunting refers to people who lack a corresponding inner emotional experience to stimuli that can usually cause a distinct emotional response. They have little need for resilience and sensitivity to context, as they may simply be unaware of their inner emotional state or that of others, and their emotional state remains calm. The emotional-style scale is beneficial for understanding the inner state of teenagers. In particular, almost half of students tend to emotional lability, and they must learn emotional management. Staff who work in gifted education should be concerned with the emotional state of gifted students in junior high school.
In addition, there were two limitations in the study. Firstly, the CESS was designed as a brief self-report instrument for gifted junior high school students. Self-report measures come with subjective thinking, feeling or responses to social preferences. Other, potentially more objective measures should complement its use. Secondly, the study didn’t confirm the emotional state of different emotional types of students, such as the relationship between depression, well-being, and so on. Gather more data to verify whether the classification was correct or interview different emotional types of students to determine their thinking or inclination regarding the emotional style. The Chinese version of the emotional style scale will need to be assessed for different samples, and different emotional types will also need to be verified. The relationship among other variables will be explored in the future.
Footnotes
Declaration of Conflicting Interests
The author declared no potential conflicts of interest with respect to the research, authorship, and/or publication of this article.
Funding
The author received no financial support for the research, authorship, and/or publication of this article.
Data Availability Statement
Data sharing not applicable to this article as no datasets were generated or analyzed during the current study.