
Abstract
The study aimed to explore the Chinese version of the Frost Multidimensional Perfectionism Scale suitable for gifted junior high school students and to classify the types of perfectionism. The Frost Multidimensional Perfectionism Scale was translated into Chinese to evaluate the factor structure and typology of academically gifted students in Taiwan. The exploratory factor analysis revealed a three-factor structure with 31 items in a 212 junior high school student sample. The validation study included a total of 498 academically gifted students. Factor analyses produced three rather than the six previously predicted factors. With some modifications, confirmatory factor analysis and accepted composite reliability supported the same three-factor structure. The study used 18 items to validate the three-structure and discovered three types of perfectionists: healthy, unhealthy, and non-perfectionist. The study supported the tool’s effectiveness in determining the state and typology of perfectionism in gifted students.
Plain language summary
The aim of the study was to development the Chinese version of Frost muiltiple-dimension perfectionism scale for gifted students in junior high school.
Keywords
Introduction
Most people consider high achievement as a good thing. Striving for excellence can push one to achieve excellent performance and demonstrate character strength. Athletes, for example, often devote significant time to training and striving to become champions in their respective sports. In Taiwan, parents expect their children to have a bright future, so academic achievement burdens students with lots of stress and pressure. The pressure from their parents’ expectations influences students to set high standards and strive for good grades. However, some people have tried their best to be perfect in many areas, but they sometimes get frustrated in one or more aspects due to self-criticism. As gifted students achieve full marks in many subjects, they continue to set ideal goals, even striving for perfection. Most of them are never satisfied with their performance, even though they know they may face inevitable failure or setbacks at some point. Fear of failure and lack of achievement influence students to become bored and uninterested in their work, especially if they try to maintain perfection (Burdick, 1997). When teachers recognize the specific symptoms associated with gifted students’ perfectionism, they can transform the negative stereotype and use it in presenting perfectionism positively and helping students develop positive personal development (Burdick, 1997). For gifted students, it is necessary to create a multidimensional perfectionism scale.
Perfectionism is a common personality trait among gifted students, and it can negatively impact every aspect of their lives. This personality trait involves setting unrealistic standards and expectations for oneself and striving for flawlessness. Additionally, perfectionism usually comes with a tendency to overly criticize and evaluate oneself in relation to achieving the desired standards (Piotrowski & Bojanowska, 2021). In her seminal research on gifted children, Hollingworth (1926) identified perfectionism as an emotional state of giftedness. Aside from perfectionism, gifted students exhibit other unique features, such as asynchronous development of intellectual and emotional areas, sensitivity, and emotional intensity (Schuler, 2002). Gifted students also face significant stressors in their daily lives; if they continue to strive for perfection, they may become extremely overwhelmed and stressed (Burdick, 1997). Perfectionism is one of the affective domains in Taiwan’s new 12-year syllabus, and teaching gifted students how to overcome it is one of the main concerns needed to be considered in designing the curriculum. A Chinese version of the perfectionism scale is necessary to understand the affective state of gifted students in junior high school.
Literature Review
Definition and Measurement of Perfectionism
Perfectionism is defined as imposing standards for oneself or others that exceed the appropriate level for the given situation (Hollender, 1965; Jokste & Koļesņikova, 2019). In his self-actualization theory, Maslow (1970) reported striving for perfection (Jokste & Koļesņikova, 2019). Meanwhile, Hamachek (1978) discovered the dual nature of perfectionism for the first time, including the normal or neurotic type, which positively or negatively impacts personal growth (Jokste & Koļesņikova, 2019). Most researchers agreed with Hamachek’s (1978) proposed two-dimensional model of perfectionism, which included positive/adaptive and negative/maladaptive forms (Jokste & Koļesņikova, 2019). The unidimensional concept of perfectionism has evolved into a multidimensional approach. Perfectionism can result in affective dysfunctional states, such as anxiety or depressive symptoms, but it can also result in a positive state, such as superior performance and academic achievement (Sastre-Riba et al., 2019). Nowadays, perfectionism has multiple dimensions, with observation and measurement approaches for different profiles (Sastre-Riba et al., 2019). As a result, researchers are now focusing on better understanding the many differences between each perfectionism typology.
Many perfectionism instruments, such as the Frost Multidimensional Perfectionism Scale (FMPS), the Hewitt and Flett Multidimensional Perfectionism Scale (HWMPS), and the Big Three Perfectionism Scale (BTPS), have been developed based on the multidimensional concept of perfectionism. Hewitt and Flett (1991) proposed a multidimensional approach to define perfectionism and discovered its three facets: (a) self-oriented perfectionism (SOP), (b) other-oriented perfectionism (OOP), and (c) socially prescribed perfectionism (SOP). Smith et al. (2016) developed the BTPS and assessed three higher-order global factors (rigid perfectionism, self-critical perfectionism, and narcissistic perfectionism) and ten lower-order perfectionism facets, including self-oriented perfectionism, self-worth contingencies, concern over mistakes, doubts about actions, self-criticism, socially prescribed perfectionism, other-oriented perfectionism, hypercriticism, grandiosity, and entitlement.
Although several perfectionism scales exist, the Multidimensional Perfectionism Scale (FMPS) developed by Frost et al. (1990) has been widely used due to its ability to provide constructive information in an intrapersonal context through six subscales: (a) concern over mistakes (CM), (b) personal standards (PS), (c) parental expectations (PE), (d) parental criticism (PC), (e) doubts about actions (CA), and (f) organization (O). Most Taiwanese parents expect their children to behave well and get higher achievements. Parents’ expectations and criticism significantly impact gifted students’ tendency to be a perfectionist. The parent expectation and parent criticism subscales in the FMPS were consistent with the Chinese culture. More importantly, FMPS is the most culturally appropriate measure of perfectionism in Taiwan as it can measure parent-child interactions. This study aims to determine whether FMPS is an appropriate measure of perfectionism among gifted junior high school students.
Frost Multidimensional Perfectionism Scale Dimension
The FMPS is suitable for different people samples and has shown strong psychometric properties in mostly ethnic-majority adults and young people samples in both clinical and community-based settings, such as European-American undergraduate samples (Burgess et al., 2017). Despite its increasing use in personality and clinical research, FMPS has received criticism for its factor instability across samples. Several studies have presented different results, claiming that the scale had three (Purdon et al., 1999), four (Hawkins et al., 2006; Khawaja & Armstrong, 2005; Stöber, 1998; Zhu, 2006), five (Chan, 2009; Cheng et al., 1999; Piotrowski & Bojanowska, 2021; Siegle & Schuler, 2000; Sondergeld et al., 2007; Stallman & Hurst, 2011), or six factors (Akhavan Abiri et al., 2019; Coreia et al., 2017; Frost et al., 1990; Gelabert et al., 2011). The FMPS was analyzed as a three-factor structure on a clinically anxious sample, including fear of mistakes, goal/achievement orientation, and perceived parental pressure (Purdon et al., 1999). Furthermore, a two-factorial structure should also be considered carefully, with PS and O as one factor and CM, DA, PC, and PE as the other (Frost et al., 1993). After reviewing the results of previous studies, the researchers encountered difficulties in proposing an explicit hypothesis regarding the factorial structure and the number of factors in the FMPS scale.
Stöber (1998) used varimax rotation to replicate PS and O as separate factors, combined CM with O and PE with PC, and proposed reducing FMPS to four subscales. Stumpf and Parker (2000) discovered a four-factor structure, including concerns and doubts, personal standards, organization, and parental pressure. On the other hand, Hawkins et al. (2006) identified a four-factor structure similar to Stumpf and Parker’s (2000), including CMDA, PEPC, O, and PS. The former, however, is referred to as FMPS-24 items, while the latter is referred to as FMPS-33 items (Stumpf & Parker, 2000). Zhu (2006) discovered the FMPS-25 item with a four-factor structure, including personal standards, parental expectations, parental criticism, and concern over mistakes. Cheng et al. (1999) examined the FMPS-27 items and identified a five-factor structure, including CM, PE, O, PS, and DA (Cheng et al., 1999). Siegle and Schuler (2000) reported a five-factor structure with 26 items, including CM, O, PS, PE, and PC. Sondergeld et al. (2007) also discovered a five-factor structure with 34 items. However, PE and PC were combined with parental pressure; the other factors were the same as Frost et al.’s (1990). Piotrowski and Bojanowska (2021) suggested that the most appropriate factor structure of the adapted version of the FMPS contains five correlated factors: CM, DAA, PE, PC, and PS, and three core facets of perfectionism as measured by the FMPS: CM, DAA, and PS scales.
Chan (2009) discovered three types of perfectionism among gifted students: unhealthy perfectionists, healthy perfectionists, and non-perfectionists, and supported a five-factor model that includes constructs of personal standards, parental expectations, parental criticism, concern over mistakes and doubts, and organization in FMPS. Meanwhile, Stallman and Hurst (2011) identified the five-factor model of the FMPS with 29 items, which was a good fit for the university student population, and supported second-order constructs commonly mentioned as adaptive and maladaptive perfectionism. Coreia et al. (2017) found the six-factor structure of the FMPS using a 21-item questionnaire which could generate a total perfectionism score and scores for the six subscales that reflect specific domains of perfectionism. Data analysis revealed that FMPS with a six-factor structure had acceptable reliability and validity in Iranian non-clinical samples (Akhavan Abiri et al., 2019). Gelabert et al. (2011) used the confirmatory factor analysis to test the three, four, and six-factor structures of FMPS and discovered that the six-factor model produced better fit indices. Amaral et al. (2013) also investigated 217 college students and supported the two-factor structures (of four and six dimensions) of the Portuguese version of the FMPS. The six-component solution, which explained 61.02% of the total scale variance, outperformed the four-component solution, which explained 51.88% of the total scale variance.
While several researchers used the FMPS to conduct studies in various situations, the factor structure of previous studies produced different results and highlighted the problems of weak or cross-loading items in original analyses conducted by Frost et al. (1990). Subsequent studies discovered a substantial number of cross-loading items in six-factor (Parker & Adkins, 1995), four-factor (Stöber, 1998; Stumpf & Parker, 2000), and three-factor solutions (Purdon et al., 1999). Considering the persistent issue of cross-loading items and factorial instability, it is necessary to re-evaluate the scale. This study aims to explore the psychometric properties of FMPS and the different types of perfectionism among junior high school gifted students. Specifically, the researchers of this study adopted the exploratory factor analysis to discover the factor structure of the FMPS and then used the conformity factor analysis to validate the factor structure, reliability, and validity.
Typology of Perfectionism
Hamachek (1978) was the first to identify two types of perfectionism: normal perfectionism and neurotic perfectionism. Normal perfectionism is characterized by setting high standards, focusing on organization and order, and accepting imperfect performance (Hamachek, 1978). On the other hand, neurotic perfectionism is more concerned with setting exceptionally high standards but still focusing on imperfect performance (Hamachek, 1978). To date, the concept of perfectionism has evolved from a one-dimensional to a multidimensional perspective. Many perfectionism instruments were previously developed for different subjects and areas, such as gifted students and college students in America and Hong Kong, among others. Hewitt and Flett (1991) proposed a multidimensional conceptual framework based on the personal and social reasons that generally underlie the pursuit of exceptionally high and strict achievement standards (i.e., perfectionism). Flett et al. (1994) constructed a multidimensional perfectionism scale from the interpersonal perspective and discovered three types of perfectionism: self-oriented perfectionism, other-oriented perfectionism, and social prescript perfectionism.
Slaney et al. (2001) used the revised version of the almost perfect scale to examine academically gifted students in high school and identified two types of perfectionism: adaptive perfectionism (high standard, order) and unadapted perfectionism (discrepancy). Tung (2007) developed a perfectionism scale for college students, including six subscales: high standards, order, self-appreciation, over-concern mistakes, and dissatisfaction. The scale was then divided into two types: positive and negative perfectionism. Through a child-adolescent perfectionism scale with three-structure, O’Connor et al. (2009) discovered three types of perfectionism, including socially prescribed perfectionism, self-oriented-striving perfectionism, and self-oriented-critical perfectionism. Razmi et al. (2020) identified a three-cluster solution (adaptive, maladaptive, and non-perfectionist) using cluster analysis. They proposed that adaptive perfectionism was associated with higher levels of effort and persistence, while maladaptive perfectionists showed high levels of effort investment but not persistence. Most researchers used different measurement instruments based on different concepts of perfectionism to its different types. This approach proved that there are various concepts of perfectionism and confirmed two or three types of perfectionism.
Some researchers attempted to combine different perfection concepts and instruments to develop a new theoretical model of perfectionism. For example, Hill et al. (2004) combined two multidimensional perfectionism scales, which were adopted from Frost et al. (1991) and Flett et al. (1991), to construct the perfectionism inventory, which was divided into two types of perfectionism: conscientious perfectionism and self-evaluative perfectionism. Gaudreau and Thompson (2010) proposed the 2 × 2 model of perfectionism, claiming that the combinations of evaluative concerns (ECP) and personal standards perfectionism (PSP) were the necessary crux traits to distinguish four subtypes of perfectionism: non-perfectionism, pure personal standards perfectionism, pure evaluative concerns perfectionism, and mixed perfectionism. Through the analogy of a Latin square design, Kljajic et al. (2017) discovered the four prototypical subtypes of perfectionism, including non-perfectionism (low SOP and low SPP), pure SOP (high SOP and low SPP), pure SPP (high SPP and low SOP), and mixed perfectionism (high SOP and high SPP). To make the Big Three Perfectionism Scale, Smith et al. (2016) used most perfectionism instruments, such as the three types of perfectionism from Flett et al. (1991) and the two subscales of the perfectionism scale from Frost et al. (1990), and found three higher-order global factors via ten lower-order perfectionism facets. This approach proved that when researchers use different perfectionism instruments to investigate a variety of subjects, they will discover different types of perfectionism.
Adelson (2007) observed perfectionism among academically talented fourth graders and proposed five types of perfectionists: academic achievers, risk evaders, aggravated accuracy assessors, controlling image managers, and procrastinating perfectionists. Parents of gifted students almost expect their children to obtain great achievements, as most gifted students in Taiwan tend to be academic achievers. Parents’ expectation for their children is similar to the two subscales of the FMPS, including parental expectation and parental criticism. The study chose the FMPS to test gifted students in junior high school based on parents’ influence on their perfectionism. Many researchers have used the FMPS to investigate gifted students both at home and abroad and found two types (Parker & Stumpf, 1995), three types (Mofield et al., 2016; Parker, 1997; Schuler, 2000), and four types (Chen, 2011; Dixon et al., 2004) of perfectionism.
Adaptive and maladaptive perfectionists were the two types of perfectionism (Parker & Stumpf, 1995). Meanwhile, the three types of perfectionism include non-perfectionist, healthy/positive/functional perfectionist, and unhealthy/neurotic/negative perfectionist (Mofield et al., 2016; Parker, 1997; Schuler, 2000). Schuler (2000) discovered that 87.5% of gifted teenagers were perfectionists: 58% are healthy perfectionists, and 29.5% are neurotic perfectionists. A two-step cluster analysis of perfectionism scores revealed that academically gifted teenagers have four types: mixed-adaptive, mixed-maladaptive, pervasive, and self-assured non-perfectionist (Dixon et al., 2004). Chen (2011) also discovered four clusters of gifted students in junior high school, including non-adaptive non-perfectionism, non-adaptive perfectionism, adaptive perfectionism, and adaptive non-perfectionism. The FMPS demonstrated that different types of perfection were measured. The study attempted to explore the different typologies of perfectionism among gifted students using cluster analysis.
Method
This study utilized survey research and random sampling. Since the original participants were diverse, it took a two-stage study to determine whether FMPS was appropriate for gifted junior high school students. The study included both a pilot study and a formal study.
Participants
In the pilot study, 212 general students (106 men; 106 women; 112 eighth grade; 100 ninth grade) were invited to complete a self-report questionnaire. A total of 498 academically gifted students (286 men, 201 women, and 11 unknown; 212 seventh grade, 277 eighth grade, and nine unknown) in 18 junior high schools in Kaohsiung were asked to complete a self-report questionnaire in the formal investigation.
Measures
The FMPS was primarily used in the measurement of this study. The FMPS (Frost et al., 1990) was designed to assess individuals’ perfectionism on a five-point Likert scale. The FMPS comprises the following six factors and 35 items, including (a) concern over mistakes (9 items to reflect one’s negative reactions to doing something wrong), (b) personal standards (7 items to assess one’s self-requirement to set high standards), (c) parental expectations (5 items to measure one’s parents setting high standards for them), (d) parental criticism (4 items to assess the perception of one’s parents being overly critical of themselves ), (e) doubts about actions (4 items to reflect one’s doubt against their capability and decision ), and (f) organization (6 items to reflect one’s habit of being organized) (see Table 1).
The Original Items and α-Value of the FMPS.
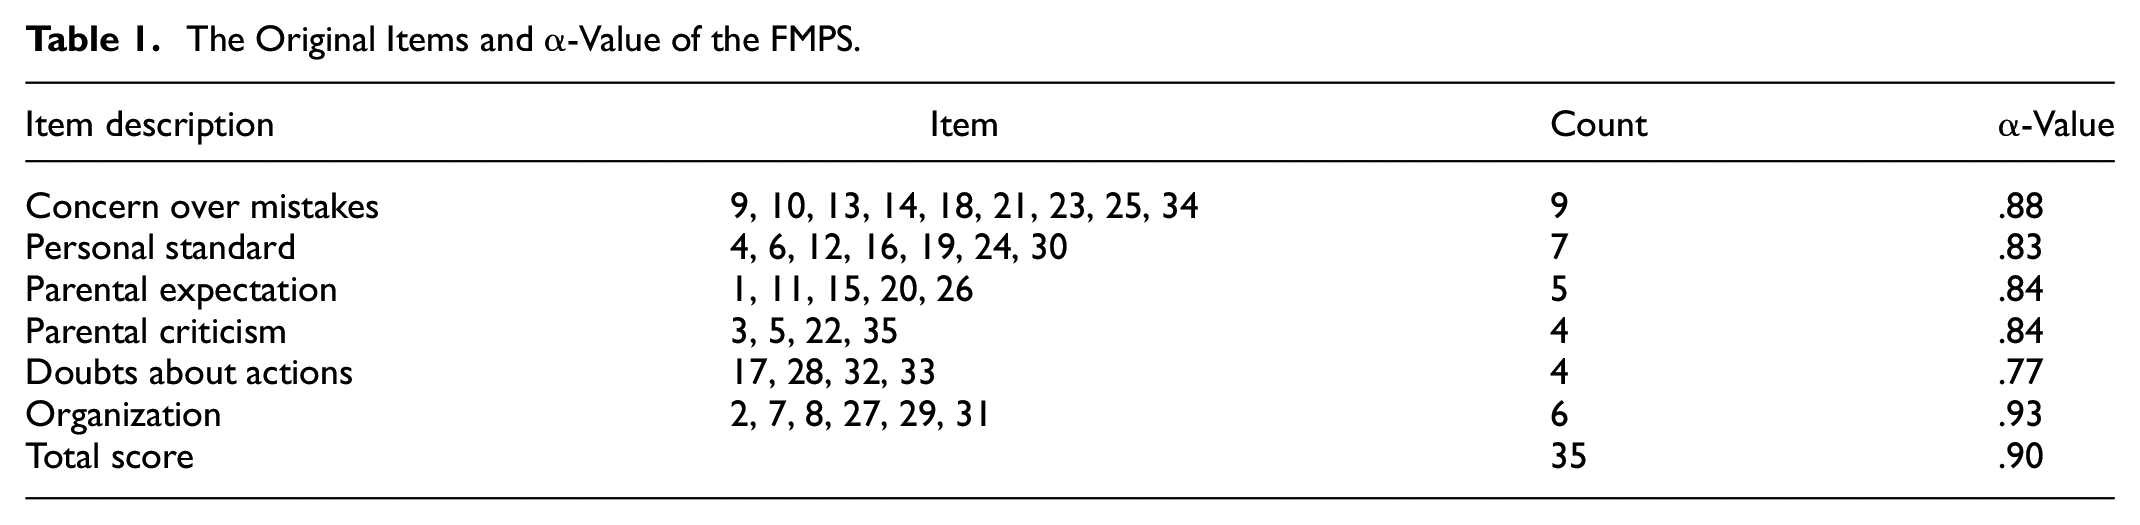
Three junior high school teachers and one doctoral student of the Chinese department revised and translated all FMPS items into Chinese. The revised scale was then distributed to gifted experts who provided professional suggestions in the final version to ensure content validity. There was good internal consistency and convergent validity with other measures of perfectionism in the community and clinical samples of adults (Frost et al., 1990; Purdon et al., 1999). FMPS with female college students in the United States included 35 items, the coefficient alpha of the subscale, and the total score (Frost et al., 1990).
Data Analysis
The study used three strategies to analyze the six-factor structure of the FMPS suitable for a sample of academically gifted students in junior high school: (a) examining the responses in individual items to assess the quality of those items and of the test as a whole through item analysis, (b) using exploratory factor analysis (EFA) to explore the factor structure of the FMPS, and (c) performing a confirmatory factor analysis (CFA) to verify the factor model. Additionally, the researchers used cluster analysis to examine the different types of perfectionism. The study utilized the Kaiser-Meyer-Olkin (KMO) measure of sampling adequacy and Bartlett’s Test of Sphericity (BTS) to analyze the data before factor extraction to ensure that the dataset characteristics were suitable for exploratory factor analysis. The KMO and BTS results indicated that the psychometric criteria of the data were suitable for factor analysis.
Item analysis and EFA were performed on the data collected from the 212 participants. This was done to validate the factor structure based on the data of the pilot study by using principal component analysis with varimax of orthogonal rotation to determine the factor structure of the 35 FMPS items on SPSS 20.0. Items with primary factor loadings of ≥0.40 (including values rounded to 0.4) were retained, including those not located in more than one factor. Items were removed one at a time if they did not meet these criteria. Factor analyses were repeated until a solution was obtained, in which all the items included met all criteria. In addition, item-total correlations and the Cronbach’s alpha internal consistency coefficient were also computed.
CFA was performed on the 490 participants of the overall sample to assess the model’s goodness-of-fit to the data in the current study. The following goodness-of-fit statistics was employed to assess the factor structure model based on the analyses principles for using structural equation modeling: normed chi-square statistic (χ2), comparative fit index (CFI), Tucker-Lewis index (TLI), and root mean square error of approximation (RMSEA). A good fit was obtained when the normed χ2 is two or lower, the CFI, GFI, and TLI are 0.90 or higher, and the RMSEA is 0.08 or lower (Wu, 2009). The assumption of item normality and the presence of outliers were assessed.
The factor loadings (λ) of the observed variables and the square of the factor loadings were also examined, which provided the amount of variance in the observed variable that the underlying construct could explain, and it was expected that all items of the factor present values are λ 0.50. Adjustments to a specific model with poor fit indices were considered in the CFA, and several different procedures can be used to modify the poor model. The study used additional parameters, specifically modification indices based on MI (>11; p < .001) and theoretical assumptions (Castilho et al., 2015). The study used both the Cronbach’s alpha and composite reliability to assess scale reliability, which provided a much less biased estimate of reliability than alpha and was more appropriate for multidimensional scales (Castilho et al., 2015). The construct validity of the MPS was analyzed using exploratory factor analysis, and the average variance extracted (AVE) was used to ensure discriminant validity using structural equation models. The researchers used the PASW Statistics (version 23) and IBM SPSS AMOS (version 20) to compute the statistical procedures. When the researchers confirmed the factor structure of perfectionism, k-cluster analysis was adopted to investigate the different types of perfectionism.
Results
Item Analysis
The pilot study included 212 junior high school students. In the item analysis, five criteria were used to delete items: the critical ratio, each item related to the total scores, the homogeneity test scores, the reliability test, and the commonality of each item. From Tables 2 to 7, the critical ratio for each item was p < .001, indicating that the items were significant and could precisely reflect the subjects’ reactions.
The Item Analysis of Concern Over Mistakes Subscale in FMPS.
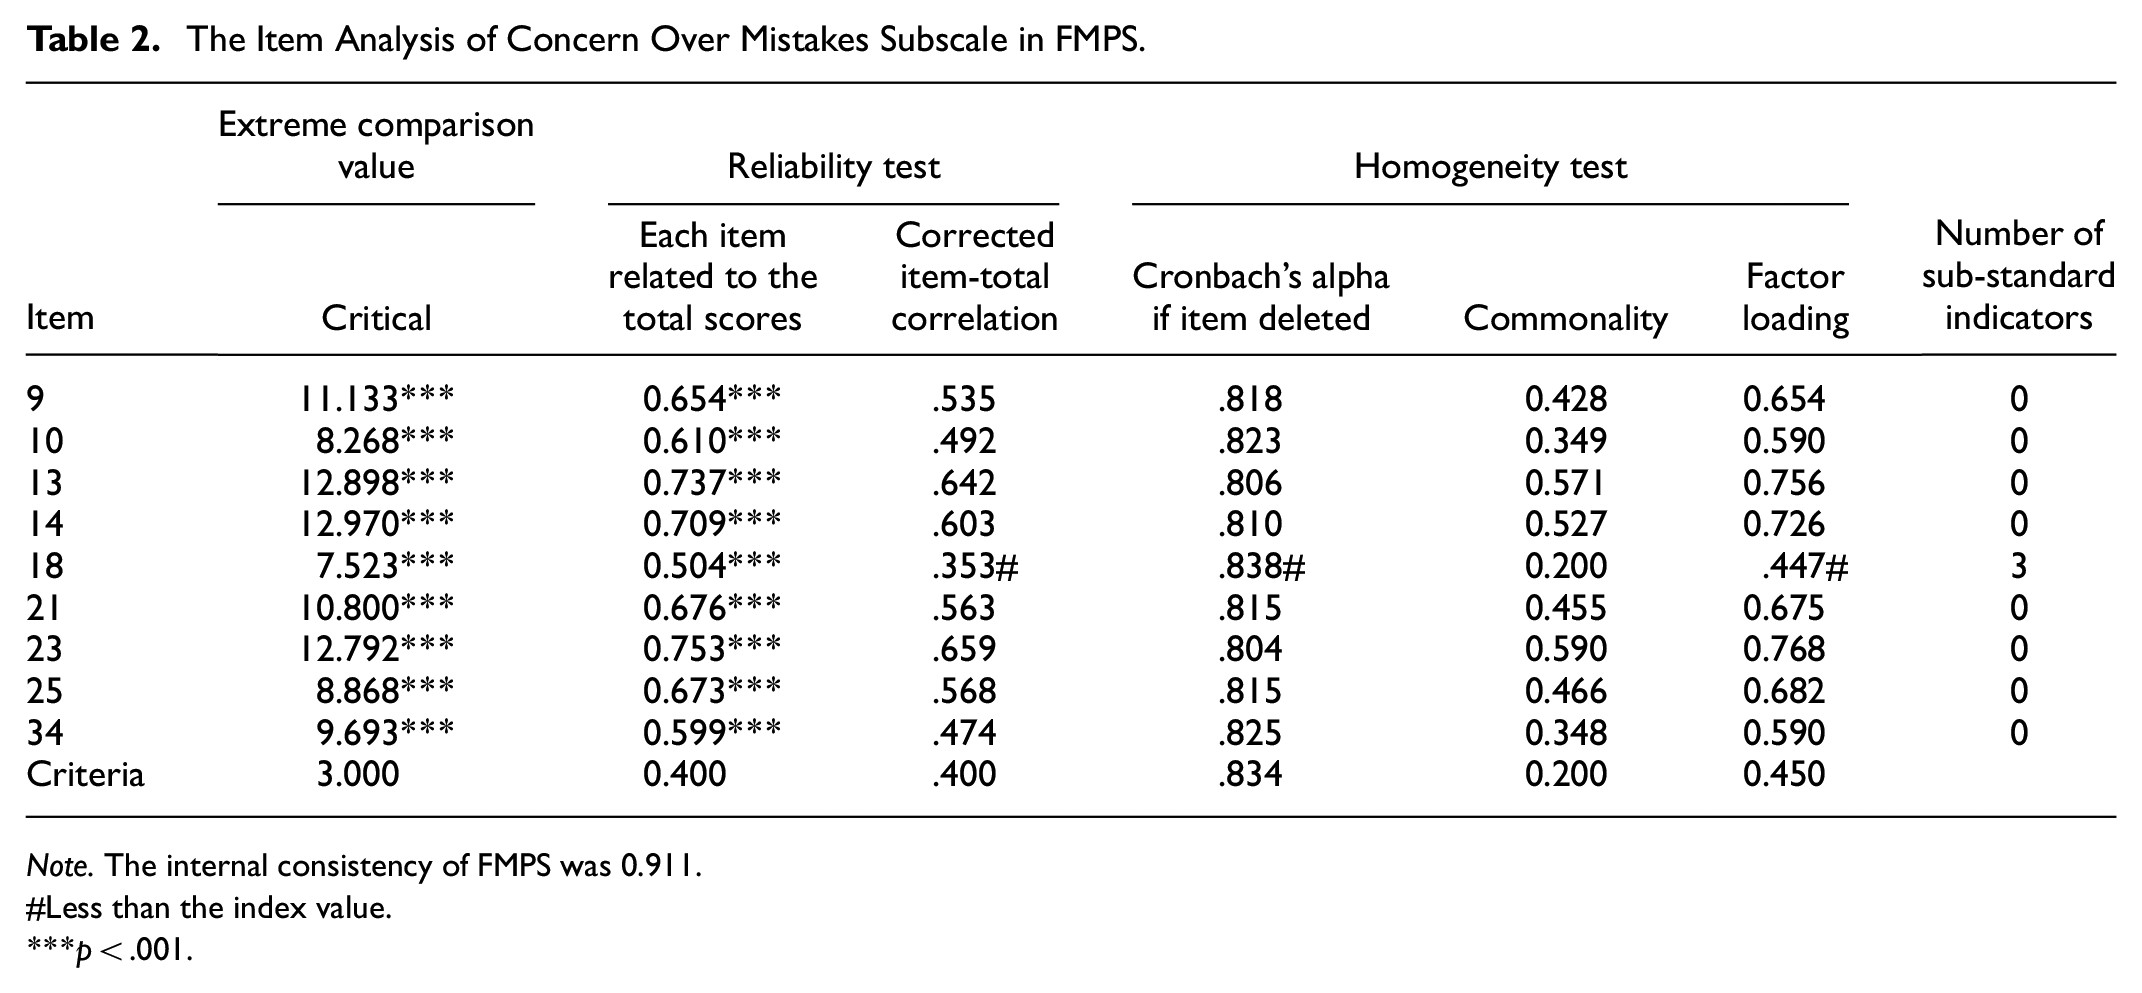
Note. The internal consistency of FMPS was 0.911.
Less than the index value.
p < .001.
The Item Analysis of Personal Standard Subscale in FMPS.

Less than the index value.
p < .001.
The Item Analysis of Parental Expectation Subscale in FMPS.

p < .001.
The Item Analysis of Parental Criticism Subscale in FMPS.

Less than the index value.
p < .001.
The Item Analysis of Doubts About Actions Subscale in FMPS.

Less than the index value.
p < .001.
The Item Analysis of Organization Subscale in FMPS.

p < .001. **p < .01. *p < .05.
Each item was also found to be significantly related to the total scores. On the other hand, Items 3, 32, and 33 did not meet the standard of corrected item-total correlation. Items 5, 24, and 28 failed to meet two standards. Item 18 failed three standards. Further, the study found no items that did not meet four out of the five criteria. There were no items to remove.
Exploratory Factor Analysis
The KMO measure of sampling adequacy was 0.87 (>0.5), and BTS was 3093.138. To perform factor analysis using r software, the study utilized principle components factoring and oblimin rotation. Eigenvalues greater than one and factor loadings above 0.30 were among the criteria. To avoid factor duplication, the scree test was used to generate a graphic visualization illustrating the relationship between eigenvalues and a number of factors. Figure 1 shows that the scree test gradually slowed on three or four factors.

Scree plots with parallel analysis.
Based on the same parallel analysis results, the study chose three factors. Three factors were also chosen for the optimal coordinates. In Table 8, the explained variance of factors 1, 2, and 3 were 23.99%, 8.75%, and 4.62%, and the cumulative explained variance was 37.35%. The study used exploratory bi-factor analysis in r software to ensure the factor structure model.
Variance Explained of the Extracted Factors.

Figures 2 and 3 show that the study compared two bi-factor models with three and four factors and found that the three-factor model was better than the four-factor model because it contains many items across more than one factor. So, the study decided to adopt a three-factor model. As shown in Figure 2, Items 4 and 19 were across factors 1 and 2. Item 12 was across factors 1, 2, and 3, Item 15 was across factors 2 and 3, and Item 20 was across factors 1 and 3. The factor loading of each item in the bi-factor model with three and four factors was shown in Table 9. Except for Item 5, each item in Table 9 was significantly related to the g factor based on the result of the bi-factor model. Except for Items 11, 13, 14, 17, 18, 19, 21, 23, and 25, the factor loadings of most items were less than 0.4. Since Item 5 has no significant relationship to the g factor, the researchers deleted Item 5. Based on the results of the r analysis, the factor number of the fit factor model was three.
Bi-factor model with three lower-level factors.

Bi-factor model with four lower-level factors.
Three-Factor Structure Summary of FMPS.

Note. Items of Factor 1, 2, and 3 in structure matrix and bi-factor structure wewe the same in Table 9. Three factor model of FMPS was evidenced. Factor 1 contained six items of O subscale, six items of PS subscale, and each item in CM and DA subscales, Factor 2 included eight items of CM subscale, three items of DA subscale, and each item in PE and PS subscales, There were four items of PE subscale, and four items of PC subscale in Factor 3,
The first factor incorporated six items from the original organization subscale (Items 2,7, 8, 27, 29, and 31), six items from the original personal standard subscale (Items 4, 6, 12, 16, 19, and 30), Item 18 from the original concern over mistakes subscale, and Item 33 from the original doubts about actions subscale. Except for Item 4, all items in the first factor had factor loadings greater than 0.4. The majority of the items in the first factor were drawn from the organizational and personal standard subscales, and the concepts of Items 18 and 33 were close to the best, so the new first factor was named “Goal orientation.”
The second factor incorporated eight items from the original concern over mistakes subscale (Items 9, 10, 13, 14, 21, 23, 25, and 34), Item 24 from the original personal standard subscale, Item 15 from the original parental expectation subscale, and three items from doubts about actions subscale (Items 17, 28, and 32). Except for Items 10, 15, 17, 24, 28, 32, and 34, the factor loadings of the rest items in the second factor were greater than 0.4. Most items in the second factor were generated from the concern over mistakes subscale, and the concepts of the remaining items showed an inclination toward worry about imperfection. The new second factor was named “Fear of mistakes.”
The third factor combined four items from the original parental expectation subscale (Items 1, 11, 20, and 26) and four items from the parental criticism subscale (Items 3, 5, 22, and 35). Except for Items 1, 3, and 5, the factor loadings of other items in the third factor exceeded 0.4. Most items in the second factor were abstracted from parental expectation and parental criticism subscales. The new third factor was named “Parental pressure.”
The meaning of the item, factor loading, and the state of crossing the factor were the three criteria for deleting the item. As shown in Table 9, there were some items across more than one factor simultaneously, such as Items 4, 12, 15, 19, and 20. For example, Item 20 was across factors 1 and 3. Item 12 was across factors 1, 2, and 3. Items 4 and 19 were across factors 1 and 2, while Item 15 was across factors 2 and 3. Although Items 4 and 19 were across factors 1 and 2, the meaning of the item was appropriate for factor 1. Since the factor loading was above 0.30, Items 4 and 12 would be retained. Although Item 12 was across factors 1, 2, and 3, its meaning was suitable for factor 1, and since the factor loading in the first factor was 0.52, Item 12 would also be retained. Since Item 10s factor loading was close to 0.3, its meaning was suitable for the second factor without cross-loading, so it was retained in the study. Since Item 15 was across factors 2 and 3, and the factor loading in the second factor was equal to 0.30, the study retained Item 15. Because the factor loadings of Items 3, 5, 10, 24, and 28 were less than 0.3 in the bi-factor structure and those of Items 3, 5, 24, and 28 were less than 0.4 in the sorted structure matrix, the researchers deleted the four items. In total, the three-factor model with 31 items best fits the multidimensional perfectionism scale.
Table 10 displays the determined version of Frost’s multidimensional perfectionism scale, the reliability coefficient of three subscales, and the total scale. The factor’s explained common variance was 0.34, while the Maximum of Split-Half Reliabilities in FMPS was 0.95. The result was similar to what Purdon et al. (1999) mentioned about the three-factor solution, which includes fear of mistakes, goal/achievement orientation, and perceived parental pressure.
The Formal Items and α-Value of the FMPS.

Table 11 illustrates the means and SDs for the FMPS (subscales and total scores). According to the mean of each item, gifted students disagreed with the fear of mistakes subscale, and they had a middle attitude toward goal orientation, parental pressure, and perfectionism.
Descriptive Statistics of the Total and Three Perfectionism Subscales (N = 498).
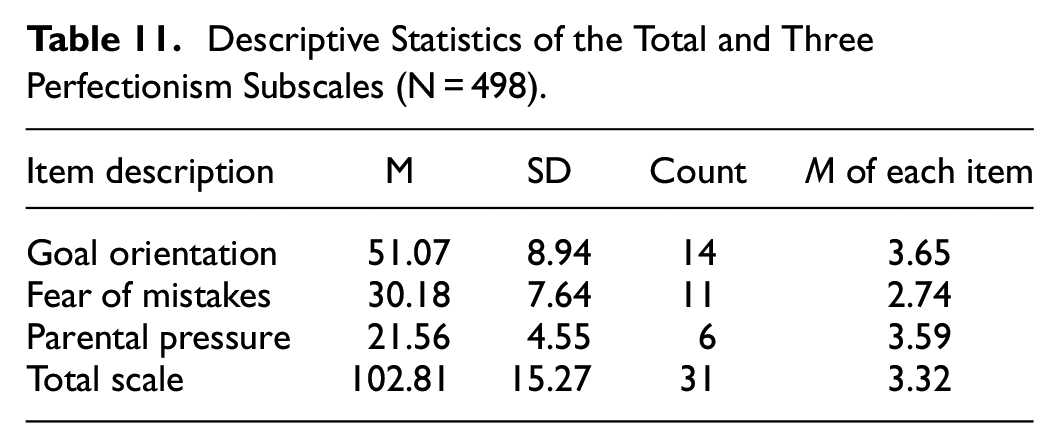
Table 12 shows that the goal orientation subscale was significantly related to the fear of mistakes subscale. Meanwhile, the parental pressure subscale is significantly related to the fear of mistakes subscale. The total scale was significantly related to the three subscales. However, there is no significant relationship between parental pressure and goal orientation subscales. The correlation of each subscale was low to none, but the total score was in the middle to a higher relationship with the three subscales. The FMPS revealed a common factor: perfection was evident.
The Relationship Among Three Perfectionism Subscales (N = 498).

p < .001.
Confirmatory Factor Analysis
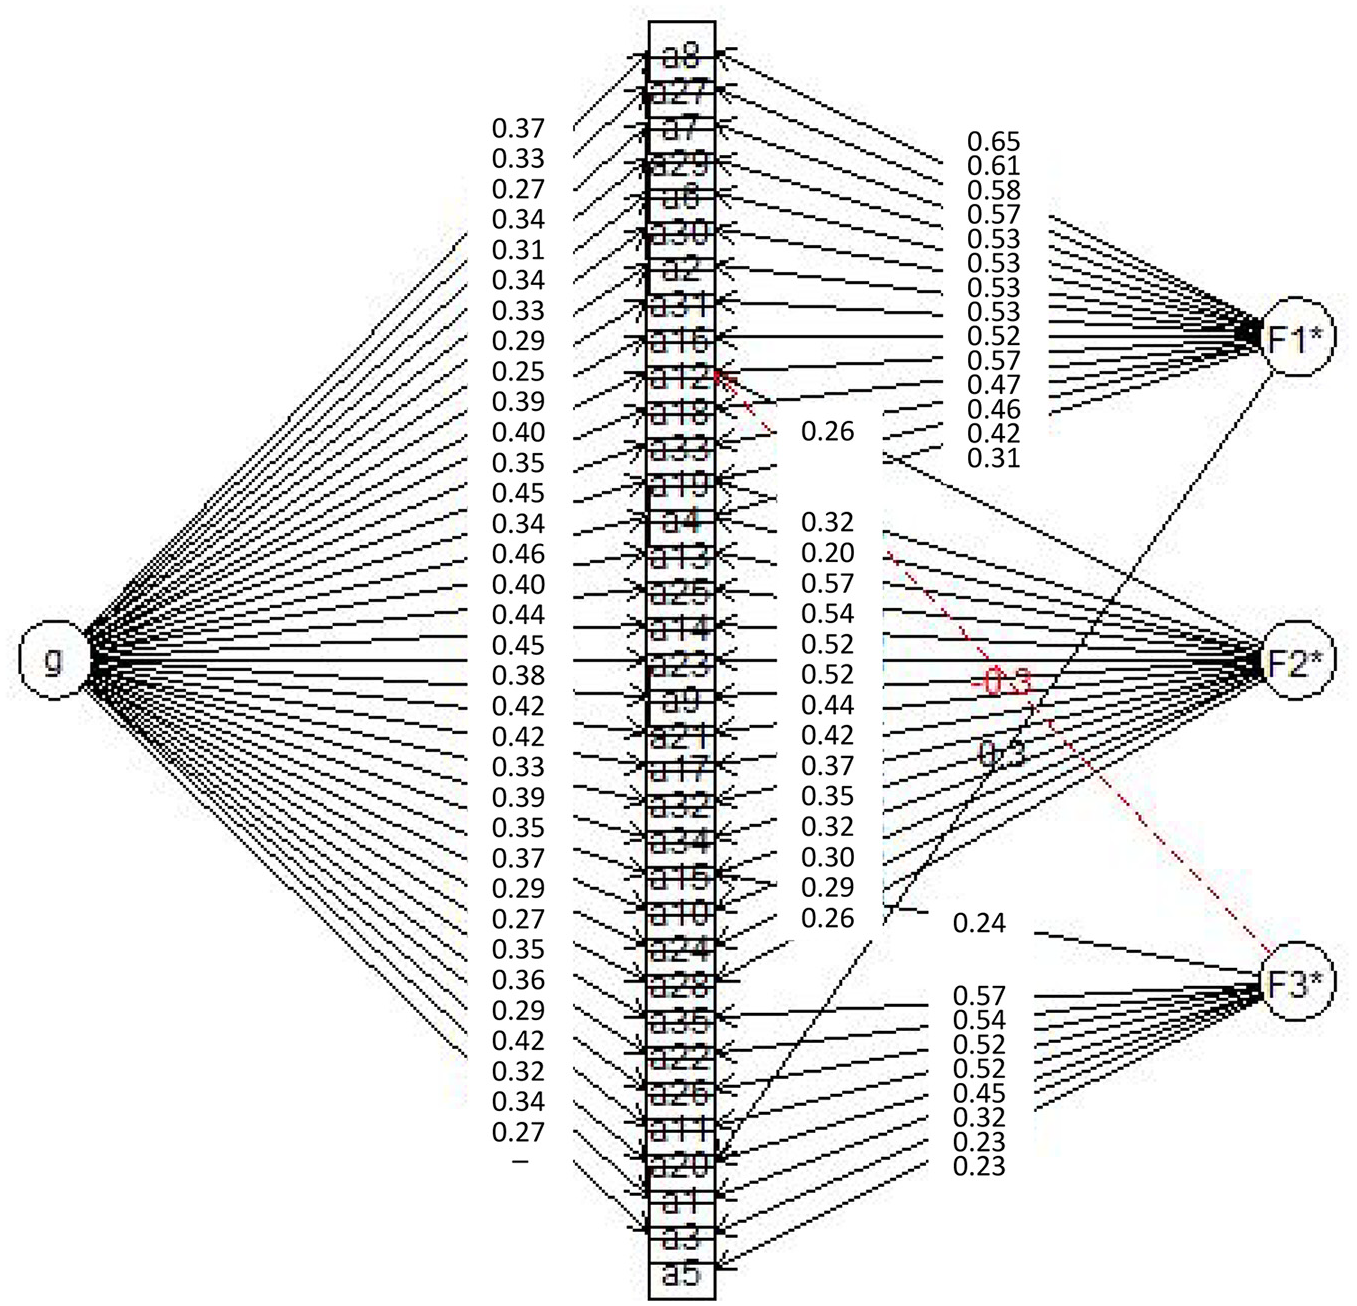
Through CFA, the study adopted robust maximum likelihood to this factor solution. All items were specified to load only on their respective factors, no error covariance was allowed to correlate, and correlations between the latent constructs were estimated freely. These subscales constituted a total score representing a participant’s overall level of perfectionism: goal orientation, fear of mistakes, and perceived parental pressure subscales. As shown in Figure 4, the factor loadings of these subscales were as follows: for goal orientation, 0.36 to 0.70; for fear of mistakes, 0.26 to 0.69; for perceived parental pressure, −0.11 to 0.53; for g factor, −0.22 to 0.81.

Bi-factor CFA model of multidimensional perfectionism scale.
An initial test of the measurement model yielded some inappropriate and non-interpretable parameter estimates and less than desirable fit indexes: χ2 = 1624.20, p < .001; χ2/df = 4.06; GFI = 0.81; CFI = 0.81. This model’s adaptability was poor and did not provide an adequate fit to the data. Inspection of standardized residuals and modification indexes suggested that the model be modified.
The fear of mistakes subscale and the parental pressure subscale (r = −.14) had no significant relationship, and the covariance between these subscales was −0.034 (p = .0.71 > .05). However, there is a correlation with other potential variables, with correlation coefficients between .337 and .373, indicating a low correlation. The error variation of the measurement model ranged between 0.19 and 1.09, with a significant level of 0.001. The parameter estimation correlation had an absolute value between −.39 and 1.39. Except for the four reference indicators, the parameters and the critical ratio to the parental pressure subscale of Items 22 (−0.389, p = .058), 35 (−0.305, p = −.131) and the parameters and the critical ratio to the perfectionism of Items 6 (0.010, p = .830), 12 (−0.014, p = .795), 19 (0.043, p = .448), 27 (−0.067, p = .204), 29 (−0.094, p = .102), 30 (0.085, p = .077), the path coefficients of the 50 measurement variables are all significantly correlated. Regarding the estimates and C.R. test error variance, the factor loading of Items 6, 12, 19, 22, 27, 29, 30, and 35 failed to reach the significance level, indicating that the model was not suitable for the basic model fit index. The unsuitable items were deleted from the study.
The study used the modification indices to modify the model and decide whether to delete the unsuitable item based on the relationship between each item and potential variables. First, items that were unrelated to the potential variable were deleted from the study. According to the modification index of the multidimensional perfectionism measurement model, the correction then focused on the correlation among some residuals and selected the largest modification indices coefficient of items connected first. If the measurement error of two items was related, the study would delete one of the items based on the highest amount of modification indices coefficient. The study modified the model several times and deleted Items 4, 7, 12, 16, 18, 19, 30, and 33 in the first factor, Items 10, 13, 15, and 17 in the second factor, and Item 1 in the third factor. The revised model of the multidimensional perfectionism scale is shown in Figure 5.

Bi-factor CFA model of revised multidimensional perfectionism scale.
A significant correlation was evident between goal orientation, the fear of mistakes, and parental pressure. The reliability coefficient of goal orientation and the fear of mistakes was 0.304 (p < .001), while the reliability coefficient of goal orientation and parental pressure was 0.176 (p = .012 < .05). The reliability coefficient of fear of mistakes and parental pressure subscale, on the other hand, was 0.268 (p = .014 < .05). Table 13 shows that the final test of the revised measurement model produced some appropriate and desirable fit indexes, such as χ2/df, GFI, CFI, and so on. Except for the RMR, RFI, and CN, the other indexes reach the standard, indicating the model’s adaptability.
The Overall Model Fit Summary of Revised Multidimensional Perfectionism Scale.

p < .001.
Except for the two reference indicators, the parameters and the critical ratio of Items 11 (1.124, p = .261) and 20 (−0.333, p = .739) to perfectionism did not reach the significant standard. However, the path coefficients of the rest measurement variables were all significantly correlated, as shown in the fit of the internal structure model in Table 14. Except for the squared multiple correlations of Items 6, 9, 31, 32, and 34 were below 0.40, the remaining items were above 0.40. Except for the standardized parameter estimates of Item 32 (to fear of mistakes), 22, 35 (to parental pressure), 2, 6, 8, 9, 11, 14, 20, 21, 25, 26, 27, 29, 31, 32, 34 (to perfectionism), were less than .40, the remaining items were greater than .40. The fit of the internal structure model was evident.
The Fit of Internal Structure Model of Revised Multidimensional Perfectionism Scale.

p < .001. **p < .01. *p < .05.
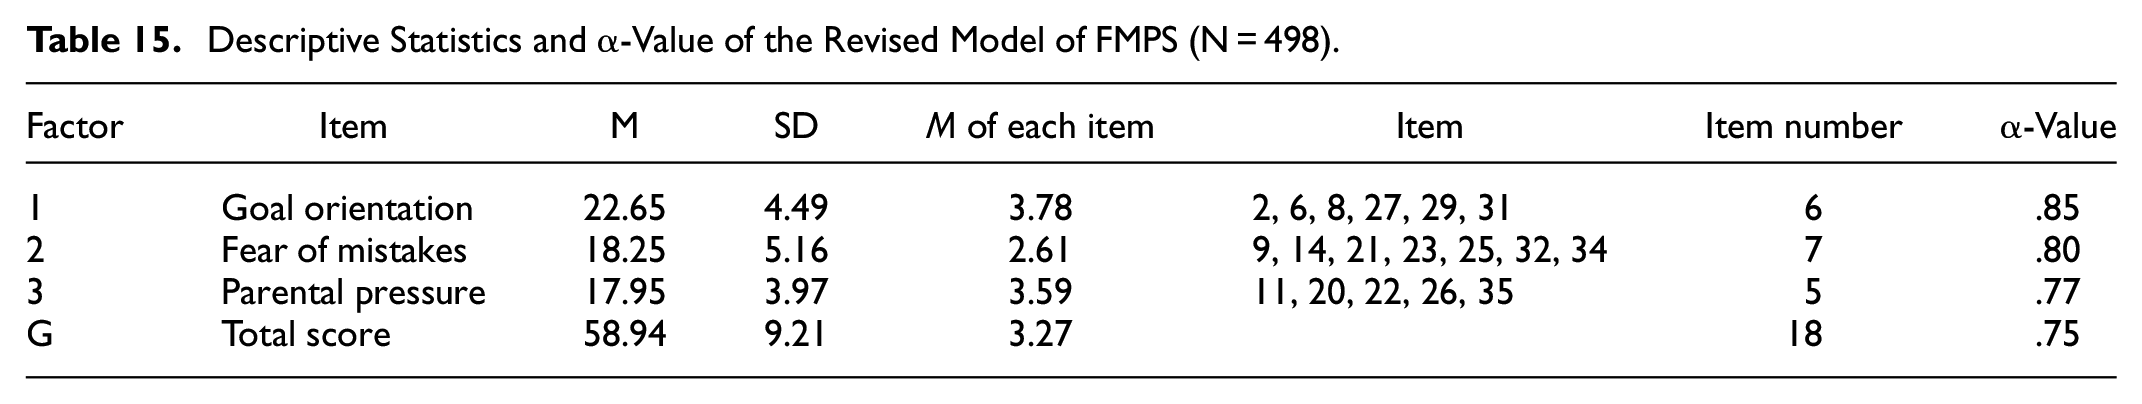
Table 15 illustrates the means and SDs for the FMPS (subscales and total scores). Students had moderate attitudes toward goal orientation, parental pressure, and whole perfectionism, and they were not frequently afraid of making mistakes. The Cronbach’s a for goal orientation, fear of mistakes, parental pressure, and total score were all greater than .70, demonstrating the modified FMPS’s reliability.
Descriptive Statistics and α-Value of the Revised Model of FMPS (N = 498).
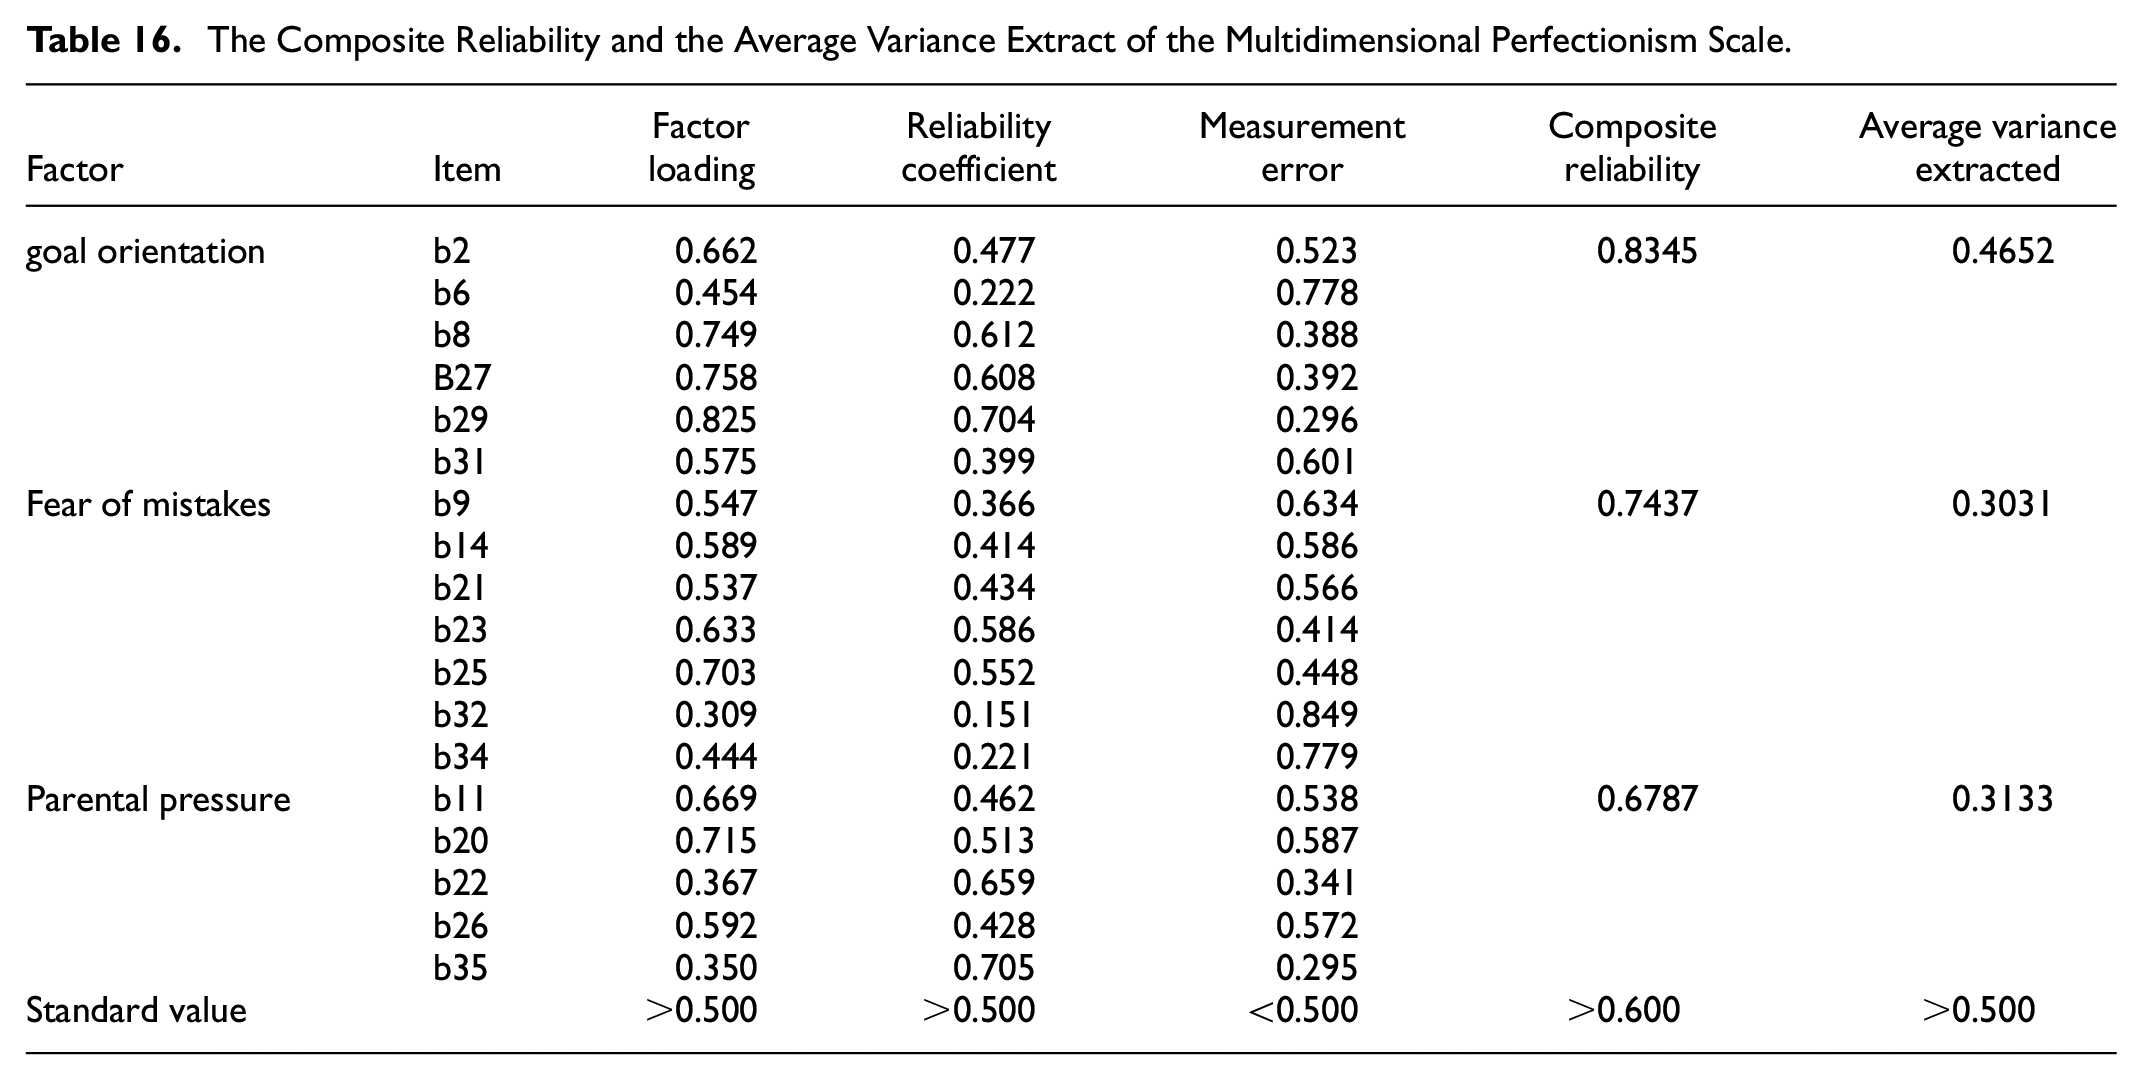
Except for Items 6, 22, 32, 34, and 35 in Table 16, the factor loading of the other items was greater than 0.50. Except for Items 6, 9, 11, 14, 21, 26, 31, 32, and 34, whose reliability coefficient is lower than 0.50, the rest items met the cut-off. Meanwhile, the rest items did not reach the cut-off except for the measurement error of Items 8, 22, 23, 25, 27, 29, and 35, which was lower than 0.50. The composite reliability of the three factors was 0.60. The average variance of the three factors was all less than 0.50. Although the reliability was evident, the convergent validity did not reach the standard but was still accepted.
The Composite Reliability and the Average Variance Extract of the Multidimensional Perfectionism Scale.
Cluster Analysis
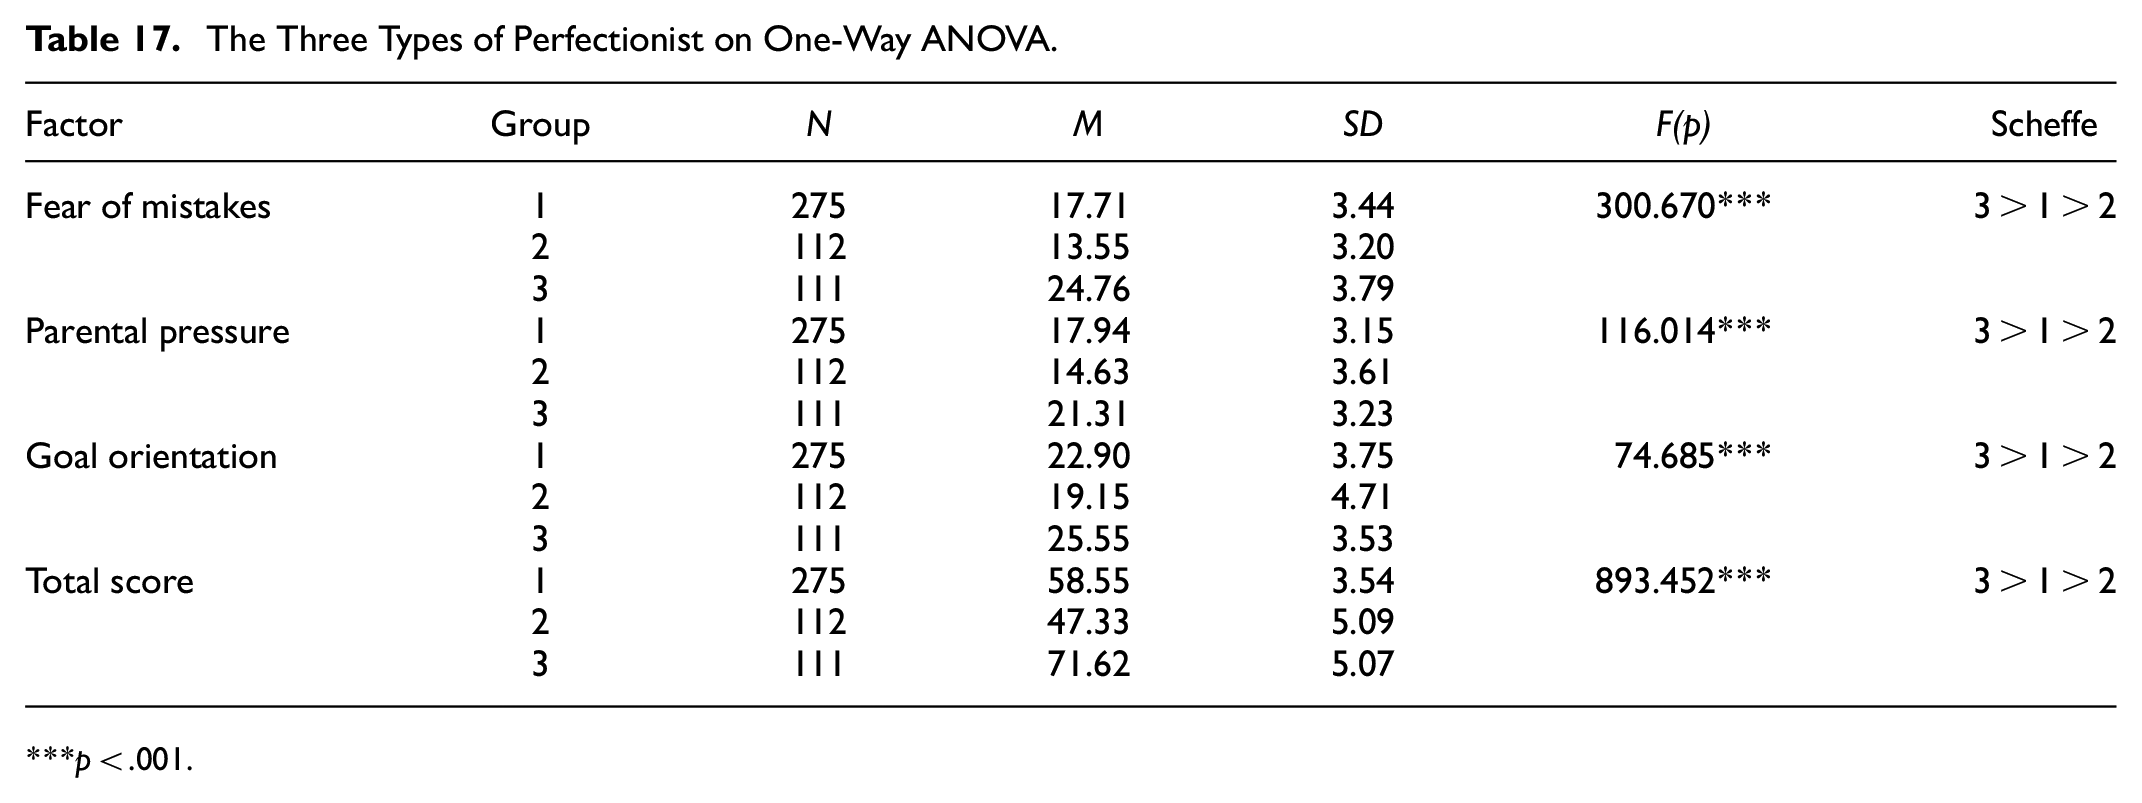
The study used the K-means cluster method to divide gifted students into three groups, as shown in Table 17. Based on the cluster analysis results, gifted students in Group 3 got significantly higher grades in three subscales and total scores than in Groups 1 and 2. Meanwhile, gifted students in Group 1 got significantly higher grades in the three subscales and total scores in Group 2. Gifted students in Group 3 were more goal-orientated, worried about making mistakes, and perceived more parental pressure than those in Groups 1 and 2. The higher grades gifted students got in three subscales and total score, the more perfective they were. The study concluded that Group 3 members were unhealthy perfectionists, representing 22.3% of students; Group 1 members as healthy perfectionists, representing 55.2% of students; and Group 2 members as non-perfectionists, representing 22.5% of students. The sum of perfectly gifted students reached 77.5%.
The Three Types of Perfectionist on One-Way ANOVA.
p < .001.
Discussion
The study discovered that the goal orientation subscale was significantly related to other subscales, while the fear of mistakes was weakly related to parental pressure. However, three subscales were significantly related to perfectionism to varying degrees (middle to high). The revised three-factor structure model was inconsistent with the four-factor structure model (Hawkins et al., 2006; Khawaja & Armstrong, 2005; Stöber, 1998; Zhu, 2006), five-factor structure model (Cheng et al., 1999; Siegle & Schuler, 2000; Sondergeld et al., 2007), and six-factor structure model (Akhavan Abiri et al., 2019; Coreia et al., 2017; Frost et al., 1990; Gelabert et al., 2011), but was consistent with three-factor structure model (Purdon et al., 1999). The three-factor model comprised 25 items, including personal standards and organization, fear of mistakes, and parental pressure subscales. The result of the three-factor model was similar to the six-factor structure model by Frost et al. (1990) because the first factor was combined with personal standard and organization subscales, the second factor with doubts about action and concern about mistakes subscales, and the third factor with parental expectation and parental criticism subscales. The revised structure model was tailored-fit to the junior high school gifted students. The result of the three types of perfectionism observed among gifted students was consistent with the findings of Mofield et al. (2016), Parker (1997), and Schuler (2000). The 77.5% of gifted students who aspired to be perfect was close to the 87.5% of perfective gifted teenagers (Schuler, 2000). The study found that most gifted students were perfectionists.
Concerning the reliability and validity of the revised perfectionism scale. The composite reliability of goal orientation, fear of mistakes, and parental pressure subscales were 0.83, 0.74, and 0.67, respectively. The Cronbach’s alpha values for goal orientation, fear of mistakes, parental pressure, and total score were .85, .80, .77, and .75, respectively. The explanation percentage for goal orientation, fear of mistakes, and parental pressure subscales to perfectionism were 46.52%, 30.31%, and 31.33%, respectively. The revised perfectionism scale had acceptable reliability and validity.
Conclusion
In conclusion, the Chinese version of the FMPS had good psychometric properties and was appropriate for assessing the perfectionism state and typology of gifted junior high school students. Through the scale, school staff, teachers, and consultants could better understand the state and typologies of perfectionism among gifted students. Since the sampling of the study was generated from only one area, the inference and application of the Chinese version of the FMPS were limited. The Chinese version of the FMPS could be utilized to investigate different samples and areas. Furthermore, qualitative research might be used to better explore gifted students’, parents’, or teachers’ perspectives of perfectionism.
Footnotes
Declaration of Conflicting Interests
The author declared no potential conflicts of interest with respect to the research, authorship, and/or publication of this article.
Funding
The author received no financial support for the research, authorship, and/or publication of this article.
Data Availability Statement
All data was presented in the paper.