
Abstract
The purpose of this investigation is to develop and validate a short form of the Generalized Ethnocentrism Scale (GENE). The GENE scale measures people’s tendency to consider their culture as the center of the world. A total of four studies were conducted using samples of college students. In the Study 1 has been examined the underlying factor structure of the GENE measure. Based on this study, the Short Form Generalized Ethnocentrism Scale is proposed (SFGENE-7). In the second study, the two-factor structure evidenced in Study 1, was supported by a confirmatory factor analysis (CFA). The psychometric properties of the short form of the GENE scale were also satisfactory. In the third study, the two-factor structure was submitted again to CFA. The investigation of the relationship between ethnocentrism and external variables was also examined. The results supported the convergent, discriminant and incremental validities. Finally, in the fourth study, temporal stability of the short form of the GENE scale has been assessed. The results demonstrated that the SFGENE-7 had adequate test-retest reliability. Overall, results reveal that the SFGENE-7 has adequate levels of reliability, convergent validity, discriminant validity, and incremental validity. We obtained a short, reliable, and valid instrument to assess ethnocentrism.
Introduction
A recent development in the measurement field is the changing of constructs that have many items to shorter measures based upon a few items only (Schweizer, 2011). The purpose of this investigation is to develop and validate a short form of the GENE scale (Neuliep, 2002; Neuliep et al., 2005; Neuliep & McCroskey, 1997). Currently, short scales are increasingly used to measure psychological constructs, and the prevalent reasons for using them is the saving of evaluation time and related costs (Kemper et al., 2019; Rammstedt et al., 2013). Furthermore, “the demand for short scales is currently expanding at an accelerating speed. One reason for the increasing need for short scales could be a changing way to approach psychological research in general. With research questions becoming more and more complex, involving more and more constructs . . . ” (Ziegler et al., 2014, p. 185). Indeed, it has been evidenced that short scales can be just valid as long and sophisticated scales (Burisch, 1997). Among the useful candidates for the applications of short scales, according to Gosling et al. (2003, p. 505) are “large-scale surveys, pre-screening packets, longitudinal studies, and experience-sampling studies.” A short form of the GENE scale is needed to measure ethnocentrism that can be completed quickly and easily by respondents of certain populations, especially in research designs in which time to complete scales is limited.
Ethnocentrism
Ethnocentrism constitutes an important concept in psychology and social sciences, and it has been studied for more than a century. It was accepted as a universal phenomenon among humans by a large number of scholars (e.g., Gudykunst & Kim, 2003; LeVine & Campbell, 1972; Michailova et al., 2017; Neuliep et al., 2001; Segall, 1979).
The concept of ethnocentrism has been coined before the publication of the book Folkways by the sociologist William Sumner (1906, see Bizumic, 2014). However, Sumner (1906) has contributed enormously to popularize the concept. For this scholar ethnocentrism is a “view of things in which one’s own group is the center of everything, and all others are scaled and rated with reference to it. . . Each group nourishes its own pride and vanity, boasts itself superior, exalts its own divinities, and looks with contempt on outsiders” (Sumner, 1906, p. 13). Sumner (1906) linked this concept to “ingroup” and “outgroup.” This differentiation between “ingroup” and “outgroup” has been fundamental in the investigation of ethnocentrism in psychology (e.g., Brewer, 1979; Tajfel, 1981). The ingroup bias has been referred as “the laboratory analogue of real-world ethnocentrism” (Tajfel &Turner, 1986, p. 13).
There are diverse conceptualizations of ethnocentrism (see Bizumic & Duckitt, 2012). Bizumic et al. (2009) found three wide topics in the ethnocentrism’s definitions: ethnic group self-centeredness, mere ingroup positivity, and outgroup negativity. They argued ethnocentrism as ethnic group centeredness, and the two other topics as conceptually different. For these authors ethnocentrism is multidimensional, involving intragroup and intergroup attitudes.
Over the years diverse measures of ethnocentrism have been developed (Robinson et al., 1991). For example, the California Ethnocentrism (E) scale (Adorno et al., 1950), the British Ethnocentrism scale (Warr et al., 1967), the Australian Ethnocentrism scale (Beswick & Hills, 1969), and the Generalized Ethnocentrism (GENE) scale (Neuliep & McCroskey, 1997) have been used.
More specifically, Neuliep and colleagues developed a measure of ethnocentrism, which they named as the Generalized Ethnocentrism (GENE) scale (Neuliep, 2002; Neuliep et al., 2005; Neuliep & McCroskey, 1997). Neuliep and McCroskey (1997) claimed that the California Ethnocentrism measure was dated given that it targets only white people in United States. Therefore, they developed a tool to assess ethnocentrism independently of the cultural heritage. The conceptualization of this scale is based “on an individual’s cultural, racial, and/or ethnic ingroup-outgroup distinction in conjunction with a cognitive and affective orientation that places the ingroup in a position of centrality and superiority” (Neuliep, 2002, p. 2007). The Generalized Ethnocentrism (GENE) scale has been widely used as a unidimensional measure in previous research (e.g., Boehm et al., 2010; Borden, 2007; Cappell et al., 2008; Goldstein & Keller, 2015; Göncz, 2018; Jacobi, 2018; Ketab et al., 2019; Lin & Rancer, 2003; Neuliep, 2002; Neuliep et al., 2005; Pettijohn & Naples, 2009). Cronbach’s alpha of the GENE scale found in previous research ranged from .82 to .92, and there is demonstration of predictive, concurrent, and construct validities (Neuliep, 2002).
The Present Research
In order to develop and validate a short form of the GENE scale four studies were conducted. In the first study, principal component analysis evidenced the factor structure of the items from Neuliep’s (2002) study. A sample of university students was used. In the second study, the two-factor structure evidenced in Study 1, was supported by a confirmatory factor analysis (CFA), using another sample of college students. The psychometric properties of the short form of the GENE scale were also examined. In the third study, the two-factor structure was submitted again to CFA using another sample of college students. The investigation of the relationship between ethnocentrism and external variables was also examined to evaluate the convergent, discriminant, and incremental validities. Finally, in the fourth study, temporal stability of the short form of the GENE scale has been assessed.
Study 1
This study has two objectives. Firstly, as stated earlier, Study 1 was aimed at exploring a structural analysis of a set of the 15 items that were developed by Neuliep and colleagues (Neuliep, 2002; Neuliep & McCroskey, 1997). Factor analysis is linked to assessment of construct validity of measures (Thompson & Borrello, 1992).
Secondly, the reliability of the GENE will be evaluated. In this line, the reliability of the GENE will be analyzed using Cronbach’s alpha and corrected item-factor correlations. In accordance with P. Kline (2000), an alpha between .70 and .90 is good.
Method
Participants
A total of 170 participants (146 females and 24 males) with ages ranging between 18 and 31 years (M = 19.99; SD = 1.77) have taken part. All respondents self-reported their nationality as Portuguese.
Instrument
Ethnocentrism
To assess ethnocentrism, we used the revised Generalized Ethnocentrism scale (GENE; Neuliep, 2002; Neuliep et al., 2001). The revised GENE scale includes 22 statements. A sample item is “Other cultures should try to be more like my culture.” Options answers ranged from 1 (“Strongly disagree”) to 7 (“Strongly agree”). Fifteen statements are utilized to estimate respondent GENE scores, while the other seven statements are distractors. Greater scores indicate higher levels of measured ethnocentrism.
Demographic information
Furthermore, information on age, gender, and nationality were obtained from the study participants.
Procedure
The questionnaire was translated into Portuguese according to multicultural guidelines (Brislin, 2000): independent/blind/back-translation, educated translation, and small-scale pretests. One of the authors firstly translated the GENE into Portuguese, and this version was then translated back into English by a translator unaffiliated with the investigation. The two translators then solved minor discrepancies that appeared thorough the back-translation process. Finally, the scale was tested by giving it to 15 undergraduate students, who did not indicate any difficulty in understanding the meaning of the items.
Data were collected by a trained researcher during regular courses. We conducted our study following the Declaration of Helsinki, and ethical norms in the country. Informed consent was acquired, and full anonymity was assured. Information was also given to the respondents that they could withdraw from the survey anytime they so desired, and that they would not suffer any consequences for doing so. Participants did not receive any compensation for their participation.
Data analyses
Descriptive statistics, principal component analysis, and internal consistencies were conducted. Ranges, frequencies, percentages, means, and standard deviations were determined to characterize the data. The factor validity of the GENE was examined using principal component analysis. Cronbach’s alpha was utilized to examine the instruments’ internal consistency. Data analyses were performed by means of IBM SPSS AMOS (version 26). Significance level was set at .05 in the present research.
Results and Discussion
The Cronbach’s alpha of the GENE measure was .74; however, its mean inter-item correlation was rather low (.16). This seems to denote that the scale is multidimensional. Therefore, the subsequent analyses were performed.
To examine the sample’s suitability for principal component analysis, Kaiser-Meyer-Olkin’s (KMO) measure was evaluated, and Bartlett’s sphericity test was calculated (Tabachnick & Fidell, 2007). Bartlett’s test was significant, χ2 (105) = 742.39, p < .001. The value of the KMO was 0.78 higher than the recommended 0.60 (Field, 2017). These findings indicate favorability and support for conducting a principal component analysis.
Two steps were followed to develop a short form of the GENE. First, the 15 items of the GENE were submitted to principal component analysis based on the same criteria used in Neuliep and McCroskey’s (1997) research, which is “a forced two factor maximum likelihood solution with oblimin rotation” (p. 391). This factor analysis yielded that the two-factor solution accounting for 35.43% of the variance. The variance explained by first and second factors were 22.68% and 12.75%, respectively. The results are presented in Table 1. We found seven items with factor loadings that exceed .55 on the respective factor, and no item presented a cross-loading greater than .30. The first factor includes three items, such as “I do not trust people who are different.” These items reflect above all an inclination to trust and cooperate with the ingroup over the outgroups. This dimension seems to outline the tendency to prefer one’s own ethnocultural group (the ingroup) over individuals of other ethnocultural groups (outgroups). It will be labeled “Ingroup Preference.” The second factor contains four items, such as “Other cultures should try to be more like my culture,” and “Most people would be happier if they lived like people in my culture.” These items reflect above all judgments about the superiority of one’s ethnocultural group over others. It will be labeled “Ingroup Superiority.”
Scale Items and Factor Loadings for the Generalized Ethnocentrism (GENE) Scale.

Second, in order to develop a short form of the GENE, another principal component analysis was conducted using the three items of the Ingroup Preference and the four items with highest factor loadings of the Ingroup Superiority (see Table 2), having considered the recommendations of Comrey (1988) of including at least three significant loadings per factors. The inter-item correlation matrix of these seven items was subjected to a principal-component analysis with varimax rotation. Two factors appeared (eigenvalue > 1) explaining 68.56% of the variance. The variance explained by first and second factors were 39.79% and 28.77%, respectively. The first factor included the three items of the Ingroup Preference, and the second factor included the four items of the Ingroup Superiority. Similar results appeared using direct oblimin rotation.
Principal Component Analysis of the SFGENE-7 (N = 170).

To evaluate the internal consistency of these two factors, Cronbach’s alpha was calculated. Cronbach’s alpha for Ingroup Preference was .84, and for Intergroup Superiority was .80. The α of the remaining scale (when the item was removed) was higher than .70 for both ethnocentrism factors. The corrected item-total correlations were between .65 and .75 for the Ingroup Preference and between .52 and .68 for the Ingroup Superiority. The mean inter-item r (homogeneity) for the Ingroup Preference item set and for the Ingroup Superiority item set were very acceptable, .64 and .50, respectively. These results support adequate internal consistency in the current sample.
Study 2
Study 2 was implemented to analyze whether the two-factor structure evidenced in Study 1 through principal component analysis is replicated by conducting a confirmatory factor analysis. We now refer to this revised version of the GENE, as the Short Form Generalized Ethnocentrism Scale (SFGENE-7). We are going to also evaluate the likelihood of a second-order factor constituting a larger psychosocial area. In addition, the psychometric properties of the evidenced factors will be assessed through internal consistency of the items and validity tests.
Method
Participants
A total of 210 college students participated in this study. The sample included 163 (79%) women and 48 (21%) men with an average age of 20 years (SD = 3.53; range: 18–34 years). All respondents self-reported their nationality as Portuguese.
Instruments
Beyond the background information (age, gender, and nationality) the survey comprised the following instrument:
Short Form Generalized Ethnocentrism Scale (SFGENE-7)
This scale was developed in Study 1. The scale includes seven items measuring two dimensions. Three items evaluate Ingroup Preference (e.g., “I do not cooperate with people who are different”), and four items measure Ingroup Superiority (e.g., “Other cultures should try to be more like my culture”; see Table 1). Answer options ranged from 1 (“Strongly disagree”) to 7 (“Strongly agree”).
Procedure
The procedure was the like that used in Study 1.
Data analyses
Descriptive statistics, confirmatory factor analysis (CFA), internal consistencies, Pearson correlations, and one sample t- test were performed. CFA was performed to confirm whether the two-dimensional structure of the SFGENE-7 evidenced in Study 1 had an adequate fit to this new sample. To following goodness-of-fit indices were calculated: χ2/df (ratio chi-square and degrees of random), GFI (goodness of fit index), CFI (comparative fit index), SRMR (standardized root mean square residual), and RMSEA (root mean square error of approximation). Models with χ2/df smaller than 5 are considered good; models with CFI and GFI values in the 0.90s or greater denote an acceptable fit; RMSEA and SRMR with values close to, respectively 0.06 or 0.08 or lower denote an acceptable fit (Byrne, 2016; Hu & Bentler, 1999). Reliability of the SFGENE-7 was evaluated using the composite reliability (CR) and the Cronbach’s alpha (α). Values of CR and α higher than .70 are indicated as adequate (Hair et al., 2010).
The AVE (average variance extracted) was calculated to assess convergent validity. AVE values equal or higher than .50 evidence convergent validity (Hair et al., 2010; Marôco, 2014). The AVE of each construct higher than the squared correlation between that construct and any other evidence discriminant validity (Hair et al., 2010; Marôco, 2014).
Results
Preliminary analysis of the items
The Flesch reading ease of the SFGENE-7 is 72.72 suggesting fairly easy to read.
Concerning the items’ distributional properties, summary measures, skewness (Sk), kurtosis (Ku), for the seven items of SFGENE-7 are shown in Table 3. The psychometric sensitivity of the items was estimated for skewness and kurtosis and was judged suitable if below 3 and 8, respectively (P. Kline, 2000). No strong deviation from normal distribution, as the items displayed values of skewness lower than 3 and kurtosis lower than 8. On the other hand, Mardia’s Multivariate Kurtosis for the seven items of SFGENE-7 was 59.94 (p < .001). According to previous research (R. B. Kline, 2005), these values show no strong deviation from normal distribution, assuring that they would not compromise CFA results.
Short Form Generalized Ethnocentrism Scale (SFGENE-7)’s Items: Descriptive Statistics.

Note. A = ingroup preference; B = ingroup superiority.
Confirmatory factor analysis
To analyze construct validity of the SFGENE-7 scale we performed a CFA with maximum likelihood estimation and mean structure analysis of the two factors (Ingroup Preference and Ingroup Superiority) dimensional model grounded on the Study 1. The two-factor structure fit the data well (χ2 = 27.52, df = 13, p = .01, CFI = 0.97, GFI = 0.98; RMSEA = 0.07, 90% CI: [0.03, 0.11]; and SRMR = 0.04; see Table 4). Standardized factor loadings (λ) of the items ranged from .64 to .96, and all were statistically significant (p < .001). Therefore, standardized factor loadings were substantial (Diamantopoulos & Siguaw, 2000), and the two-factor structure is in line with the construct validity of the SFGENE-7.
Goodness-of-fit Statistics From Confirmatory Factor Analyses.

Note. df = degree of freedom; GFI = goodness of fit index; CFI = comparative fit index; RMSEA = root mean square error of approximation; SRMR = standardized root mean square residual.
Reliability estimation
To examining the internal consistency of the SFGENE-7, the composite reliability and Cronbach’s alpha were calculated. Composite reliability value for Ingroup Preference score was .82, and for Ingroup Superiority score was .84. These values are satisfactory.
Moreover, to evaluate the internal consistency of the SFGENE-7 scores, α and item-total correlations for the item were also calculated. Cronbach’s alpha was .79 for Ingroup Preference factor, and .84 for Ingroup Superiority factor. The α of the remaining scale was higher .60 for both Ingroup Preference and Ingroup Superiority factors. The corrected item-total correlations were between .54 and .75 for the Ingroup Preference and between .62 and .73 for the Ingroup Superiority. The mean inter-item r (homogeneity) for the Ingroup Preference item set and for the Ingroup Superiority item set were very acceptable, .56 and.57, respectively. These results support adequate internal consistency in the current sample. Hence, it is possible to proceed and test convergent and discriminant validities of the SFGENE-7 scale.
Convergent validity
We performed the average variance extracted (AVE) for Ingroup Preference subscale (AVE = .50) and for Ingroup Superiority subscale (AVE = .56). These findings suggest a good convergent validity evidence for SFGENE-7.
Discriminant validity
Furthermore, the AVEs of both correlated factors are higher than or equal to the square of the correlation (r2) between these factors r2 = .24. So, these results suggest good discriminant validity evidence.
The average score of the Ingroup Preference was 1.69 (SD = 1.07) and of the Ingroup Superiority was 2.44 (SD = 1.25). These results indicate that the levels of ethnocentrism were slightly low, and below the neutral midpoint of 4.00 (p < .001). However, the Ingroup Preference score was significantly lower than the Ingroup Superiority score, Wilks λ = .69 [F(1, 204) = 68.45, p < .001, η p 2 = .25]. Age was unrelated to Ingroup Preference (r = .02, p > .05) and to Ingroup Superiority (r = .14, p > .05).
Second-order confirmatory factor analysis
As the correlation between the two factors was positive and quite high (r = .40, p < .001), which is in accordance with the notion of an overall/general factor of ethnocentrism (Neuliep, 2002; Neuliep et al., 2001), we also tested the fit of the second-order model. Therefore, an alternative model was considered, with latent factors correlated to a second-order factor. The model evidenced adequate fit with no significant deviation in fit indices from the first model: well (χ2 = 27.52, df = 13, p = .01, CFI = 0.98, GFI = 0.96; RMSEA = 0.07, 90% CI: [0.03, 0.11]; and SRMR = 0.04). These resulting fit indices suggest that a credible representation of the ethnocentrism construct (Neuliep, 2002). Figure 1 presents the second-order factor structure. Composite reliability value for overall Ethnocentrism was .80. Cronbach’s alpha was .83 for overall Ethnocentrism.

SFGENE-7’s second-order factor.
In sum, Study 2 showed that the SFGENE-7 has satisfactory psychometric features about reliability, convergent validity, and discriminant validity.
Study 3
The purpose of this study is (a) to test the factor replicability of the SFGENE-7 on another Portuguese sample and (b) to provide a further test of convergent validity by examining relationships between ethnocentrism and external variables that theoretically correlate with ethnocentrism based on the existing literature, such as tolerance, multicultural ideology, and attitudes toward immigrants. In addition, Study 3 aims to address the discriminant validity of the SFGENE-7 scale by demonstrating that ethnocentrism scores are distinct from loneliness and self-esteem, and incremental validity by establishing that the facets of ethnocentrism add predictive power over and above the attitudes toward immigrants.
The construct of tolerance has obtained several senses. In the current study we assume Berry’s (2006) conceptualization of tolerance. For this scholar tolerance involves an attitude toward social equality, containing two elements: ethnic tolerance and social egalitarianism. The acceptance of multiculturalism has been approached using diverse constructs (Berry, 2013). In this research we use a general construct of multiculturalism, that is, multicultural ideology (Berry & Kalin, 1995). Multicultural ideology concerns the “overall evaluation of the majority group addressing the degree to which they possess positive attitudes toward immigrants and cultural diversity” (Arends-Toth & Van de Vijver, 2002, p. 252). Currently Portugal is a country of emigration and immigration. In 2018, according to the Foreign and Border Service (SEF, 2019), 480,300 foreigners resided legally in Portugal, representing 4.7% of the total population. Diverse communities of immigrants now live in this country (Neto & Neto, 2017). As previous research has demonstrated that ethnocentrism was linked to lacking acceptance of cultural diversity and intolerance for outgroups (Berry & Kalin, 1995; Neto, 2009; Neuliep, 2002; Neuliep & McCroskey, 1997) it is expected that the SFGENE-7 scores will correlate negatively with tolerance, multicultural ideology, and attitudes toward immigrants.
Furthermore, to evaluate the discriminant validity, we will use two constructs: loneliness and self-esteem. There is a plethora of definitions of loneliness, but most of them highlight the perceived deficits in relationships (e.g., Ascher & Paquette, 2003; Peplau & Perlman, 1982). Self-esteem concerns the evaluative dimension of self-concept (Rosenberg, 1965). Neuliep (2002) failed to support the hypothesized connections between ethnocentrism and self-construals.
Method
Participants
A total of 179 college students took part in this study. The sample included 151 (84%) women and 28 (16%) men. The average age of the respondents was 21 years (SD = 4.93; range: 18–52). All respondents self-reported their nationality as Portuguese.
Measures
Besides the SFGENE-7 the following measures were used:
Tolerance
This scale is a 11-item self-report (Berry, 2006; Berry & Kalin, 1995; Neto & Neto, 2017) which measures ethnic tolerance (six statements; e. g. “It is good to have people from different ethnic groups living in the same country”), and social egalitarianism (five statements; e. g., “If people were treated more equally, we would have fewer problems in this country”). Response options ranged from 1 (“strongly disagree”) to 5 (“strongly agree”). Higher scores denote higher tolerance. In this sample, α was .72.
Multicultural ideology
This scale was devised in the Canadian context to measure support of a culturally diverse society (Berry & Kalin, 1995; Neto & Neto, 2017). The scale includes 10 items, with 5 in a negative direction (therefore it is a balanced scale). Example items are: “Ethnic minorities should be helped to preserve their cultural heritage in Portugal” and “People who come to live in Portugal should change their behavior to be more like the Portuguese.” Response options ranged from 1 (“strongly disagree”) to 5 (“strongly agree”). Greater scores denote greater multicultural ideology. In this sample, α was .76.
Attitudes toward immigrants
We used the “feeling thermometer,” in which respondents indicate how favorably their attitude is toward immigrants arriving from several nations. Response answers ranged from 1 (“extremely unfavorable”) to 100 (“extremely favorable”; Neto, 2009; Neto & Neto, 2017). Participants rated six groups: the Brazilians, the most numerous immigrant group in the country, and the five immigrant groups from Palop (African countries with Portuguese as official language) including, Angolans, Cape Verdeans, Guineans, Mozambicans, and Santomeans.
Loneliness
Loneliness was assessed by the brief Portuguese version (Neto, 1992, 2014) of the Revised UCLA Loneliness Scale (Russell et al., 1980). This scale includes six items (ULS-6; e.g., “People are around me but not with me”). Response options ranged from 1 (“never”) to 4 (“often”), with higher scores indicating greater loneliness. In this sample, α was .83.
Self-esteem
Self-esteem was assessed with a single item (“I am someone who generally has high self-esteem”; Neto & Fonseca, 2018; Robins et al., 2001). The response options ranged from 1 (“not at all”) to 5 (“very much”), with higher scores indicating greater self-esteem. The measure is considered valid (Robins et al., 2001).
Procedure
The procedure was like that used in Study 1.
Data analyses
CFA, descriptive statistics, internal reliabilities, t-tests, Pearson’s correlations, and hierarchical regressions analyses were performed on the data.
Results and Discussion
Mardia’s Multivariate Kurtosis for the seven items of SFGENE-7 was 25.03 (p < .001). These values show no strong deviation from normal distribution, assuring that they would not compromise CFA results.
Confirmatory factor analysis
The two-factor structure fit the data well (χ2 = 26.78, df = 13, p = .01, CFI = 0.97, GFI = 0.96; RMSEA = 0.07, 90% CI: [0.03, 0.12]; and SRMR = 0.05). Standardized factor loadings (λ) of the items ranged from .61 to .81, and all were statistically significant (p < .01). Therefore, the two-factor structure also supports the construct validity of the SFGENE-7 in this sample.
Reliability and descriptive statistics
Composite reliability value for Ingroup Preference score was .82, for Ingroup Superiority score was .80, and for Ethnocentrism was .76. These values are satisfactory. Cronbach’s alpha was .82 for Ingroup Preference factor and .79 for Ingroup Superiority factor, and .73 for Ethnocentrism. The α of the remaining scale was higher than .70 for both ethnocentrism factors. The corrected item-total correlations ranged between .63 and .70 for the Ingroup Preference and between .51 and .67 for the Ingroup Superiority. The mean inter-item r (homogeneity) for the Ingroup Preference item set and for the Ingroup Superiority item set were very acceptable, .60 and .49, respectively. Therefore, these results afford also good internal consistency.
The average score of the Ingroup Preference was 1.46 (SD = 0.64) and of the Ingroup Superiority was 2.54 (SD = 0.99). These results indicate that the levels of ethnocentrism were slightly low, and below the neutral midpoint of 4.00 (p < .001). Age was unrelated to Ingroup Preference (r = .04, p > .05) and to Ingroup Superiority (r = .02, p > .05).
In sum, the SFGENE-7 scores revealed also adequate psychometric characteristics in this sample. Next, the relationships between SFGENE-7 scores, and external measures will be examined.
Convergent, discriminant, and incremental validity
We performed the average variance extracted (AVE) for Ingroup Preference subscale (AVE = .61) and for Ingroup Superiority subscale (AVE = .51). These findings suggest a good convergent validity evidence for SFGENE-7.
Furthermore, bivariate correlational analysis between the SFGENE-7 and all study scales was performed (Table 5). Using Cohen (1988) general guidelines for deciding the magnitude of the correlations, we found moderate negative correlations between ingroup preference, and tolerance (r = −.39, p < .001), multicultural ideology (r = −.38, p < .001), attitudes toward Cape Verdeans (r = −.30, p < .001) and Mozambicans (r = −.32, p < .001); this factor of ethnocentrism revealed small negative correlations with attitudes toward Angolans (r = −.28, p < .001), Brazilians (r = −.24, p < .01), Guineans (r = −.27, p < .001), and Santomeans (r = −.25, p < .001). Therefore, the results confirm the convergent validity of the ingroup preference.
Correlations Between Faces of Ethnocentrism and Criterion Variables.

p < .01. **p < .001.
On the other hand, regarding the other dimension of ethnocentrism, ingroup superiority, a moderate negative correlation was found with multicultural ideology (r = −.35, p < .001), and a small correlation with tolerance (r = −.26, p < .001). These results confirm the convergent validity of the ingroup superiority. However, no significant correlation was found between this dimension and any of the attitudes toward the immigrants. It is worth noting that both ethnocentrism scores did not correlate significantly with loneliness and self-esteem, providing some evidence of the scale’s discriminant validity.
To test the incremental validity of the ethnocentrism facets we considered the increased predictive power of the facets over and above the attitudes toward immigrants (out-groups). In this line, hierarchical multiple regressions were performed utilizing attitudes toward immigrants in the first step, and ingroup preference and ingroup superiority in the second step. The same process was replicated to predict tolerance and multicultural ideology. In both models, the facets of ethnocentrism increased unique, predictive value over and above the attitudes toward immigrants. For tolerance ethnocentrism facets increased 14% of explained variance; and for multicultural ideology, increased 17% of variance (Table 6).
Incremental Validity of Ethnocentrism With Tolerance and Multicultural Ideology as Criterion Variables.
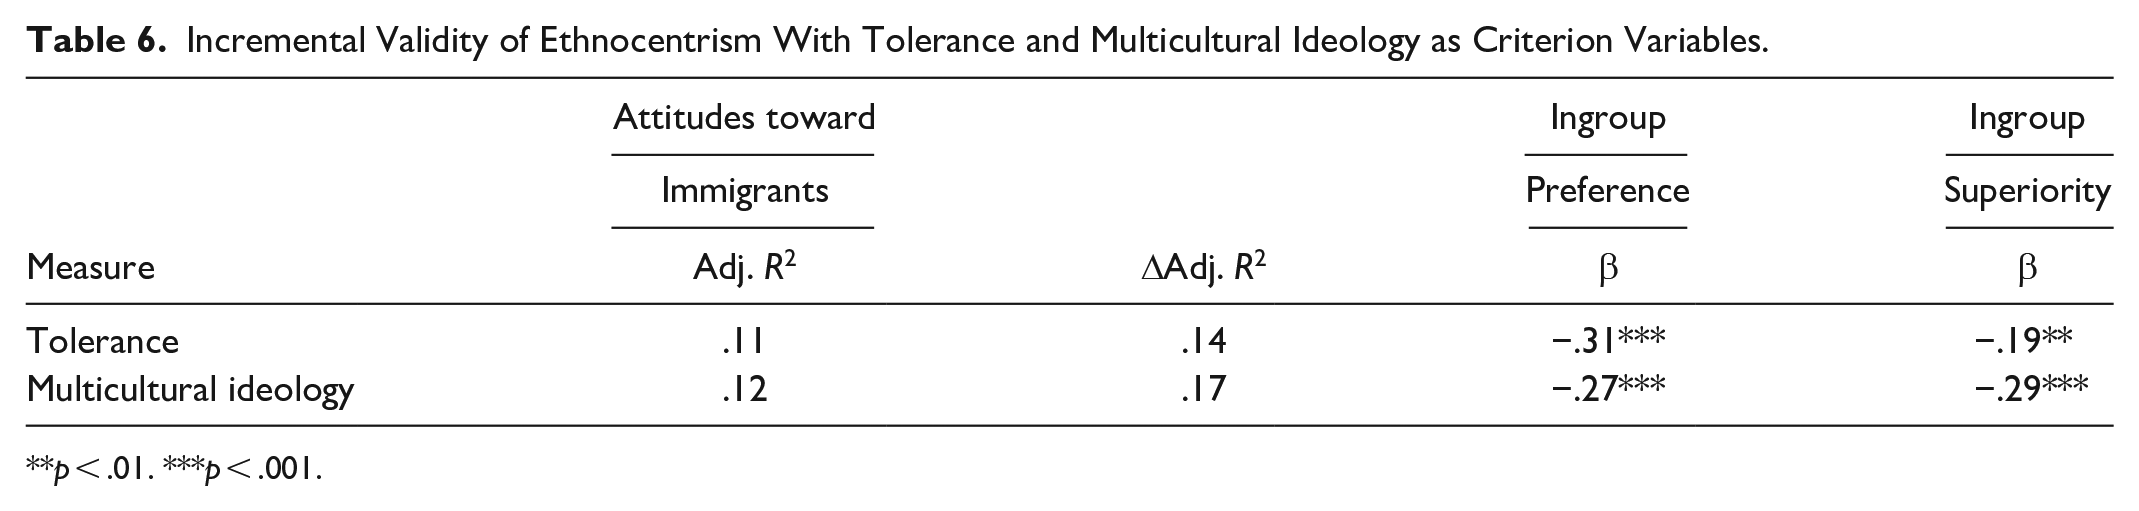
p < .01. ***p < .001.
Finally, the next step was to examine the reliability of the SFGENE-7 across time.
Study 4
The results from the Study 2 and 3 showed that the SFGENE-7 had a multidimensional factor structure using CFA, as well as an adequate internal consistency. In contrast, the temporal stability of the scale has not yet been assessed. This assessment seems important as SFGENE-7 concerns a global and subjective evaluation of ethnocentrism irrespective of cultural background.
This evaluation should not float (or very little) across time and/or specific events that people can find in daily life. Study 4 was conducted to assess the temporal stability (test-retest) of SFGENE-7, using the intraclass correlation coefficient (ICC). According to Koo and Li (2016) values less than .5 are indicative of poor reliability, values between .5 and .75 indicate moderate reliability, values between .75 and .90 indicate good reliability, and values greater than .90 indicate excellent reliability. We expect to find good test-retest reliability.
Method
The SFGENE-7 has been administered in the same conditions as those used in our previous studies to college students (56 females and 14 males). Their average age was 22 years (SD = 3.52; range: 19–34). Respondents answered to the SFGENE-7 two times with an interval of 3 months between the two administrations.
Results and Discussion
The intraclass correlation coefficient was .78 (p < .001) for the Ingroup Preference dimension, .87 for the Ingroup Superiority dimension (p < .001), and .86 for total Ethnocentrism (p < .001). These results suggest some stability in the SFGENE-7 over time, despite changes in people’s ethnocentrism which would be like to happen in a 3-month period. According to Koo and Li (2016) these values indicate a temporal stability relatively good supporting the hypothesis of the stability of ethnocentrism. We have also calculated the internal consistency (alpha of Cronbach) for pre-test and post-test of the measure. Good alpha reliabilities were found for both the pre-test (α = .76) and post-test (α = .78) for the Intergroup Preference, for both the pre-test (α = .72) and post-test (α = .87) for the Intergroup Superiority, and for both the pre-test (α = .77) and post-test (α = .86) for the Ethnocentrism. To sum up, the results of this study in connection with the findings from the three previous studies demonstrated that the SFGENE-7 had adequate reliability.
General Discussion
The purpose of the set of studies presented in this paper was to develop and validate a short form of the Generalized Ethnocentrism (GENE) measure. The results of these studies pointed out that a short version of the Generalized Ethnocentrism (GENE) measure, named the SFGENE-7, presented levels of validity and reliability very adequate.
As we have said earlier, the Generalized Ethnocentrism (GENE) scale has been used as a unidimensional measure in previous research. Current findings are not consonant with past research as they do not assume the unidimensionality of the GENE measure. In contrast to previous research, the SFGENE-7 evidenced two factors through principal component analysis and CFA, the Ingroup Preference, and the Ingroup Superiority. So, the SFGENE-7 seems to operationalize ethnocentrism as involving beliefs that ingroup is more relevant than outgroups and contains two expressions of ingroup preference and superiority. The SFGENE-7 assesses preference and superiority for one’s own cultural group (the ingroup) over members of other cultural groups (outgroups). These two dimensions reflect a preference of one’s own ethnocultural group, tinged with feelings of cultural superiority. These two facets meet the conceptualization of Neuliep (2002, p. 2002), as ethnocentric people “perceive their ingroups (cultural, racial, ethnic, etc) as better than outgroups.”
The Ingroup Preference subscale encompasses beliefs showing the tendency to prefer one’s ethnocultural group over other ethnocultural groups. Several scholars argued that ethnocentrism includes the tendency to prefer one’s ethnocultural group over others (e.g., Herskovits, 1948; Taylor & Jaggi, 1974). For example, Berry and Kalin (1995, p. 393) considered ethnocentrism as a “relative preference for one’s ingroup over most outgroups.”
The Ingroup Superiority subscale encompasses beliefs showing a tendency to consider one’s ethnocultural group superior to other ethnocultural groups. Several scholars also argued that ethnocentrism includes beliefs that one’s ethnocultural group is superior to outgroups (e. g., Adorno et al., 1950; LeVine & Campbell, 1972; Sumner, 1906). According to Bizumic et al. (2009, p. 873) “ethnocentrism has been most widely defined as the belief that one’s own ethnic group is better than or superior to others.” Brewer and Campbell (1976, p. 64) considered that “self-regard or hyperevaluation of the ingroup” constitutes one component of ethnocentrism.
As the correlation between the factors was moderately high, the test of the fit of the second-order model was performed. Therefore, it was also examined if it makes sense from an empirical point of view to generate a total score. The model showed a satisfactory fit, suggesting that the full-scale score with seven items makes sense.
We assessed the reliability of the SFGENE-7 through internal consistency and test-retest procedures. As expected, it has been demonstrated that the SFGENE-7 has good internal consistency. However, the level of internal consistency was not too much high that there does not seem to be redundancy in the contribution of each statement to the whole instrument. Furthermore, the scale revealed good temporal stability over 3 months.
Study 2 supported convergent and discriminant validities of the SFGENE-7. Study 3 also supported the convergent, discriminant, and incremental validities of the measure by means of its relations with external variables. In particular, the higher an individual scored on tolerance and multicultural ideology, the lower the individual scored on both facets of ethnocentrism. However, the attitudes toward immigrants were significantly correlated only with the ingroup preference dimension, suggesting that this dimension is more concerned with negative attitudes toward outgroups than the ingroup superiority dimension.
Loneliness and self-esteem were used to test the discriminant validity of the SFGENE-7. The SFGENE-7 scores were not correlated with loneliness and self-esteem. These correlations suggest that ethnocentrism is conceptually distinct from loneliness and self-esteem and therefore supported the discriminant validity of the SFGENE-7. Finally, the incremental validity of the SFGENE-7 was also demonstrated, as the two facets of ethnocentrism predicted tolerance and multicultural ideology over and above the attitudes toward immigrants.
These results should be interpreted considering the research limitations. First, participants were young adult college students; the extent to which these findings may be generalized to other populations is unknown. Replication research with other populations should be implemented to enlarge the generalization. Secondly, we assessed ethnocentrism using a self-report measure. Ethnocentrism is considered a sensitive topic for many and measuring ethnocentrism by means of a self-report instrument can be involved in social desirability (Paulhus, 1991). Next investigation should incorporate a measure of social desirability (see He et al., 2014).
Despite these limitations, the SFGENE-7 is a straightforward and brief scale that is very ease to administer. This research has afforded new empirical insights concerning the satisfactory psychometric properties of this scale: it presented a multidimensional structure, with adequate reliability, and validity. Furthermore, the results provided additional evidence for a general ethnocentrism factor. These findings should stimulate its inclusion within research contexts examining predictors and outcomes of ethnocentrism, and its implementation within programs to minimize ethnocentrism in the society.
Footnotes
Declaration of Conflicting Interests
The author(s) declared no potential conflicts of interest with respect to the research, authorship, and/or publication of this article.
Funding
The author(s) disclosed received of the following financial support for the research, authorship, and/or publication of this article: This research was partially supported by the Center for Psychology at the University of Porto, Portuguese Science Foundation (FCT UIDB/00050/2020).