
Abstract
As an important driving force for economic growth, digital trade provides opportunities for urban green development. Using city-level data in China from 2005 to 2020, we take the cross-border e-commerce comprehensive pilot zone (CBEC) as a policy shock to construct a spatial difference-in-difference (SDID) model, which is adapted to quantitatively examine the carbon reduction effects and impact mechanisms of CBEC policy. The results confirm that the implementation of CBEC policy significantly reduces the carbon emissions (CE) of pilot cities about 4.5%, mainly due to resource allocation efficiency promotion, industrial structure upgrading, and green technology boosting. Meanwhile, there is a significant spatial spillover effect, resulting in a 3.9% CE decrease in the neighboring cities. In addition, the CBEC policy has a more significant CE reduction effect in resource-based and high-degree information cities. Our results provide evidence for the economic effect of digital trade and accelerate green development in cities.
Keywords
Introduction
Climate change induced by carbon dioxide has attracted wide attention worldwide in recent years (Fragkos et al., 2017; D. Gao et al., 2023). The 2030 Agenda for Sustainable Development explicitly lists “climate action” as one of the Sustainable Development Goals (SDGs), and China has also raised environmental governance to an unprecedented level of importance. The report of the 19th and 20th National Congress emphasized that the government should deepen the battle against pollution control and environmental governance, jointly promoting pollution emission reduction and social development to green transformation (H. Wang et al., 2023; Y. Wang et al., 2023; Zhao et al., 2022). Researchers have also studied the factors influencing environmental pollution in terms of economic and social systems such as environmental regulation (Li, Gao, & Li, 2023; Li, Gao, & Shi, 2023; Miao et al., 2019), industrial concentration (F. Chen et al., 2022), technical progress (Acemoglu et al., 2012) and urbanization (Han et al., 2019; Li, Gao, & Li, 2023; Li, Gao, & Shi, 2023). Among them, trade, as a significant manifestation of economic globalization, has attracted particular attention for its environmental impact.
However, there is still no consensus on the relationship between trade and the environment. Some scholars consider that trade increases local pollution, causing pollution heaven (Duan et al., 2021; Grether et al., 2012). Due to differences in environmental regulations across countries, the improvement of trade openness could encourage the relocation of high-polluting industries to countries with relatively looser environmental controls, thus exacerbating local pollution. Some scholars refute that argument and they believe the technology spillover effect can offset the scale effect brought by trade industrial transfer, which would assist in lowering pollution emissions and increase the effectiveness of local resources use (S. Chen et al., 2020; T. Ma & Wang, 2021; Tian et al., 2022).
With the development of digital technology, digital trade has developed rapidly as a new form of trade. According to the Global Digital Trade Development Report 2024, the proportion of digital trade in global trade has risen to 22.5% in 2023. Compared with traditional trade, digital trade can effectively break the restriction of geographical distance and have a profound impact on the form of international trade (Freund & Weinhold, 2004; Hamill, 1997; Kim et al., 2017). For example, S. Ma and Fang (2021) decomposed the trade structure and found that cross-border e-commerce promoted China’s export growth along expansion margin and intensive margin, revealing the facilitating role of the Internet on export trade. In addition, S. Ma and Hu (2022) found that cross-border e-commerce could significantly reduce the risk of an enterprise’s export market portfolio by expanding export market segments.
In practice, enterprises involved in cross-border e-commerce can significantly reduce CE through green logistics practices, such as using new energy transport vehicles, optimizing logistics networks, and reducing the use of packaging materials. For example, Alibaba has reduced CE in logistics through its Cainiao network. These practices contribute to improving resilience and adaptation to climate-related disasters, in line with the targets of SDG 13.1 (D. A. Gao et al., 2024; D. Gao et al., 2024). However, less of the existing literature focuses directly on the environmental impacts of digital trade. The relevant literature to this paper only analyzes the impact of digital technology on CE. For example, H. Wang et al. (2023) and Y. Wang et al. (2023) found that digital technology effectively reduced CE based on city-level data in China. Li et al. (2024) studied the environmental impact of CBEC policy, but the spatial spillover effect was not considered in the empirical study.
Based on the above analysis, this paper will mainly focus on the following questions: Can digital trade reduce CE, and does this effect extend spatially? What are the mechanisms of the effect? Whether this impact varies across cities? Therefore, we use the implementation of the CBEC policy as a quasi-natural experiment to comprehensively explore the aforementioned issues and delineate the causal relationship. Specifically, we utilize the SDID model for empirical analysis. The findings demonstrate that the CBEC policy effectively reduces urban CE and additionally lower CE in the surrounding cities. Furthermore, the reducing effect is mostly exerted by enhancing resource allocation efficiency, upgrading industrial structure, and boosting green innovation.
The marginal contributions of this paper lie in the following: First, by studying the effects of digital trade on CE reduction, this study explores the social influence of digital trade from the perspective of environmental performance for the first time and supplements the existing literature. Second, using the SDID method, we investigate the effects of the CBEC policy on carbon reduction and its’ spatial spillover effect, providing direct empirical evidence to understand the institutional innovation effects. Third, we further explore the potential mechanisms of digital trade on urban CE reduction from multiple dimensions (i.e., green technology effect, industrial upgrading effect, resource allocation effect), which helps to deeply understand how CBEC policy affects urban low-carbon development, and further unleash policy implications.
The remainder of this study is organized as follows. The policy background and theoretical analysis are presented in Section 2. The research design is introduced in Section 3. The basic empirical results are discussed in Section 4. The impact mechanism is investigated in Section 5. The conclusion and policy suggestions are in Section 6.
Policy Background and Theoretical Hypothesis
Institutional Background
Digital trade has emerged as a new important form of global trade, as a result of the construction of communication infrastructure and the quick advancement of digital technology. In March 2015, the State Council authorized the setting up of China’s Cross-Border E-Commerce Comprehensive Pilot Zone in Hangzhou City. The Provincial People’s Government proposed and The State Council approved the “national pilot zone” known as the CBEC pilot city. It was founded to take the lead in the technical requirements, business procedures, surveillance frameworks, information architecture of payment methods, logistics, customs clearance, tax refund, and other procedures, to advance the facilitation of trade and implement supply-side reforms in the realm of foreign trade.
With the in-depth development of the CBEC policy, Hangzhou, as the first pilot city, actively explored and launched the “six systems and two platforms” development model, specifically referring to the “six systems” such as information sharing, e-commerce integrity, financial services, statistical and monitoring, intelligent logistics, and risk prevention and management, as well as the “two platforms” of cross-border e-commerce online integrated services and offline industrial parks. At the same time, it has accumulated successful experience of “no ticket exemption” and “approved collection” which can be replicated and promoted. After absorbing existing experience, China has further expanded the scope of pilot cities. Up to now, a total of 165 cities have been approved as pilot cities in six batches, covering 31 provincial administrative regions, fostering a pattern of interconnected development on land and at sea, and mutual development between the east and the west across the country. Specifically, considering the approval time of pilot cities and the limited access to data, only the pilot cities of the first four batches were taken as the treatment group (as shown in Figure 1). Expanding the scope of pilot cities will not only help the Chinese government deepen a series of reforms such as streamlining administration and delegating power, optimizing services, but also has a very important meaning to cultivate new competitive advantages in trade competition, and accelerate to turn China into a trader of quality.

Distribution of the CBEC pilot cities.
Theoretical Analysis and Research Hypothesis
The development of the green economy has been aided by digital trade, which is a result of the new generation of telecommunications and information technologies’ deep integration with the world’s industrial and value chains. New trade patterns have emerged as a result of this transformation, driving the digitalization of conventional trade. On the one hand, digital trade promotes information sharing through data flow, reduces intermediary traders, improves resource allocation efficiency, and lowers energy use as well as carbon dioxide emissions. On the other hand, by upgrading the local industrial structure and fostering green innovation technology, digital trade improves the efficiency of resource and energy use, promotes the development of low-carbon economies in cities, and contributes to achieving the infrastructure goals of the 2030 Agenda for Sustainable Development (Tan et al., 2024). A more intuitive and detailed demonstration of the research framework is shown in Figure 2.

Research framework.
The CBEC policy to encourage the growth of digital trade not only influences the CE of pilot cities, but also has the potential to affect surrounding cities. There are two main reasons. Firstly, in the background of the promotion of high-quality development in China, pilot cities guide urban green development through industrial structure adjustment, optimization of resource allocation efficiency, and improvement of infrastructure conditions. Neighboring cities have the incentive to learn from the replicable and extendable development experience summarized by pilot cities (Z. Li & Wang, 2022). Secondly, green technology innovations of pilot cities may affect the application of neighboring cities through technology spillover, strengthen the spatial-temporal connection between cities, and then reduce CE in adjacent cities (Shang et al., 2022). Therefore, we propose:
The impact mechanisms are analyzed as follows. Firstly, the growth of digital trade reduces urban CE by lowering transaction costs and increasing the effectiveness of resource allocation. On the one hand, digital trade reduces communication and exchange costs between the industrial chain and supply chain by geographic distance due to the advantages of online ordering and internet delivery (Akerman et al., 2022; D. A. Gao et al., 2024; D. Gao et al., 2024; Goldfarb & Tucker, 2019; Lendle et al., 2016). By increasing transaction matching efficiency, it will encourage the efficient use of resources and a decrease in energy consumption, leading to a decrease in city greenhouse gases (Y. Liu et al., 2023; B. Wang et al., 2021). On the other hand, through institutional innovation, the local government offers one-stop services such as customs clearance and tax refunds for trade enterprises (S. Ma & Guo, 2022), effectively reducing the transaction costs and tax burden, which will facilitate resource allocation efficiency and reduces urban CE (B. Wang et al., 2021). Therefore, we propose:
Second, by contributing to the optimization and adjustment of the industrial structure, digital trade lowers urban CE. Digital trade, a significant component of the contemporary service economy, uses a smaller amount of energy and emits fewer pollutants than capital-intensive and resource-intensive businesses (Saridakis et al., 2018). According to X. Zhou et al. (2013), D. Gao et al. (2023), H. Wang et al. (2023), and Y. Wang et al. (2023), the CBEC policy will effectively reduce CE by promoting the spatial agglomeration of cross-border e-commerce companies and expanding their proportion in the national economy, while encouraging the shifting of the economy structure to tertiary-oriented industry. In addition, by promoting information technology sharing among industries, digital trade can help hasten the integration of the manufacturing and service sectors, and improve the operational efficiency of traditional industries (Mashalah et al., 2022; M. Zhou et al., 2023). Considering that industrial structure will dictate the production allocation of usage of energy and pollution-related to some extent (Xiong et al., 2019), the development of the CBEC pilot zone for digital trade will propel the transformation of the regional industrial structure, reduce reliance on energy resources, and reduce urban CE. Therefore, we propose:
Last but not least, the growth of digital trade encourages the development of green technology, acting as a crucial accelerator for the reduction of urban CE (J. Bai et al., 2023; Meng et al., 2022; Su et al., 2023). Digital trade has given rise to an abundance of new trade modes attributable to digital technology and services, providing the possibility to meet the diversified and personalized services of consumers (Tolstoy et al., 2021). In turn, it has also triggered the transformation of production mode and industrial organization mode, providing opportunities for enterprises and industries to carry out technology innovation (Luo et al., 2023; Wen et al., 2023). Moreover, by using Internet technology, enterprises are expected to find more high-quality and low-cost intermediate or capital products worldwide. Through the imitation and absorption of intermediate products, enterprises will carry out product upgrading and technological innovation (Lu & Ng, 2012; Q. Liu et al., 2021). With the improvement of technology level, urban CE will be inhibited (X. Liu & Zhang, 2021). Therefore, we propose:
Research Design
In this study, we first examine the spatial relationship of CE between cities by using Moran’s I index and subsequently take the implementation of CBEC policy as a quasi-natural experiment to construct a SDID model, which quantitatively analyzes the influence of digital trade on urban CE reduction and their spatial spillover effects.
Moran’s I Index of Carbon Emissions
Given the potential correlation in the spatial distribution of urban CE, Moran’s I index is chosen to test for spatial autocorrelation. The index determines whether the data are spatially clustered by analyzing the degree of correlation between observations. In the process of data processing, the comparability of different observations is improved through the standardization of the data. Following Zeng et al. (2023), this paper measures the average correlation degree of CE between a city and the surrounding cities in the whole region. Moran’s I index can be described in more detail as follows:

where
The SDID Model
To examine how digital trade affects CE, we deploy the CBEC policy as a quasi-experiment. The traditional DID model’s premise of the stability of individual treatment effects is broken as a result of the geographical correlation and aggregation of CE (Rubin, 1974). Therefore, according to Jia et al. (2021), we incorporate a spatial lag term in the conventional DID model and build a multiple SDID model, which is to evaluate the influence of CBEC policy on urban CE reduction and its spatial spillover effects. Considering that spatial correlation in econometric models can be caused by dependent, independent variables or error terms, the spatial Durbin model can not only represent the spatial correlation, but can also be transformed into the spatial lag model or spatial error model under different parameter settings, which is widely used. Therefore, the spatial Durbin model is also adopted in this paper as follows:
Where
Mediating Effect Model
Based on theoretical analysis, digital trade can facilitate urban CE reduction through three mechanisms: improving resource allocation efficiency, upgrading the structure of the industry, and promoting green technology innovation. Therefore, to verify the above hypothesis, we draw on the three-step approach put forward by Baron and Kenny (1986) to construct the following mediation effect model:


Where
Variables Descriptions
Explained Variable
This research selects gasoline, liquefied petroleum gas, as well as electrical consumption as sources of urban carbon emissions, alongside coal energy production serving as China’s primary source of electricity, following Li, Gao, and Li (2023) and Li, Gao, and Shi (2023). Equation 5 is the concrete calculating formula.

Where
Core Explanatory Variable
Control Variable
Referring to Li, Gao, and Li (2023), Li, Gao, and Shi (2023), and X. Liu et al. (2022), we add the following city-level control variables: (1) Economic development level (ED), measured by per capita GDP. (2) Financial self-sufficiency rate (FS), which is calculated by dividing public fiscal revenue by public fiscal expenditure; (3) Urban infrastructure (IN), as measured by highway miles per capita; (4) Urbanization level (UR), expressed as the logarithm of population density. (5) Regional financial level (FD), calculated as the ratio of urban bank’s loans and deposits to the region’s GDP. All of the aforementioned variables are taken from the logarithm.
Mediating Variable
Based on the practice of B. Wang and Liu (2015), GTFP is measured by urban green total factor productivity. The output measurement computes the non-expected output indicators of environmental pollution for estimation, in addition to the expected output indicators of economic development and green ecology. The input indicators account for labor, capital, and energy consumption. According to Gan et al. (2011), the proportion of the secondary sector’s value-added to the tertiary sector defines SU. According to Cao et al. (2021), we use the number of green patents obtained per 10,000 people in a city as a proxy variable for GT.
Data Resource
After eliminating the data of cities with missing main variables, 253 prefecture-level Chinese cities from the years 2005 to 2020 are chosen for empirical analysis. The CBEC pilot cities are announced by The State Council. The China Electricity Statistical Yearbook and the China Electricity Yearbook are used to calculate the percentage of coal and electricity usage. Urban infrastructure is taken from the EPS platform’s China Urban and Rural Construction database. Additionally, the data for the remaining variables is mainly from the China Urban Statistical Yearbook and other relevant urban statistical yearbooks. Table 1 displays the statistical description of the main variables. It is evident that the dataset contains a total number of 4,048 city-year observations, and there are large differences in urban characteristics.
Descriptive Statistics.

Empirical Results
Spatial Relationship Analysis and Parallel Trend Test
Moran’s I Index of Urban Carbon Emissions
The analysis results of the global Moran’s I index are shown in Figure 3, in which the year is represented on the horizontal axis, while I value is on the vertical axis. It can be seen that the values are all above 0, more specifically, at the 1% level of significance, they are greater than 0.2, indicating that urban CE is significantly positively spatial correlated with space. Furthermore, the values of global Moran’s I index show a gradual upward trend over time, increasing from 0.229 in 2005 to 0.301 in 2020, which means the relationship between cities is gradually growing. Therefore, the use of spatial econometric model is reasonable.

The Moran’s I index from 2005 to 2020.
Parallel Trend Test
Additionally, we check the SDID model’s validity by comparing the CE of pilot cities and control groups before the adoption of the CBEC policy. This article verifies the parallel trend assumption using the model that was developed by Y. Bai and Jia (2016) and Lin (2017).

Where
The estimated results are shown in Figure 4. The vertical dimension represents the direct influence and the 95% confidence range of

Results of the parallel trend test.
Benchmark Regression Analysis
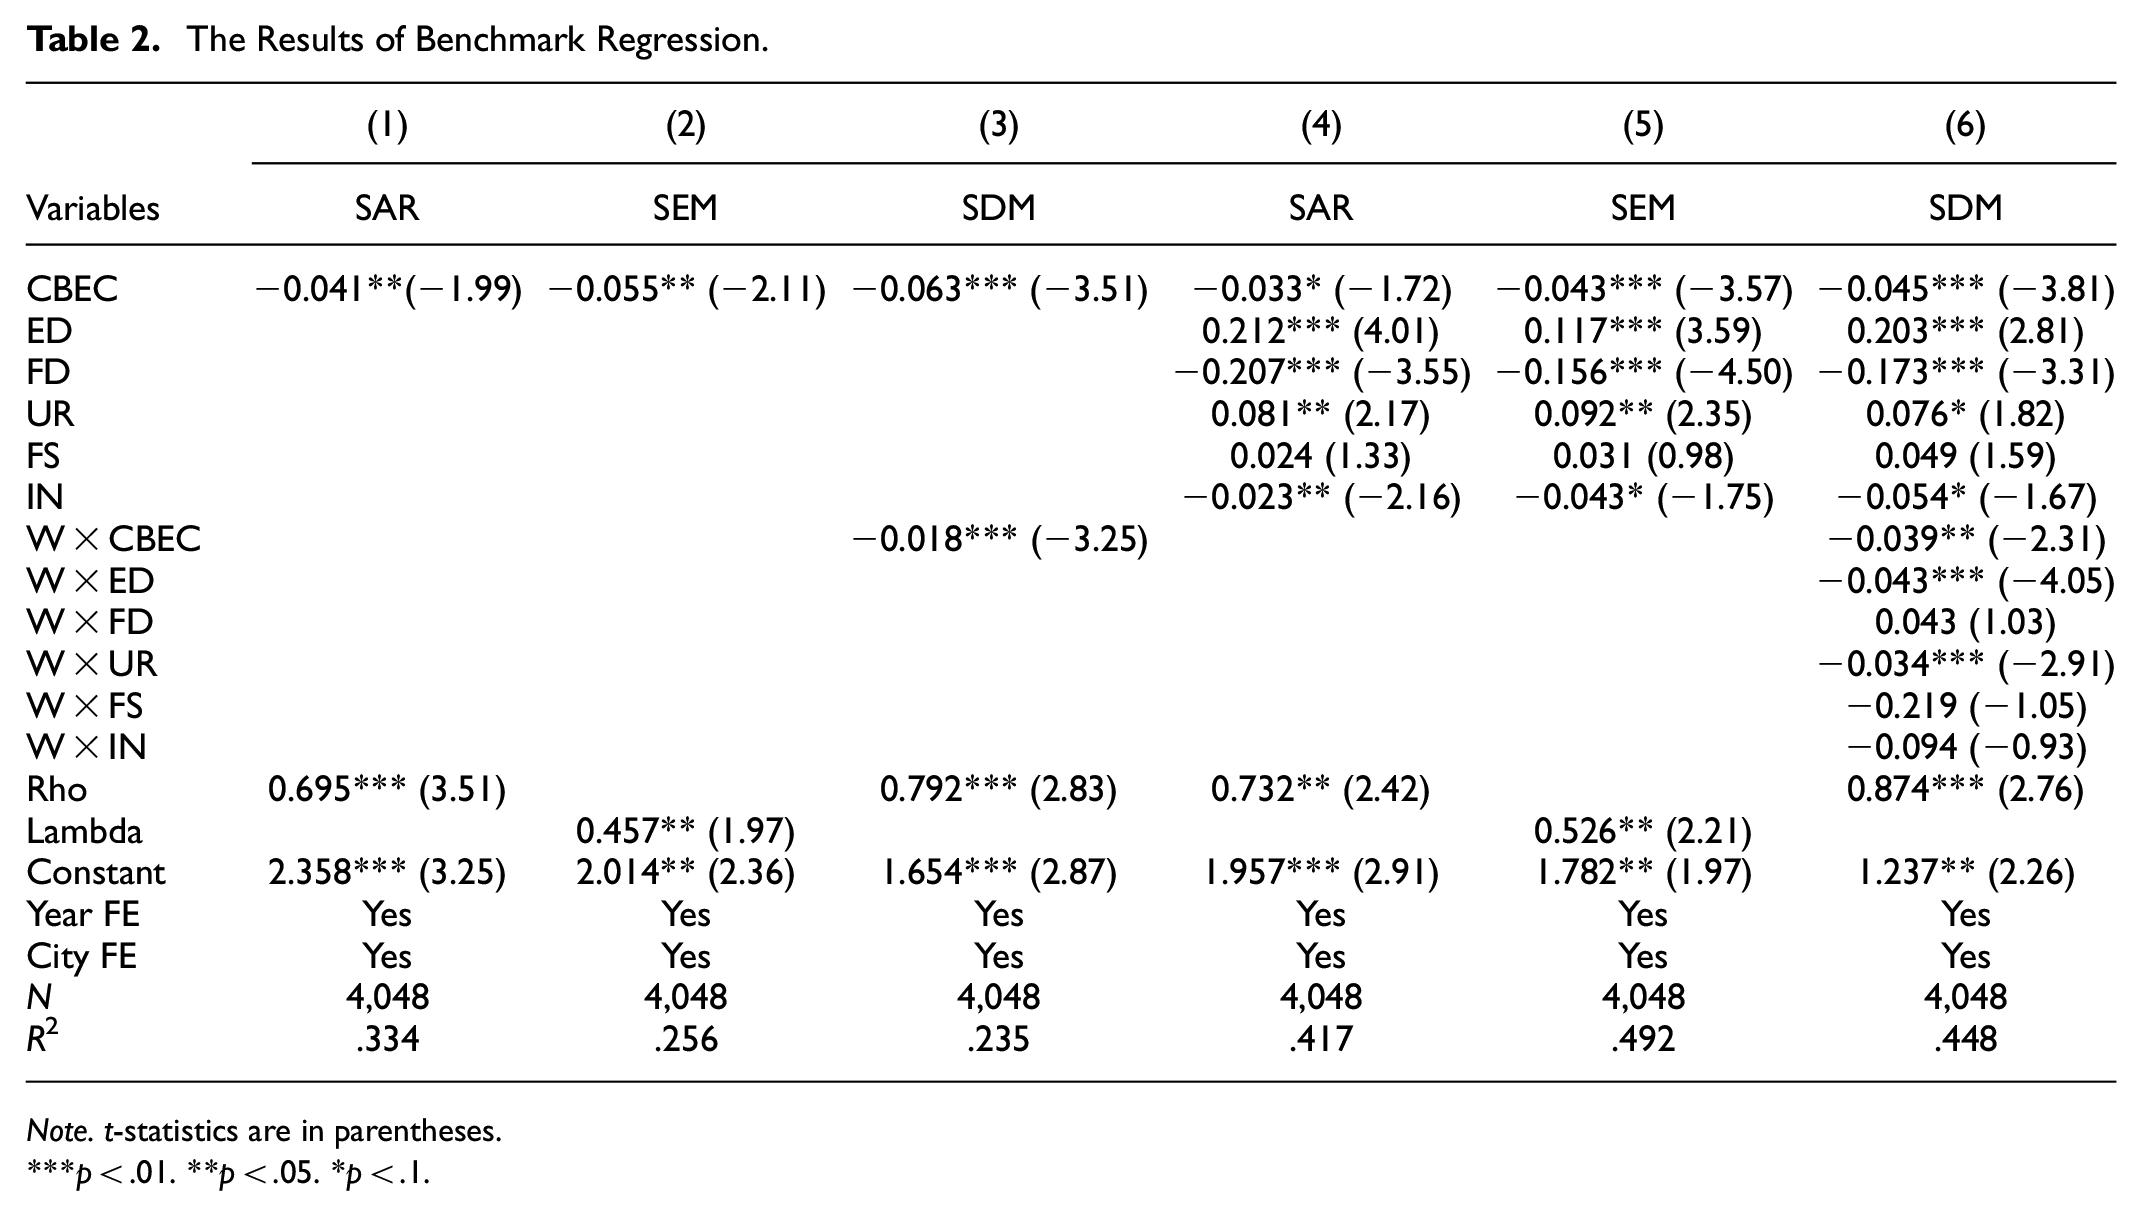
The spatial autoregressive model (SAR), the spatial error method (SEM), and the spatial Durbin model (SDM) are the three most widely utilized SDID approaches. To figure out whether the SDM design may be switched to the SAR or SEM model, we utilize three models in the benchmark regression. The estimated results calculated by Equation 2 are illustrated in Table 2, where columns (1) to (3) demonstrate the model without taking into account control variables and columns (4) to (6) within control variables. Fixed effects of time and region are controlled in all regressions.
The Results of Benchmark Regression.
Note. t-statistics are in parentheses.
p < .01. **p < .05. *p < .1.
Specifically, columns (1) and (4) are estimated by the SAR model, and the presence of spatial autoregression is demonstrated by the parameter rho being statistically significant at a 1% level. Columns (2) and (5) are estimated by the SEM model. The parameter lambda is significant at a 5% level, signifying the spatial error term exists. The estimation results of the SDM are shown in Columns (3) and (6). At a 1% level of significance, the parameter rho is considerable, which means that spatial autocorrelation of explained variables and spatial correlation of spatial error terms are indeed needed at the same time. The SDM model is the most suitable one for our investigation. As a result, we focus primarily on column (6) in Table 2. The results show that the parameter of
In addition, the coefficient of ED in the control variables is positive at a 1% significance level, indicating that economic development brings about an increase in urban CE, which lines up existing literature (Dong et al., 2020). The coefficient of FD is negative at a 1% significance level, indicating that the higher the regional financial level, the smaller the CE. The primary factor might be the higher the urban financial level, the smaller the financial constraints for enterprises and other market entities to invest in low-carbon technology research, and the lower the urban CE. The coefficient calculated by UR appears strongly positive, indicating that urban CE increases with increasing urban population density. The coefficient of FS is positive, but not significant. The coefficient of IN is significantly negative at a 10% level, which means that urban transport infrastructure conditions accelerate urban CE reduction.
Robustness Tests
The baseline results demonstrate that CBEC policy can significantly reduce urban CE and have a spatial spillover effect. Moreover, we perform some robustness tests, such as the propensity score matching method, replacing different spatial weight matrices, constructing instrumental variables, placebo test, and excluding other policies to reconfirm the validation of the conclusions.
PSM-SDID
Table 3 reports the estimated results obtained by using SAR, SEM, and SDM models based on propensity score matching samples. It can be seen that rho and lambda are at least statistically significant at a 5% level, signifying that the spatial correlation of explained variables and error terms still needs to be considered. As can be seen in column (3), the coefficient of variation of
The Results of PSM-SDID Regression.

Note. t-statistics are in parentheses.
p < .01. **p < .05.
Replacing Space Weight Matrix
Under different spatial weight matrices, SDID models may face different estimation results. We further introduce three additional spatial weighting matrices to examine how CBEC policy affects urban CE. Columns (1) to (3) of Table 4 display the findings; the matrices used in the regression equation are geographical adjacency (W1), geographical distance (W2), and spatial economic matrix (W3), respectively. The SDM model continues to be applicable underneath the revised spatial weighted matrix, as can be seen by the fact that rho is of statistical significance at a 10% level. Additionally,
The Results of Different Spatial Matrix.

Note. t-statistics are in parentheses.
p < .01. **p < .05. *p < .1.
Endogeneity Test
The selection of pilot cities might be related to the development and openness of the local economy, and these factors may also affect urban CE. Therefore, according to D. A. Gao et al. (2024) and D. Gao et al. (2024), we use appropriate instrumental variables to deal with the endogenous problem. We specifically chose each city’s fixed telephone and post office density per resident in 1984 as the instrumental variables. One way or another, fixed telephones and the development of the Internet are intimately intertwined since cross-border e-commerce relies on Internet information technology, and early Internet access in China started from telephone dialing. Cities with historically high fixed telephone penetration rates may also have current high Internet penetration rates. The geographical distribution of post offices will act on the use of fixed telephones and the growth of the Internet, which in turn could have an impact on the growth of digital trade and international data interchange. As a result, the CBEC policy’s instrumental variables are chosen from data from post offices and fixed telephones since they satisfy the relevance criteria. On the other hand, conventional communication methods like post offices and landlines have little effect on urban CE, thus they can be excluded. Nunn and Qian (2014) state that we can convert the initial cross-sectional tool variables into panel tool variables by simultaneously introducing time-varying variables. In other words, the number of Internet users nationwide in the preceding year, as well as the number of landlines and post offices per capita of each city in 1984, are utilized to generate the interaction terms.
The first stage’s findings are shown in Columns (1) and (3) of Table 5, where the estimated coefficients are considerably positive. These results demonstrate that the quantity of post offices and telephones per capita is positively associated with the setting up of the CBEC pilot zone. The findings from the second stage are shown in columns (2) and (4). The instrumental variables got through the relevant statistical test, as can be seen. The likelihood ratio (LM) statistic was considerable at a significance level of 1%, the Wald-F statistic was higher than the threshold for significance in the weak identification test of the instrumental variables, and the outcome of the Yogo weak verification testing carried out at the level of 10%, which confirmed the rationality of the selection of the instrumental variables. The coefficients of
The Results of Endogeneity Tests.

Note. t-statistics are in parentheses. The value of [] is the p-value and the value of {} is the critical value at the 10% level of the Stock–Yogo weak recognition test.
p < .01. **p < .05. *p < .1.
Placebo Test
Although we have added control variables in the baseline regression to exclude the impact of other factors on urban CE as much as possible, there are still some unpredictable factors affecting the empirical results in reality. Therefore, referring to the method of Chetty et al. (2009), the placebo test is used to exclude the influence of missing variables. Specifically, this paper randomly constructs false treatment groups from 253 cities in the sample and repeats 500 simulated regressions based on Equation 2. The estimated results are shown in Figure 5. It can be seen that the regression coefficients obtained through the counterfactual experiment are distributed around 0 and conform to the normal distribution, which is much higher than the true value in the baseline regression (shown by the dotted line). Therefore, it is confirmed that the benchmark results are robust.
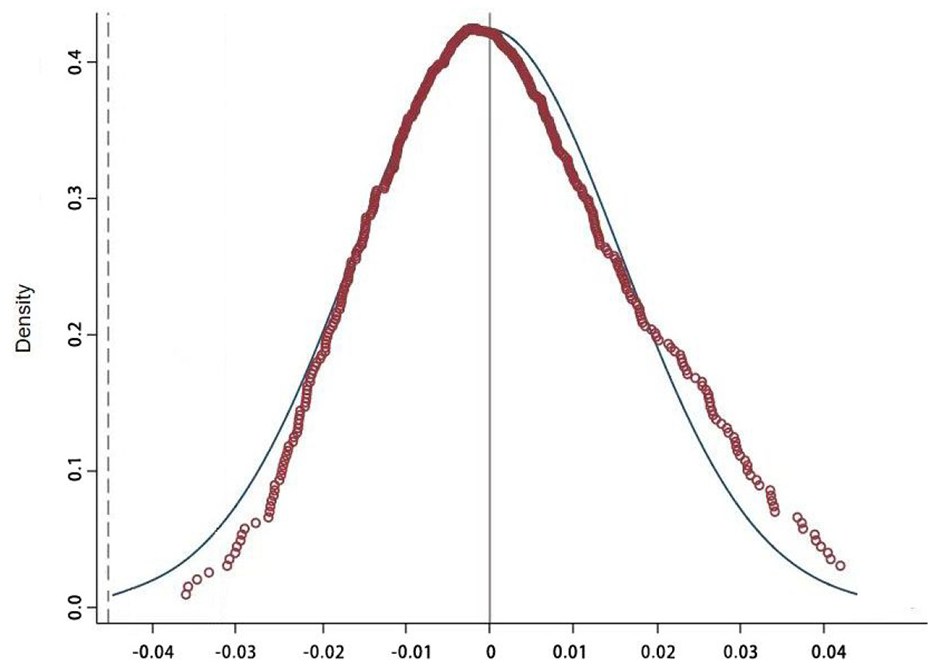
Results of the placebo test.
Considering Other Policy Interference
In addition to CBEC policy, other policies may also have an impact on urban CE, so the estimated effect of CBEC policy in the baseline regression may be not a net effect. Referring to the practice of Y. Bai and Jia (2016), we also ensure the robustness of the results by excluding the impact of other policies in the same period. Two policies may have an impact on the policy effect estimation in this paper. The first is the “Low-carbon Pilot City Policy”, which is to promote green low-carbon development and ensure the realization of China’s action goal of controlling greenhouse gas emissions. China has promoted three batches of national low-carbon city pilots in 2010, 2012, and 2017, which makes the CE reduction of CBEC policy may be affected. Therefore, this paper adds the virtual variable of the “Low carbon” into the regression model (2).
The second is the “Carbon Emission Trading Pilot City Policy”. China’s first carbon emission trading platform was launched in Shenzhen in 2013, followed by pilot carbon emission trading in Beijing, Tianjin, and other provinces. Therefore, to exclude the impact of this policy on the baseline estimation results, we further add the “ETS” to the regression model (2), which is the interaction term of the time dummy variable and the city dummy variable. The regression results are shown in Table 6. After adding the policy terms of “Low carbon” and “ETS,” the coefficient of the CBEC policy are still negative and significant, and the regression results of the W × CBEC coefficient are also kept significant, indicating that the baseline results of this paper are robust.
The Results of Excluding Other Policy Effects.

Note. t-statistics are in parentheses.
p < .01. **p < .05. *p < .1.
Heterogeneity Analysis
Urban Digitization Level
Digital trade is significantly influenced by the establishment of urban technological infrastructure as well as the degree of digitization in the economy. According to D. A. Gao et al. (2024) and D. Gao et al. (2024), we calculate the level of urban progress in the digital economy and divide sample cities into two groups based on the mean value: high level and low level of urban digitization. The columns in the first two rows of Table 7 display the regression findings. It has been discovered that the corresponding coefficient of CBEC stays substantially negative regardless of whether a city has a high or low level of digitization technology. But cities with higher urban digitalization typically have a stronger carbon reduction effect than others, and the coefficient is more significant. The primary cause might be that cities with higher levels of digital development have better fundamental conditions for implementing digital trade and more opportunities for businesses to engage in international e-commerce. This circumstance favorably affects the concentration of international e-commerce businesses and facilitates a more efficient resource allocation to advance urban CE reduction.
The Results of the Heterogeneity Analysis.

Note. t-statistics are in parentheses.
p < .01. **p < .05. *p < .1.
Resource-Based Cities
Cities with different resource endowments have different development modes, and the influence of digital trade on the environment might also be distinct. We categorize cities into resource-based and non-resource-based regions following a list published in the National Sustainable Development Plan on Resource-centered Cities (2013–2020) to investigate the heterogeneous effect on cities with various endowments of resource limitations. Columns (3) and (4) in Table 7 display the results of the coefficient of
Mechanism Analysis
Drawing on theoretical mechanism analysis, digital trade exhibits the potential to effectively curtail urban CE via three primary mechanisms: enhancing the efficiency of resource allocation, facilitating the upgrading of industrial structures, and propelling advancements in green innovation. As a result, we build a mediation model to evaluate the aforementioned assumptions. The final results are shown in Table 8.
The Results of the Mechanism Test.

Note. t-statistics are in parentheses.
p < .01. **p < .05. *p < .1.
Resource Allocation Efficiency
Columns (1) and (2) of Table 8 present the results. At the 1% significance level, the coefficient of CBEC in column (1) is positive, indicating that the CBEC policy significantly improves the overall effectiveness of resource allocation. By adding intermediate variables in column (2), it is found that the obtained CBEC coefficient is still negative at the 5% significance level, indicating that the effectiveness of resource allocation leads to the mediating effect of CBEC policy on urban energy conservation and emission reduction. Hypothesis 2 is confirmed.
Upgrading of Industrial Structure
The results can be seen in columns (3) and (4) of Table 8. The CBEC policy greatly optimizes the urban industrial structure, as shown by the positive coefficient of CBEC in column (3) at a significant level of 5%. When mediating variables are included in column (4), we find that the coefficient of CBEC remains negative at the 1% significance level. This result indicates that industrial structure is involved in the mediating effect of CBEC policy on urban CE. Digital trade accelerates development through the integration of services and manufacturing, reducing energy consumption and urban carbon emissions. Hypothesis 3 is confirmed.
Green Technology Innovation
The coefficient of CBEC in column (5) of Table 8 is significantly positive, indicating that CBEC policy has made a great contribution to the development of urban green technology. In column (6), the coefficient of CBEC is still negative after adding the intermediate variable, indicating that green innovation plays a bridging role in the impact of CBEC policy on urban CE reduction. Hypothesis 4 is confirmed.
Conclusion and Policy Implication
As a way for China to attain high-quality development, the situation becomes crucial to advance high-level opening up. This study constructs a SDID model for evaluating the influence of digital trade on urban CE and its mechanism, based on the panel data of 253 prefecture-level cities in China from 2005 to 2020. Firstly, the CBEC policy reduces the CE of the pilot cities and its surrounding cities, that is, the policy has a significant spillover effect. In addition, the effect of CBEC policy on reducing CE is even greater in resource-based cities and cities with high digitization levels. Further, the CBEC policy primarily promotes the reduction of urban CE by driving shifts in industry structure, enhancing resource allocation effectiveness, as well as encouraging green innovation. In summary, the CE reduction effect of CBEC policy can provide a reference for sustainable urban development.
Although this paper explores the influence and impact channels of CBEC policy on CE as much as possible, the potential influence mechanism is not fully covered. The limitation of this paper is to explore the CE effect of CBEC policy and its CE reduction path at the practical level from a more micro-level. Therefore, the future research direction of this paper is to deeply explore the feasible CE reduction path from the city’s high carbon industry.
The policy suggestions are made based on the quantitative assessment: First, the Chinese government ought to persist in supporting the implementation of the CBEC policy and replication and promotion of the successful pilot experience in light of the complex international economic and trade environment, and create a world-class business environment for the growth of digital trade. Second, we are supposed to put more focus on urban Web technologies for communication and information, in addition to institutional assurance. Expanding the advancement of urban internet connectivity is more beneficial for attracting cross-border e-commerce market participants and fostering the high-quality, environmentally friendly growth of cities. The third is to prioritize the growth of digital trade in resource-based cities. They have a high energy dependence and rely heavily on their resource endowment for growth. Digital trade helps to advance green innovation and municipal industrial structure, which is more appropriate for the growth of low-carbon economies. Fourth, pay close attention to how the digital trading strategy affects other nearby areas. The growth of digital trade declines the barrier to technological spillover whilst simultaneously lowering the carbon emissions of neighboring towns.
Footnotes
Declaration of Conflicting Interests
The author(s) declared no potential conflicts of interest with respect to the research, authorship, and/or publication of this article.
Funding
The author(s) disclosed receipt of the following financial support for the research, authorship, and/or publication of this article: This work was supported by the Ministry of Education Humanities and Social Science project, “green” and “intelligent manufacturing” integration of new quality productivity improvement in manufacturing: effect assessment and path optimization, No. 24YJC790043. Hainan Provincial Philosophy and Social Sciences Planning Project (HNSK(JD)22-4), Hainan University Research start-up Funds (kyqd(sk)2022030).
Data Availability Statement
The data that support the findings of this study are available from the corresponding author [Y.C.], upon reasonable request.