
Abstract
We develop a comprehensive patent quality index and analyze the spatial and temporal change of urban patent quality in China over the period 2001 to 2019. We focus on three critical dimensions of patent quality: technical, legal, and economic values. The findings indicate that Chinese urban patents demonstrate a gradual and sustained improvement in quality over time, yet substantial room for enhancement remains. Spatially, urban patent quality in China exhibits evident clustering patterns, with the coexistence of high-high, low-low, high-low, and low-high clusters. Moreover, a pronounced disparity exists between the eastern and western regions, with higher patent quality observed in the former and relatively lower quality in the latter, implying regional disparities. Our findings’ implications are paramount for policymakers and regional development planners.
Introduction
In recent years, China has achieved significant accomplishments in terms of the scale of patent quantity. According to data from the China National Intellectual Property Administration (CNIPA), China authorized 798,000 invention patents in 2022 and received 74,000 Patent Cooperation Treaty patent applications, ranking first in the world for four consecutive years. As of the end of 2022, China’s effective invention patent inventory was 4.212 million, and the latest “World Intellectual Property Indicators” report released by the World Intellectual Property Organization (WIPO) shows that China’s effective invention patent inventory ranks first in the world. However, what really drives the promotion of total factor productivity is the quality of patents, instead of the quantity of patents (Jiang et al., 2024; Lv et al., 2021; H. Wu et al., 2022). In China, the overall quality of patent creation has not shown commensurate improvement (Long & Wang, 2019), which contrast with the massive quantity of patents. Previous research indicates that the surge of China’s patents can be largely attributed to government’s patent-promoting policies instead of real R&D efforts (Hu & Jefferson, 2009; H. Wu et al., 2022), resulting in numberless low-quality patents. Nevertheless, in the context of China’s innovation-driven development, solely pursuing patent quantity is no longer sufficient to gain a competitive edge among regions. Enhancing the level of patent quality in cities becomes a more crucial approach to strengthen regional innovation capacity and promote high-quality economic development.
The definition of patent quality varies with the research topic, and academia explores the concept of patent quality from different perspectives. From the perspective of scholars of innovation economics, the “patent quality” can refer to the technological novelty (Abraham & Moitra, 2001; Scotchmer & Green, 1990), legal value (Allison & Hunter, 2006; Wagner, 2009), or economic value of the patent (Hall & Harhoff, 2004; Merges, 1988). In legal literature, patent quality refers to the quality of the patent application text, specifically how well it defines the scope of patent rights and protects the relevant technology (de Rassenfosse et al., 2021; Merges, 1988; Wagner, 2009). Since different subjects and value evaluation perspectives reflect the quality characteristics of patents, Higham et al. (2021) proposed that patent quality should be a multidimensional and inclusive concept. The patent quality in this paper refers to the overall technological novelty, economic and strategic value, and enforceability of a patent.
The shift of focus from patent quantity to patent quality necessitates the reasonable evaluation of patent quality, involving issues related to patent quality indicators and measurement methods. With the development of large-scale patent databases and the emergence of big data analysis tools, scholars have begun constructing and proposing a series of widely recognized and practically applicable indicators for in-depth analysis of patent quality. Those indicators are primarily built on the information of patents from a particular aspect and to some extent reflect the quality of patent. Currently, commonly used indicators include patent citations (Atallah & Rodríguez, 2006; Czarnitzki et al., 2011; Ernst, 2003; Harhoff et al., 2003; Marco, 2007; Trajtenberg, 1990), grant rate (Frakes & Wasserman, 2015; Nagler & Sorg, 2020), patent renewal (Clancy & Moschini, 2013; Lanjouw et al., 1998; Serrano, 2010), technological breadth (Akcigit et al., 2016; Dindaroğlu, 2017), and patent scope (Marco et al., 2019; Putnam, 1996). Additionally, the proportion of invalidated patents through judicial rulings (Cremers et al., 2016) is widely used in the international academic community. However, as research on indicators of patent quality deepens, shortcomings in measuring patent quality have gradually emerged. Some researchers have found varying degrees of truncation, bias, and noise effects in different indicators (Burke & Reitzig, 2007; Hall et al., 2005). Furthermore, different single indicators often diverge in measuring the quality of the same patent (Higham et al., 2021). Given this, scholars have attempted to develop multidimensional and composite patent quality measurements (comprehensive measurement) based on various patent information (Hou & Lin, 2006; Lanjouw & Schankerman, 2004; Schettino et al., 2013; J.-L. Wu et al., 2016). However, regarding the research subjects, existing studies have mainly focused on the national or provincial levels (Hefa & Li, 2014), specific technological domains (Lanjouw et al., 1998), and company levels (Dindaroğlu, 2017), while there is a scarcity of patent quality measurement and evaluation analysis at the city level.
Building upon these gaps, this paper aims to characterize city patent quality as the extent to which patents influence the comprehensive competitiveness of cities. We establish an urban patent quality index system that encompasses three dimensions: technological, legal, and economic value of patents. Drawing on balanced panel data from 313 prefecture-level cities in China between 2001 and 2019, the paper employs the entropy weight method to measure and evaluate city patent quality. Additionally, we utilize non-parametric kernel density estimation, regional gap index, the global Moran’s index, and Local Indicators Spatial Autocorrelation (LISA) scatter plot to reveal the spatial and temporal evolution of city patent quality (H Uallacháin & Leslie, 2005). These findings provide a theoretical and practical foundation for implementing comprehensive initiatives to improve patent quality, enhance the innovation capacity of Chinese cities, and promote high-quality economic development.
The contributions of this paper are twofold. On the one hand, it shifts the research focus toward urban patent quality, providing insights into the innovation capabilities of cities and acknowledging the regional attributes of innovation. Addressing patent quality from the city’s perspective is crucial for several reasons. First, focusing on cities allows for a more granular and targeted approach to policy-making. National or state-level analyses can overlook regional disparities and local nuances that influence patent quality. By zooming into cities, policymakers can identify specific strengths and weaknesses, enabling more effective and tailored interventions to enhance patent quality and innovation capacity. Second, cities are at the forefront of addressing global challenges such as urbanization, environmental sustainability, and smart city development (Lv et al., 2021; Zhao et al., 2022). High-quality patents in these areas can significantly contribute to solving these issues (Bataineh et al., 2024; Fischer et al., 2009). Thus, understanding and improving patent quality at the city level is vital for fostering innovations that directly impact urban living and sustainability. Third, cities often compete globally to attract talent, investment, and technology. Enhancing patent quality can boost a city’s reputation as an innovation hub, attract foreign direct investment, and promote economic growth. This competitive advantage is crucial for cities to thrive in the global economy. This paper constructs a comprehensive evaluation index for urban patent quality, incorporating multiple quality dimensions, using data from 313 Chinese cities over an 18-year period. This system provides a robust framework for assessing and comparing patent quality at the city level, offering valuable insights into urban innovation capabilities and the regional attributes of innovation.
On the other hand, utilizing spatial analysis techniques such as the global Moran’s index and LISA scatter diagram, the paper reveals significant temporal and spatial patterns in patent quality across Chinese cities. We find an upward trend in patent quality over time, an initial increase followed by a decline in regional differences, and distinct spatial clustering characteristics, such as high-high clusters in the eastern regions and low-low clusters in the western regions. These insights serve as critical policy references for enhancing the overall innovation strength of Chinese cities.
The remaining sections of this paper are as follows. Section 2 introduces the methodology of index construction and data. Section 3 describes the results of our index of patent quality and discusses changes in the index over time and regions. The final section concludes the implications of the findings for policy recommendations aimed at enhancing innovation capabilities in Chinese cities.
Methodology
Data
We collected data on patents granted by the CNIPA using the PatSnap database. PatSnap integrates more than 140 million patents from 116 countries and regions, covering the period from 1790 to the present. The CNIPA issues three type of patents: Invention patent, utility model, and industrial design. While industrial design patents are important for product differentiation and market competition, invention and utility model patents are more critical for understanding technological innovation and its impact on economic development. Moreover, invention and utility model patents are classified under the International Patent Classification (IPC) while industrial design patents use the Locarno Classification, which cause serious issues of incomparability and uncomputability in patent quality metrics. Thereafter, we focus on the invention patents and utility model patents of China. To calculate patent quality, our dataset includes detailed metrics such as citations, IPC classification, maintenance, and legal status. Since ungranted patents lack quality metrics like maintenance and legal status, our dataset comprises only granted patents. Our final sample contains 11,977,065 patents data on invention and utility model patents granted by CNIPA from 2001 to 2019. Among them, there are 2,534,526 invention patents and 9,442,539 utility model patents.
Construction of Patent Quality Index
The process of constructing a multidimensional indicator system entails the seamless integration of diverse patent information across multiple dimensions. Its primary objective is to offer a comprehensive and robust assessment of patent quality, thereby mitigating the limitations associated with relying solely on single indicators. By adopting this approach, researchers can effectively capture the entire spectrum of factors that influence patent quality.
The dimensions of the patent quality can be divided into three categories: technology, legal, and economic value. We define the technology quality of a patent as the advance and importance of the patented technology itself; Economic quality pertains to the economic value derived from the patent, quantified by the revenue generated through the application of the patented technology; the legal quality of patents is determined by agents and examiners through exerting their subjective initiative, and it is reflected in the quality of the final patent documents. The quality of patent document drafting is inextricably linked to the adequate protection of patents.
We select some variables in each category based on extant literature and analysis. Firstly, from a technological perspective, in general, the greater the number of inventors, the greater the diversity and quantity of knowledge and experience contributed by different inventors, and the more solid the knowledge base of the technological invention, resulting in the higher technology quality of the patent (Kafouros et al., 2015; Schettino et al., 2013; Squicciarini et al., 2013). Patent citations and literature citations reflect the technological and scientific foundation of a patent and can be used to measure its technology quality (Atallah & Rodríguez, 2006; Trajtenberg, 1990). The number of citations received by a patent not only measures its contribution to current technology but also indicates the degree of recognition by academic peers, thus closely related to the value of the patent (Gambardella et al., 2008; Hall et al., 2005; Harhoff et al., 2003). However, it is not possible to predict future citation counts, and thus the data is incomplete. Therefore, further consideration is given to the average citation lag time and the first citation lag time of patents in this paper.
From a perspective of legal quality, three metrics—average number of IPC classification numbers, number of unique noun phrases in claims, and total number of claims—are chosen to evaluate the legal quality of patents. The average number of IPC classifications per patent serves as an indicator of the interdisciplinary nature and potential applicability of the patented technology across various domains (Moaniba et al., 2019; Nagaoka et al., 2010). A higher average suggests that the patent may be relevant to multiple areas, potentially increasing its impact and utility (O’Donoghue et al., 1998; Zhu et al., 2022). It can also imply a broader scope of innovation, which might contribute to a stronger competitive edge in various sectors. Secondly, the number of unique noun phrases in claims provides a measure of the precision with which the patent delineates its scope of protection (Marco et al., 2019). Noun phrases in patent claims are crucial as they define the components and boundaries of the invention. By counting unique noun phrases, this metric assesses the precision and clarity of the patent’s claims. Detailed and clear claims can enhance the enforceability of the patent, reducing ambiguities that could be exploited in legal challenges (Ashtor, 2022; Indukuri et al., 2007). Lastly, the aggregate number of claims reflects how comprehensively the invention is protected. Patents with more claims can cover a wider range of features or uses of the invention, offering broader legal protection (Marco et al., 2019; van Zeebroeck et al., 2009). This breadth can be pivotal in defending against infringements and in staking a claim in competitive markets.
From an economic quality perspective, four indicators are employed. First, the average maintenance, which reflects the duration patents are kept active, indicating their ongoing commercial utility and profitability (Lanjouw et al., 1998; Schankerman & Pakes, 1986). Secondly, a patent family is a collection of patent applications covering the same or similar technical content (Squicciarini et al., 2013). A larger average size of patent families indicates a strategic approach to securing a broader territorial coverage, often signaling a patent’s significant investment potential and market value (Harhoff et al., 2003). This is particularly crucial for inventions expected to have a wide commercial impact, necessitating protection across multiple legal jurisdictions to maximize economic returns. Thirdly, frequent law status changes can denote strategic adjustments to a patent’s legal standing or commercial terms, underscoring its central role in the patent holder’s business operations and its substantial strategic value (Cremers et al., 2016; Ford, 2016; Miller, 2012). Fourth, and the frequency of patents involved in legal disputes, pointing to their high stakes and perceived market value (Allison et al., 2010; Miller, 2012).
Based on the above analysis, this paper establishes a composite index to measure the quality of urban patents from three aspects: technology quality, legal quality, and economic quality. The sub-indicators are shown in Table 1.
Indicators for Measuring the Composite Index of Patent Quality.

Note. All patent count denotes the total number of invention and utility model patents.
Entropy Weight Method
We apply the panel entropy weight method to construct the composite index of urban patents (Huang & Liu, 2018). Firstly, the sub-indicators shown in Table 1 are standardized based on two normality methods. When the indicators are benefit-type, for example, Average number of IPC classification numbers, Average number of citations, etc., the calculation for normalization can be expressed as Equation 1; When the indices are cost-type, which includes Average citation lag time and First citation lag time, the calculation for normalization can be formulated as Equation 2.


Where, i denotes city, j represents the sub-indicator. While
Next, the panel entropy weight method is used to determine the index weights applied in the process of calculating the composite index.
(1) Calculate the probability of each sub-indicator for the

(2) The information entropy of the

Where
(3) The weights obtained from information entropy are calculated as follows:

(4) Based on the weights we obtain through the above steps, we calculate the score of the patent quality index of each city as the following formula.

The Global Moran’s Index
The global spatial autocorrelation is mainly used to analyze whether a certain index has spatial autocorrelation in the whole region. The commonly used metric is global Moran’s I, which is calculated as follows:

Where,
The global Moran’s index ranges from −1 to 1, where values less than 0 indicate a negative correlation, values greater than 0 indicate a positive correlation, and a value equal to 0 signifies independence among cities. A higher absolute value indicates a stronger clustering effect of an attribute in the spatial distribution of the urban patent quality. When the global Moran’s index value is closer to 1, it implies a more significant clustering effect, and when it is closer to −1, it indicates a more significant convergence of the attribute in the spatial distribution of patent quality.
The Local Moran’s Index
The global Moran’s index primarily measures the overall correlation degree of the quality of urban patents across the whole nation, failing to provide insights into the spatial distribution pattern of specific local areas. To overcome this limitation, the local Moran’s index is employed, offering a means to discern the spatial correlation characteristics of particular regions. This approach clusters cities with similar patent quality, allowing for a more detailed understanding of the spatial distribution patterns within China. Thus, introducing the local Moran’s index is crucial to assess autocorrelation within specific areas and unveil the spatial heterogeneity of the data. The local Moran’s index

The local Moran’s index is not constrained to the range of [−1, 1]. And local Moran’s I scatterplot is divided into four quadrants, each corresponding to a distinct spatial correlation pattern. This scatter diagram allows for the analysis of the spatial correlation distribution of patent quality across four quadrants: high-high (HH), high-low (HL), low-high (LH), and low-low (LL).
In the first quadrant (HH), both the patent quality and its surrounding areas exhibit high values, indicating a cluster of high-quality patents. The second quadrant (LH) signifies low patent quality but is surrounded by areas with high-quality patents. The third quadrant (LL) represents low patent quality and surrounding regions with similarly low-quality patents, indicating a cluster of low-quality patents. Finally, the fourth quadrant (HL) corresponds to high patent quality in an area surrounded by low patent quality values. Hence, quadrants HH and LL demonstrate positive spatial autocorrelation, revealing clusters of similar attribute values. In contrast, quadrants HL and LH indicate negative spatial autocorrelation, highlighting spatial anomalies or disparities in patent quality values.
Results and Discussion
Temporal Variations in Urban Patent Quality
After constructing the composite index of city patent quality using the entropy weight method, the average value of city patent quality was calculated for each year. Figure 1 illustrates the mean value of patent quality in Chinese cities from 2001 to 2019, highlighting both average scores and growth rates. Initially, the average patent quality score remained modest and stable from 2001 to 2006, indicating a period of groundwork laying. From 2007 onward, the average score embarked on a more consistent upward trajectory, reflecting gradual but solid advancements in innovation quality, likely driven by sustained policy efforts and investments in research and development. The growth rate, on the other hand, paints a picture of a highly dynamic environment. The growth rate experienced significant fluctuations before 2010, with notable peaks in 2004 and 2007, indicating substantial improvements in patent quality during those years. However, there were also significant drops, such as in 2006, reflecting instability in the growth rate during this period. After 2010, the fluctuations in the growth rate became relatively smaller, suggesting a more stable and consistent improvement in patent quality. This reduced volatility likely indicates a maturing of policies and a more stable innovation environment in Chinese cities post-2010. This nuanced pattern of growth and volatility underscores the resilience and adaptability of the innovation ecosystem in Chinese cities, pointing to a long-term commitment to improving patent quality despite the inherent challenges. Overall, Figure 1 reflects a positive long-term improvement in patent quality across Chinese cities, despite the short-term volatilities in the growth rate.

The mean value of patent quality in Chinese cities over time.
To gain more detailed insights and a finer understanding of these trends, we present the top 30 cities are ranked based on the average value of city patent quality for all year in Table 2. This ranking reveals the evident volatility of patent quality in various cities over time. Notably, cities such as Hefei, Jiaxing, Yancheng, Huzhou, Huizhou, and Nanchang have experienced a significant increase in patent quality. On the other hand, cities like Suzhou, Guangzhou, Nanjing, Tianjin, Dongguan, Zhengzhou, and Changzhou have shown a consistent and steady improvement in patent quality over the years. In contrast, there are several cities, including Ningbo, Changsha, Shenyang, Dalian, Harbin, Jinhua, and Jilin, where patent quality has witnessed a noticeable decline in recent times.
Top 30 Cities in Terms of Average Value of City Patent Quality.

Among the top 30 cities, the majority have consistently maintained high patent quality levels. For instance, Beijing, Shenzhen, and Shanghai consistently rank at the top, highlighting their strong and sustained innovation capabilities driven by robust R&D investments, advanced infrastructure, and favorable policy environments. These cities benefit from being major economic hubs with access to abundant resources and talent pools, fostering an environment conducive to high-quality patent creation. Conversely, cities like Wuwei, Suizhou, Tongchuan, Jiuquan, Hehe, Pingliang, Tieling, Guangyuan, Hegang, Qitaihe, Yichun, and Shuozhou have consistently exhibited low levels of patent quality. These cities may lack the same level of resources, infrastructure, and policy support, highlighting the disparities in innovation capabilities across different regions. Understanding the factors contributing to these differences is crucial for developing targeted policies to enhance patent quality uniformly across the country. Thus, it is important to further investigate how the overall patent quality of cities change over time, considering factors such as economic development, educational investment, industry presence, and policy support.
Non-parametric kernel density estimation, which has the advantages of fewer assumptions and closer to realistic variable relationships, can analyze the time-series evolutionary characteristics more accurately. Therefore, this paper adopts nonparametric kernel density estimation to obtain the distribution status, and selects the evolution scenario of patent quality distribution in cities in major years obtained by optimal bandwidth nonparametric kernel density estimation. In Figure 2, we can see that the main peak height tends to rise first and then fall, and the main peak height rises from 2001 to 2005 and then falls, indicating that the gap in overall city patent quality increases first and then decreases. At the same time, from 2008 to 2019 years, the main peak shifted to the right, indicating that the overall patent quality of Chinese cities improved over time.
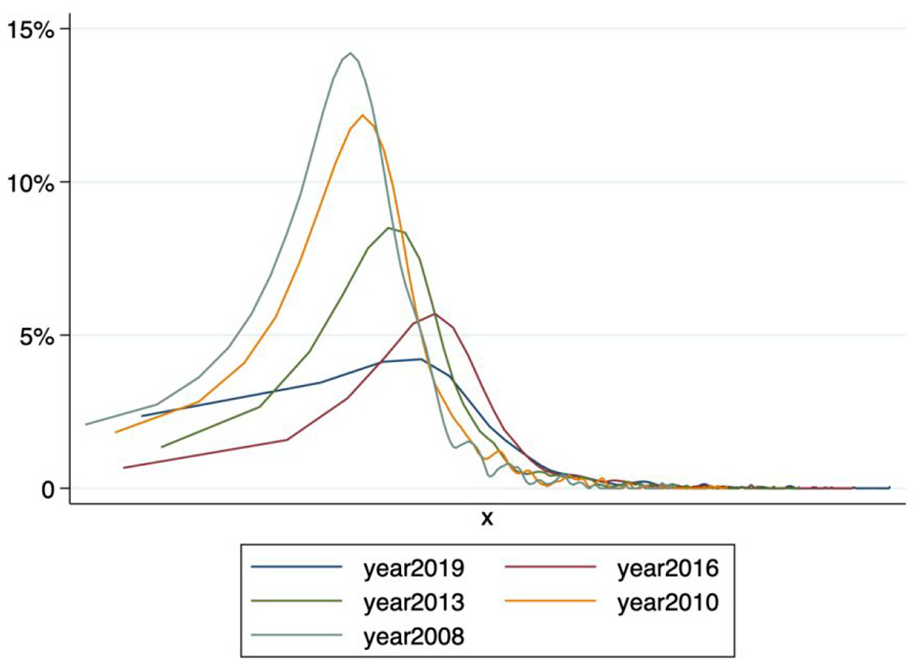
Kernel density of patent quality index.
According to the kernel density curve, another temporal evolution characteristics of patent quality in Chinese cities can be summarized as follows: (1) A slight rightward shift as the number of years increases, which indicates that the overall city patent quality has only improved slightly compared with the substantial increase in the number of patents in recent years, and there is still great room for improvement. (2) As the number of years increases, the gap between the overall city patent quality increases first and then decreases.
Spatial Variations in Urban Patent Quality
The global Moran’s index of city patent quality from 2001 to 2019 is calculated year by year to reflect the overall correlation, and the results are shown in Table 3. In Table 3, the Moran’s index is significant every year from 2003 onward, while the values are all greater than 0. It suggests that cities with similar patent quality are clustered together, while a negative index would indicate dispersion. From Figure 3, it can be obtained that the spatial autocorrelation tends to increase over time. This indicates that the patent quality of Chinese cities in general shows the spatial characteristics of geographic aggregation, and there is a spatial spillover effect of innovation, and the effect enhances over time.
Global Moran’s I Index of Patent Quality in Cities, 2001 to 2019.


Plot of global Moran’s I index.
The local Moran’s index was further calculated for the composite index and plotted for the LISA agglomeration, where the results for 2001, 2005, 2008, 2012, 2016, and 2019 are shown in Figure 4. Based on the results, we notice two interesting phenomena regarding the spatial distribution of patent quality in China.

LISA clustering map by year.
Primarily, different cities display distinct spatial dependencies, leading to various types of clustering patterns, such as high-high (HH), low-low (LL), and high-low (HL) agglomerations. High-high (HH) agglomerations are evident in regions like the Yangtze River Delta and Pearl River Delta, where cities with high patent quality cluster together. In contrast, low-low (LL) agglomerations are observed in provinces in the central region, such as Henan, Jiangxi, and Anhui, the northeastern province of Heilongjiang, and numerous cities in Guangxi, Gansu, Shaanxi, and Inner Mongolia in the western region, where cities with low patent quality cluster together. Additionally, within the same province, there are cities with both high and low patent quality, indicating a significant imbalance and showcasing high-low (HL) clustering characteristics.
The higher patent quality in the eastern region can be attributed to several key factors. Firstly, the legal system in the eastern region is more comprehensive and rigorously enforced, leading to higher costs associated with patent violations. Additionally, the region’s industries are meticulously divided, with specialized intermediaries aiding in patent literature writing, organizations facilitating the patent application and examination process, and law firms specializing in Intellectual Property Rights (IPR) litigation (Varsakelis, 2001). This supportive infrastructure enables invention applicants to seek robust legal protection. Moreover, due to the eastern region’s active involvement in the global industrial chain division of labor, the increasing presence of international enterprises has encouraged invention applicants to seek international intellectual property rights protection, contributing to the higher quality of patents in the region. Secondly, the eastern region implements more preferential subsidy policies for technological innovation, creating an encouraging and favorable environment that attracts a significant influx of scientific and technological resources, including universities, research institutions, and high-tech enterprises (Lin et al., 2021). Frequent technology exchanges and evident knowledge spillover in this vibrant ecosystem significantly enhance the quality of patent technology in the eastern region (Moaniba et al., 2019; Un et al., 2010). Finally, the eastern region utilizes tax incentives, financial subsidies, and the establishment of a market-oriented intellectual property trading platform to foster the development of the venture capital industry. These measures improve the efficiency of market transformation for R&D technologies, enabling innovation resources to align with market demands and resulting in higher-quality patent operations in the eastern region.
The results of LISA’s agglomeration diagram also show that the patterns of patent quality agglomeration in different regions are dynamic and exhibit a trend of continuous reinforcement. According to the global Moran’s index, China did not have a significant urban patent quality agglomeration model prior to 2003. However, by 2005, scattered agglomerations began to appear, primarily concentrated around major cities such as Shanghai, Jilin, and Guangzhou, where small-scale high-high agglomerations emerged. As patent activities intensified in China, by 2008, a pattern of high-high agglomeration in the eastern region and low-low agglomeration in the western region had roughly formed, along with high-low agglomeration phenomena in a few large cities in the central and western regions. This pattern subsequently began to self-reinforce. High-high agglomeration areas in the east started to radiate and diffuse to surrounding regions. Meanwhile, the low-low agglomeration pattern in the western regions (such as Inner Mongolia and Yunnan) further strengthened and spread. Simultaneously, high-low agglomerations formed around a few large cities in the central and western regions, such as Chongqing, Wuhan, and Xi’an.
We argue that this trend is mainly due to the large-scale cross-regional movement of labor in China. The higher economic development levels in coastal areas and major cities in the central and western regions continuously attract a significant amount of high-quality labor (Fan, 2005; Fang et al., 2009). This enables economically developed regions like the Beijing-Tianjin-Hebei region, the Yangtze River Delta, and the Pearl River Delta to enter a virtuous cycle, continuously strengthening their technological capabilities and leading to technology transfer and diffusion to surrounding areas (Fackler et al., 2020). Conversely, many western regions experience a weakening of patent activities due to the outflow of high-quality talent. Although a few large cities in the central and western regions have managed to gather provincial or nearby scientific and educational resources to acquire certain technological capabilities, this more likely manifests as a siphoning effect, causing a more severe loss of high-quality labor from surrounding areas. This siphoning effect could be accelerated through constantly improving transport infrastructure. For example, Li et al. (2020) indicate that cities with higher economic development level and speed would attract greater net-inflow labor after the high-speed rail opened, while the others would only see limited positive or even negative benefits. This leads to a high-low agglomeration phenomenon around major cities in the central and western regions.
Secondly, we notice that there is a during the observation period, the cities in the Yangtze River Delta and the Pearl River Delta continued to show the phenomenon of high-high concentration of urban patent quality. These areas have a radiating effect that drives the neighboring regional cities, with the high-high concentration areas of the eastern coastal cities gradually spread. Meanwhile, the phenomenon of low-low concentration of urban patent quality mainly appears in central and western China and northeastern China. Cities in Shaanxi, Inner Mongolia, Heilongjiang consistently fall within this range. Notably, in 2001, a high-high agglomeration phenomenon appeared in the central region, which then disappeared and transformed into a high-low agglomeration in 2008 and 2019.
The results of LISA’s agglomeration diagram show that the patent quality of the eastern region, especially the coastal region, shows the spatial characteristics of high-high agglomeration. The possible reasons are: the eastern region has a large amount of investment in infrastructure construction and higher output. For example, Beijing leads the development of patent quality, Beijing, Jiangsu and Zhejiang regions have obvious factor endowment effect, the number of schools, teaching and research personnel, R&D research applications and science and technology service funds and other inputs are larger compared with the central and western regions, while the lack of talents in the western regions leads to lower personnel quality compared with Beijing, Tianjin and Tang, Pearl River Delta and Yangtze River Delta regions, coupled with the fact that the flow of talents is concentrated in developed regions yet and the talent introduction mechanism is not perfect, etc., the region’s capacity is limited so that the flow of scientific talent to relatively fixed, developed areas are more powerful to retain high-tech talent and high-quality think tanks, the vast majority of talent is not willing to remote areas, it is difficult to drive the western region to improve the level of innovation.
Conclusion
In this study, we construct a city patent quality index system that incorporates the technical and economic aspects of patents. Using data from 313 cities in China spanning the period from 2001 to 2019, we employ the entropy weight method to measure and evaluate city patent quality. Additionally, we investigate the temporal and spatial evolution characteristics of patent quality in Chinese cities by utilizing the global Moran’s index and LISA scatter diagram.
The main findings of this study are as follows: Firstly, there are evident temporal and spatial patterns in patent quality across Chinese cities. From a temporal perspective, the kernel density function exhibits a slight rightward shift over time, indicating a gradual upward trend in patent quality with potential for further improvement. However, regional differences in patent quality show an initial increase followed by a decline. Spatially, patent quality in Chinese cities demonstrates spatial dependence. The significantly positive global Moran’s index confirms the presence of spatial clustering characteristics, while the LISA scatter plot reveals the coexistence of high-high, low-low, high-low, and low-high clustering types. Moreover, there is a distinct east-west disparity, with higher patent quality observed in the eastern regions and lower patent quality in the western regions.
The implications of this study are significant for the comprehensive implementation of patent quality improvement initiatives and the overall enhancement of innovation capabilities in Chinese cities. Based on the main evaluation results, we propose the following policy recommendations: Firstly, the establishment of a regional financial coordination and development mechanism to enhance financial support for the central and western regions and expand support across all aspects. In this process, careful consideration should be given to economic, political, legal, social, and cultural factors. Secondly, it is crucial to adopt suitable approaches for enterprise technological innovation based on their unique circumstances and strive to maintain an optimal financial structure. Active efforts should be made to foster the growth of venture capital and leverage internet financial models to energize enterprises. Additionally, enterprises should seek financial support from capital markets and credit markets to facilitate industrial upgrading and structural adjustments, thereby strengthening China’s overall competitiveness and comprehensive capabilities.
While this paper focus on the evaluation and evolution pattern of China’ urban patents quality, there are limitations that presents several avenues for future research. Primarily, our findings are confined to Chinese cities and may not be generalizable to other regions with different economic, political, and legal frameworks. Additionally, the analysis extends only up to 2019, thus not accounting for the impacts of recent global developments such as the COVID-19 pandemic. Future studies could expand the temporal scope to include these recent events, which may show a different pattern after 2019. Furthermore, our research does not delve into the underlying factors behind the temporal and spatial variations in patent quality using rigorous empirical tools. Exploring these factors more deeply could provide valuable insights into the specific causes of these patterns, offering a richer understanding of the dynamics influencing patent quality across different regions.
Footnotes
Declaration of Conflicting Interests
The author(s) declared no potential conflicts of interest with respect to the research, authorship, and/or publication of this article.
Funding
The author(s) disclosed receipt of the following financial support for the research, authorship, and/or publication of this article: We acknowledge support from the National Natural Science Foundation of China (grant No. 71874138) and the Soft Science Research Project of Science and Technology Department of Shaanxi Province (2019KRM031).
Data Availability Statement
The data supporting this study is available from the corresponding author upon reseasonable request.