
Abstract
Taking 31 provinces as the research object, this paper constructed the input-output efficiency evaluation index system of public sports service in China. The paper evaluated the input-output efficiency level and spatial-temporal pattern of public sports services using the methods of data envelopment analysis and exploratory spatial data analysis. The results show that: (1) The average comprehensive super-efficiency value of public sports service in 2016 was higher than that in 2008, and the provinces with the comprehensive super-efficiency value greater than 1 increased, but the difference between provinces in 2016 was more obvious. (2) Compared with 2008, the efficiency distribution of public sports service in 2016 is more balanced among the three regions, the difference between the eastern region and the central region is reduced. (3) The efficiency of public sports service has different spatial correlation in the geographical spatial distribution, and this correlation shows the reverse in the two measurements.
Introduction
In the report of the 19th National Congress of the Communist Party of China, General Secretary Xi Jinping proposed to extensively carry out national fitness activities, accelerate the promotion of the construction of sports powers, and once again emphasized the dual important role of mass sports in people’s lives and nation building. As early as 2014, the State Council issued the “Several Opinions on Accelerating the Development of Sports Industry and Promoting the Consumption of Sports,” which has raised the national fitness to a national strategy. And then the promulgation of the “National Fitness Program (2016–2020)” provided specific guidance for the implementation of the National Fitness National Strategy and the improvement of the physical fitness and health of the whole nation. At the same time, the document put forward a construction goal of perfecting public sports service system to promote the equalization of basic public sports services. At present, many scholars have made scientific evaluations on the efficiency of public sports services, but there are still some shortcomings, mainly in three aspects: the first one is to ignore the equalization perspective to talk about the efficiency of public sports services; the second one is to use the DEA-CCR model. It cannot be explained that the low overall efficiency is caused by pure technical efficiency or scale efficiency, and it is impossible to distinguish the true efficiency value of the region when the efficiency is 1 so that the degree of difference between the efficiency of regions cannot be accurately analyzed; the third one is the current research are rarely used the theory of spatial association, and there is a lack of overall evaluation of the spatial relationship of public sports service efficiency across the country. The above shortcomings lead to a lack of guidance on the allocation of government public sports service resources, resulting in uneven and wasteful distribution of resources and inefficient services.
During the 13th 5-year plan for China’s national economic and social development, the contradiction between the growing diversity of the people, the demand for multi-level sports and the insufficient effective supply of sports is still outstanding. The reasons are mainly shown in two aspects: one is that the public sports service investment is insufficient, especially the basic public sports service needs of people have not been well met. Second, public sports service only pays attention to input, does not pay attention to output, and lacks supervision and evaluation on the efficiency of public sports service. At present, the disadvantages of unreasonable allocation of public sports service resources, low efficiency of resource allocation and imperfect evaluation system are outstanding. Therefore, in order to provide the ability and level of public sports service supply, we should pay attention not only to the efficiency of public sports service, but also to the theoretical research and the accumulation of practical experience in improving the efficiency of public sports service.
Based on the above reasons, this study will measure the level of input and output efficiency of public sports service resources in 31 provinces (Not including Tibet, Hong Kong, Macau, and Taiwan due to the lack of data) in China in 2016 by building a fixed-scale compensation-based DEA model (CCR model), a variable-reward DEA model (BCC model), and a super-efficiency model (SE-DEA model). After that, the exploratory spatial data analysis method (ESDA) will be used to analyze the spatial differentiation characteristics of public sports service efficiency in 2016. Compared with the efficiency of public sports services in 2008, the paper will also explore the characteristics of the spatial and temporal differentiation of public sports service efficiency in China.
Literature Review
The evaluation of the input and output efficiency of sports public services is a comprehensive statistical evaluation activity. First, it is necessary to construct an indicator system. In the research related to this research, Yuan (2014) calculated the efficiency of China’s sports public service from 2008 to 2011 by the method of data envelopment analysis, and found that the average efficiency level of sports public services keep improving. Shao (2014) established the DEA model of the mass investment efficiency of mass sports, and calculated the financial input efficiency of mass sports in 30 provinces by the same method. The analysis results show that the efficiency of public sports investment in different regions is obviously different. You et al. (2016) analyzed the input and output benefits of mass sports in 29 provinces in China used the DEA model, and the benefits in various provinces and cities was low and the difference was obvious. In addition, Li and Guo (2017) also conducted an empirical study on the efficiency of free and low-cost opening to large stadiums in China. At the same time, some scholars also conducted research on the efficiency of sports public services for specific regions, provinces, and cities. Zheng et al. (2015) evaluated the technical efficiency of China’s provincial sports public services. It was found that during the period of 1998 to 2013, the technical efficiency level of China’s sports public services showed a downward trend, and there were significant differences among regions. The eastern region has the highest technical efficiency, followed by the central region, and the western region. Gong and Liu (2016) analyzed the differences in the supply efficiency of sports public goods in 11 provinces and cities in the eastern region applied data envelopment analysis. Similarly, Wang et al. (2016) evaluate the supply efficiency of sports public goods in 21 cities in Guangdong Province used the DEA-Tobit model, and explored the influencing factors of supply efficiency. Using CCR, BBC, and SE-DEA model of data envelopment analysis, Meng et al. (2016) selected 22 name brand events held in Beijing in 2012 as samples and preliminarily measured and evaluated the relative efficiency of governmental resources before conducting a comparative analysis of input efficiency between key and general name brand events. Taking eight cities in Chengdu Plain urban agglomeration as examples, Li and Liu (2017) evaluated the efficiency of public sports service through data envelopment analysis. The results showed that public sports service efficiency in Chengdu plain urban agglomeration is not high, there being problems of input redundancy and insufficient output and all the cities failing to carry out public sports service construction under the optimal scale income model.
Objectives of the Study
Exploring the input-output efficiency of public sports service resources based on the DEA model, to determine the inefficient factors of insufficient output through the analysis of the internal operational efficiency of public sports service systems.
To analyze the spatial pattern and agglomeration state of the input and output efficiency of public sports service resources based on the perspective of geography.
This has a strong reference and guiding significance for the rational scientific allocation of government public sports service resources in the future.
Methods
Data Envelope Analysis
Data envelopment analysis is a nonparametric system analysis method that uses mathematical models to evaluate the relative efficiency of decision-making units (DMU). On the basis of selecting multiple input and output indicators, there is no need to consider the dimension of different unit indicators. Therefore, although the efficiency indicators are different, data envelopment analysis can still avoid subjective factor interference and single factor of evaluation factors (Li et al., 2016). As early as 2014, Zheng et al. (2014) reviewed the application of data envelopment analysis in the field of sports at home and abroad. At present, the DEA model is more and more widely used in evaluating the allocation efficiency of sports public goods and service resources (Liu, 2017; Man, 2018; Zhang & Wang, 2017), competitive sports resource allocation and training benefit evaluation (Zhang et al., 2018) and sports industry operational efficiency evaluation (Li, 2017).
Exploratory Spatial Data Analysis
Exploratory spatial data analysis is a spatial data analysis method that identifies whether some variables are spatially related and agglomerated. If a variable appears to be agglomerated in space, it means that this variable has autocorrelation between all geographic units within a certain area. That is to say, the value of the variable of a certain geographical unit is higher, and the variable of the surrounding area unit is also higher; otherwise, the value of the variable of the surrounding geographical unit is lower. Exploratory spatial data analysis includes global autocorrelation and local autocorrelation (Wei et al., 2017).
Global spatial autocorrelation analysis
The global autocorrelation is mainly used to describe the degree of association between spatial objects in the entire study area, and to determine whether a certain element or phenomenon in the entire study area has agglomeration characteristics in the space. In spatial statistical analysis, global autocorrelation analysis is mainly measured by global spatial autocorrelation statistic (such as Moran’s I, Geary’s C, and General G). The Moran’s I statistic is a very widely used spatial autocorrelation statistic. The global Moran index reflects the correlation between regional units and neighboring regional units throughout the study area, and indicates the distribution patterns of regional variable values, including aggregated, discrete, or random distribution patterns. Its value range is [−1,1], −1 means that the variable value is completely negatively correlated in space; 1 is said to be completely positive correlation; when the value is 0, it shows unrelated random distribution state; when Moran’s I is positive, it means that there is a positive correlation, similar observations (high or low values) tend to spatially aggregate. When Moran’s I is negative, it indicates that there is a negative correlation, and similar observations tend to be distributed, that is, different attribute values tend to be clustered together. The larger the absolute value of Moran’s I, the stronger the spatial distribution correlation.
Local spatial autocorrelation analysis
The local spatial autocorrelation is used to reflect the degree of correlation between a certain geographical phenomenon or a certain attribute value on a local small area unit and the same phenomenon or attribute value in the adjacent local small area unit in the whole large area, which can effectively detect Spatial differences caused by spatial autocorrelation, spatial hotspots or high-incidence regions that determine the value of spatial object attributes, etc., make up for the shortcomings of global spatial autocorrelation analysis. Local spatial autocorrelation can be performed by the local spatial correlation index LISA, the most widely used of which is the local Moran’s I. A positive value of Moran’s I indicates that a high value is surrounded by a high value (high-high), or a low value is surrounded by a low value (low-low). A negative value of Moran’s I indicates that a low value is surrounded by a high value (low-high), or a high value is surrounded by a low value (high-low).
Index System Construction
Based on the index system constructed by the existing relevant research results, combined with the purpose of measuring the efficiency of input and output of public sports services systematically and structurally, following the principles of science, comparability, comprehensiveness and operability, considering the feasibility of data acquisition, according to the relevant indicators on the 2017 China Statistical Yearbook and the Sports Statistics Yearbook, the paper establishes the DEA evaluation index system based on the basic public sports service factors such as manpower, financial resources and material resources, and selects four input indicators and three output indicators (Table 1).
List of Input-Output Indicators of Sports Public Service.

Estimation of Input and Output Efficiency of Public Sports Service Resources Based on DEA Model
The raw data of input and output of public sports service resources in 2016 shows that the eastern, central and western regions have great differences in resource input and output. In the eastern region, the investment in financial allocation for per capita sports and financial investment in per capita public sports services is significantly higher than that in the central and western regions. Although the western region has the lowest two inputs, the per capita public sports service financial input is close to the average, and it has the highest proportion of public sports service practitioners in sports practitioners. In the same state as the input, there are also differences in the output of public sports service resources. In the area of public sports facilities and per capita public sports land per 10,000 people, the output of the western region is still at a disadvantage, and the difference from the mean is large. However, the regional differences presented by this raw data do not really reflect the efficiency value of effective use of resources under existing conditions. Therefore, in order to objectively evaluate the input and output of sports resources in various regions, the value of resource input and output efficiency should also be estimated.
Analysis of CCR Model of Public Sports Service Resources
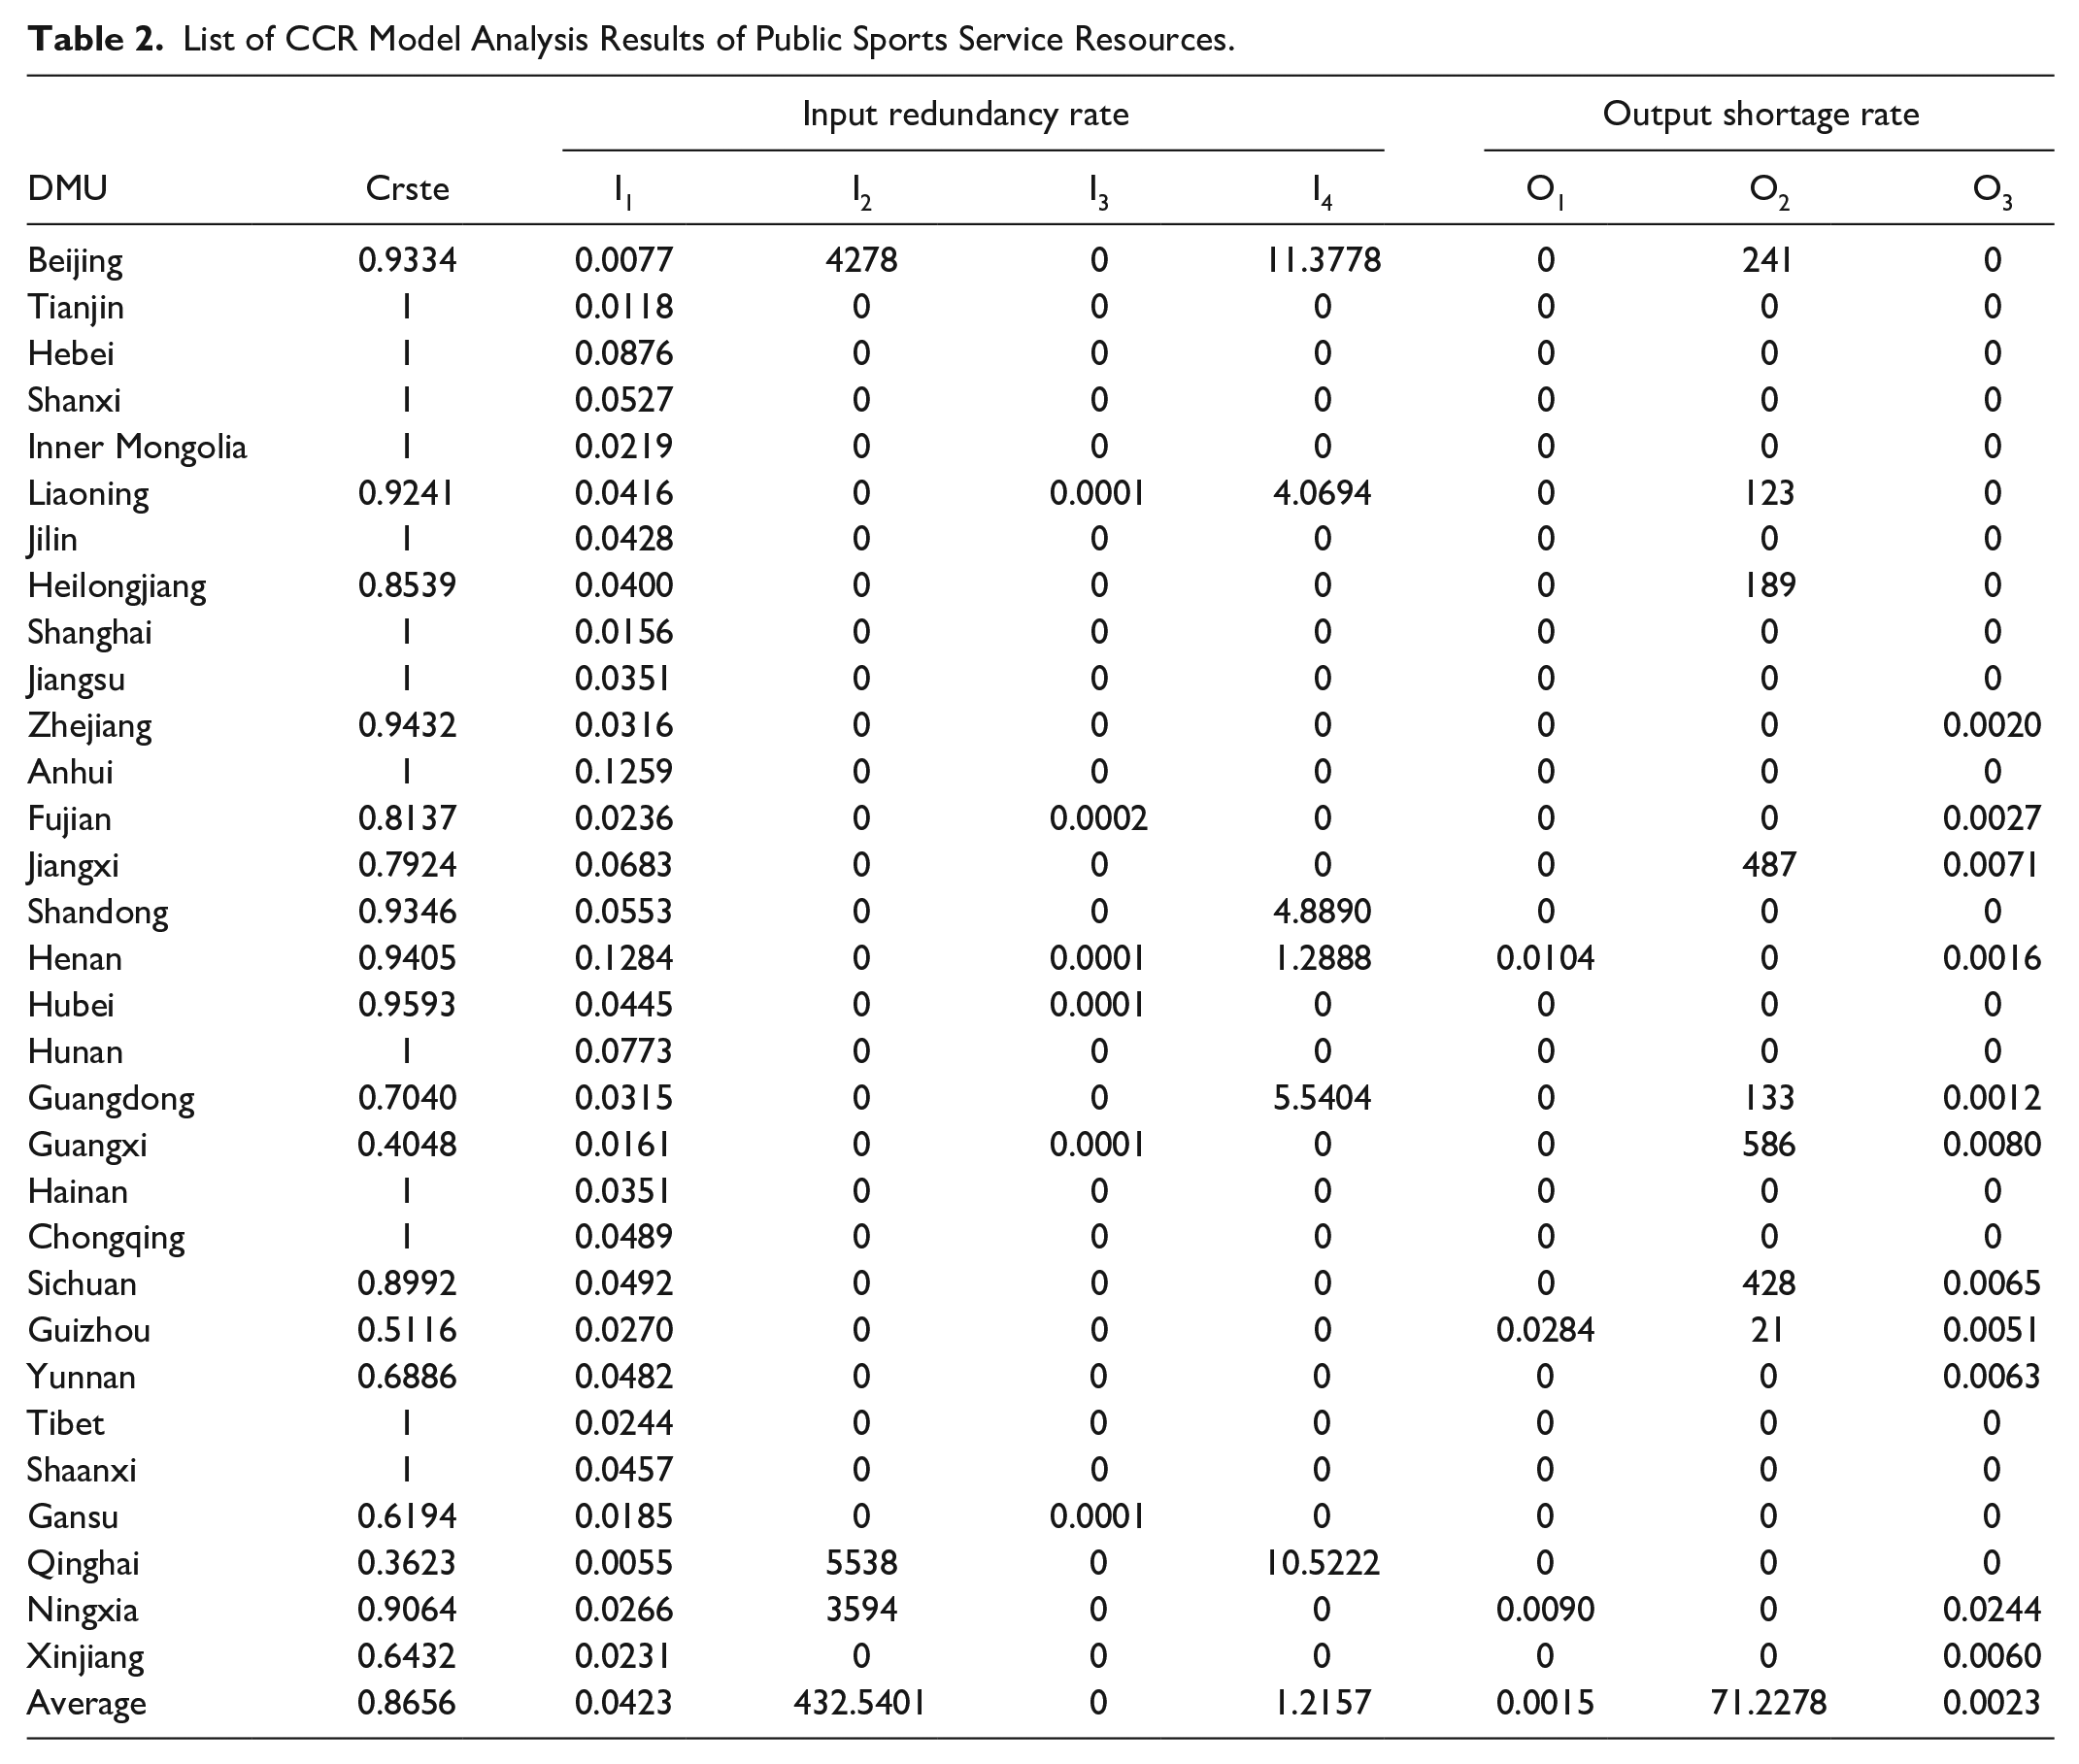
A CCR model based on fixed-scale compensation was constructed to estimate the redundancy rate, output shortage rate and comprehensive efficiency values of public sports service resources in 31 provinces (Table 2).
List of CCR Model Analysis Results of Public Sports Service Resources.
Comprehensive efficiency analysis
The result shows that the comprehensive efficiency of the input and output of public sports service resources in China is effective in 13 regions including Tianjin, Hebei, Shanxi, Inner Mongolia, Jilin, Shanghai, Jiangsu, Anhui, Hunan, Hainan, Chongqing, Tibet, and Shaanxi. The efficiency of public sports service resources in each region has reached one and is at the forefront of production, while the resources of other provinces are in an inefficient state. The average efficiency of public sports service resources input is 0.8656, which indicates that China’s public sports service resources input efficiency is good. But compared with DEA effective provinces and cities, DEA non-effective provinces and cities can only achieve 86.56% of output under the same input. The average national comprehensive efficiency is higher than some scholars’ analysis of the efficiency of China’s sports public service in 2008, which is also higher than the analysis results of the comprehensive efficiency of China’s 2012 to 2013 mass sports input and output. In addition to effective decision-making units, the overall efficiency values of 10 in Qinghai, Guangxi, Guizhou, Gansu, Xinjiang, Yunnan, Guangdong, Jiangxi, Fujian, and Heilongjiang are lower than the mean, indicating that the overall efficiency value of most decision-making units is reached in the mean. The standard deviation of the overall efficiency value is 0.1829, indicating that the overall efficiency difference between regions is not large.
Analysis of input redundancy and output insufficiency
The redundancy rate and output shortage rate of public sports service resources can present non-effective decision-making units, and can also show the degree of non-effectiveness and improvement at the level of efficiency evaluation indicators. The result shows that there are input redundancy and insufficient output in 18 provinces and cities, and the redundancy rate is significantly higher than the output shortage rate, except for 13 provinces and cities with comprehensive efficiency. In terms of resource input, the redundant rate of Per capita financial allocation of sports is 4.23%, and all 31 provinces and cities nationwide need to improve. The redundant rate of the proportion of public sports financial appropriation in total fiscal expenditure is 432, the redundant rate of Per capita public sports service financial input is 0.002%, the redundant rate of the proportion of public sports service practitioners in sports practitioners is 1.22, and the decision-making units requiring efficiency improvement were 3, 6, and 6 respectively. In terms of resource output, the shortage rate of the number of public sports facilities per 10,000 people, the per capita public sports land area, the annual opening rate of sports venues were 0.15%, 71.23, and 0.23% respectively, and the decision-making units requiring efficiency improvement were 3, 8, and 11 respectively.
It can be seen from the calculation results that the ratio of the redundancy ratio of the public expenditure of public sports in total fiscal expenditure and the output shortage rate of the per capita public sports land area are quite different from those of other indicators.
Analysis of BCC and SE-DEA Models of Public Sports Service Resources
A BCC model based on variable scale returns is constructed to estimate the pure technical efficiency, scale efficiency and comprehensive super efficiency of the input and output of public sports service resources in 31 provinces (Table 3).
BCC and SE-DEA Model Analysis Results of Public Sports Service Resources.
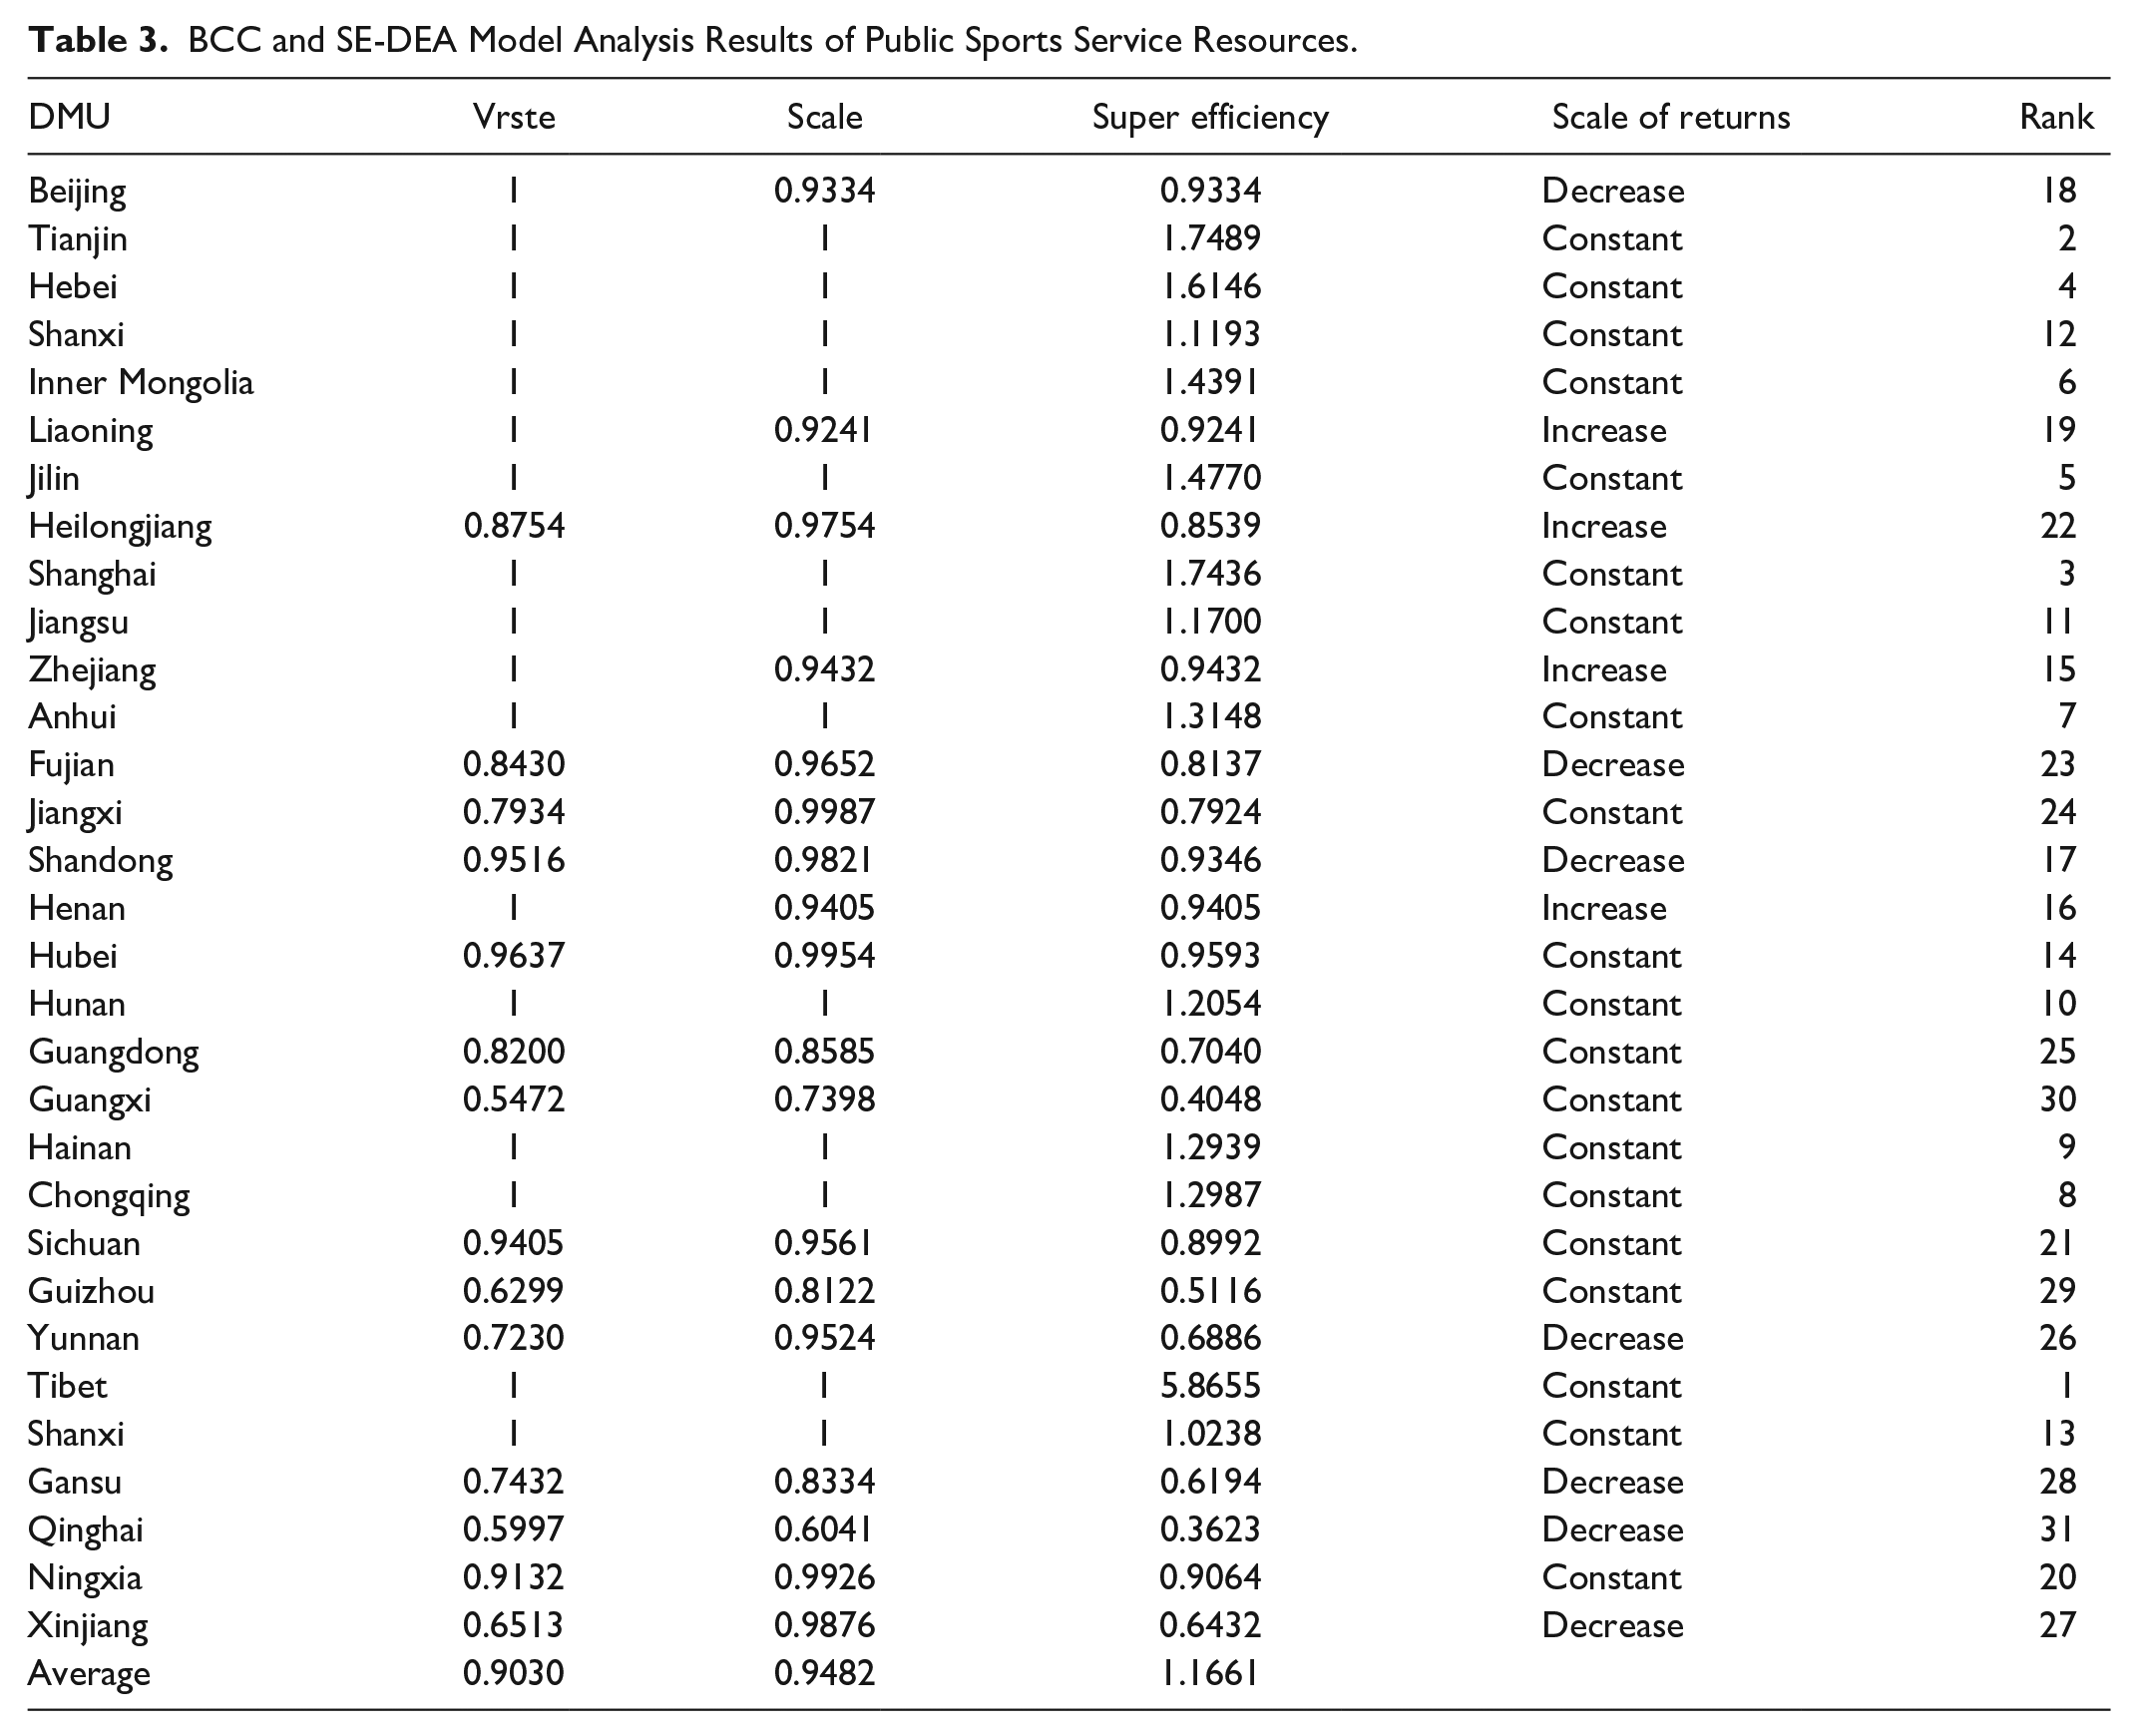
Pure technical efficiency is the measure of the maximum output capacity brought by the smallest factor input under the same scale, reflecting the level of integration and utilization of resource efficiency. The result shows that the average technical efficiency of public sports service resources is 0.903, and the provinces and cities with pure technical efficiency values of 1 have 17 provinces and cities such as Beijing, Tianjin and Hebei. Except for provinces and cities with pure technical efficiency values of 1, only Ningxia, Sichuan, Shandong, and Hubei are higher than the national average. Scale efficiency refers to the ratio of the optimal output at the production frontier with variable and constant returns to scale, reflecting the level of concentration of resources input and output. The average scale efficiency value of public sports service resources is 0.9482. Tianjin, Hebei, Shanxi, Inner Mongolia, Shanghai, Jiangsu, Jilin, Anhui, Hunan, Hainan, Chongqing, Tibet, and Shaanxi have achieved scale, but 58.1% of provinces and cities have not achieved optimal scale efficiency. Consistent with the relevant research results, there is no coordination between the supply and demand structure of public sports service resources, and the efficiency of resource input-output system is low. According to the comprehensive super efficiency value of each province and city, the overall input and output efficiency is ranked. The top 10 provinces and cities are Tibet, Tianjin, Shanghai, Hebei, Jilin, Inner Mongolia, Anhui, Chongqing, Hainan, Hunan. The standard deviation of the super efficiency value is 0.928, and there is a big difference in the comprehensive super efficiency level of resource input and output between provinces.
The scale of returns can be divided into constant, increasing and decreasing. If the return to scale does not change and the input changes, the output will increase or decrease in the same proportion, also known as the reasonable scale. If the scale of return is in the rising stage, when the input increases, the proportion of output increase is greater than the proportion of input increase. Similarly, if the scale of returns is in a decreasing phase, the rate of decline in output is greater than the rate of decline in input.
In terms of the scale of public sports service resources, 20 provinces are in the stage of constant returns to scale, and three provinces are in the stage of increasing scale returns. For these three provinces, the scale of input and output of public sports service resources restricts the improvement of efficiency. Henan, Liaoning and Heilongjiang should increase their material and manpower input to achieve high efficiency. Conversely, the eight provinces that are in the stage of decreasing scale returns are not likely to increase their investment, because even if resources are continuously increased, the increase in output efficiency will not be obvious.
Exploratory Spatial Data Analysis of Public Sports Service Efficiency
Temporal and Spatial Evolution Characteristics of Public Sports Service Efficiency
In order to examine the changes in the efficiency of public sports services, Table 4 lists the results of comprehensive super-efficiency measurement of public sports services in 31 provinces in 2008 and 2016. In terms of average value, the average comprehensive super-efficiency value of public sports services in 2016 was higher than that in 2008, and the number of provinces with comprehensive super-efficiency value greater than 1 increased from 9 in 2008 to 13 in 2016, but the comprehensive super-efficiency value in 2016 was more discrete. This shows that the phenomenon of high efficiency and inefficient polarization between provinces is more serious.
Calculation Results of Comprehensive Super Efficiency of Public Sports Service in 2008 and 2016.

The provincial distribution map of public sports service efficiency shows that the efficiency of public sports services in 2008 was roughly the highest in the central region, followed by the eastern region and the western region. Compared with 2008, China’s public sports service efficiency distribution in 2016 is more balanced among the three regions, and the difference between the eastern region and the central region is reduced. Although the efficiency of Tibet in the west is the highest in the year, Inner Mongolia is also in the forefront, but the internal differences in the west are obvious.
Spatial Autocorrelation Analysis of Public Sports Service Efficiency
Lobal autocorrelation analysis of public sports service efficiency
Exploratory spatial data analysis method is used to detect the spatial dependence of public sports service efficiency, and reveal the specific characteristics of its spatial distribution. Using ArcGIS10.2 and OpenGeoda1.2.0 software, Moran’s I index was selected for analysis. The result shows that the Global Moran’s I index of public sports service efficiency was 0.145179 (p < .05) in 2008 and −0.132781 (p < .05) in 2016. It shows that there is a significant spatial positive correlation in the efficiency of public sports services in 2008, showing spatial agglomeration between similar values (high-high or low-low), and provinces with higher efficiency tend to be relatively adjacent to provinces with higher efficiency, provinces with lower efficiency tend to cluster with provinces with lower efficiency. However, there is a significant spatial negative correlation between the efficiency of public sports services in 2016, showing spatial agglomeration between different values (high-low or low-high), and provinces with higher efficiency tend to be relatively adjacent to provinces with lower efficiency, provinces with lower efficiency tend to cluster with provinces with higher efficiency.
Analysis of local autocorrelation of public sports service efficiency
Although the global spatial autocorrelation analysis can reflect the concentration of public sports service efficiency in the provincial space, it does not quantify the agglomeration and agglomeration types of each agglomeration area, and the local spatial autocorrelation analysis can make up for this (Wei & Lei, 2013). Local spatial autocorrelation analysis mainly measures the degree of local spatial correlation and spatial difference between each region and surrounding areas. Combined with the relevant map forms, we can visualize the spatial structure of local differences and discover the spatial distribution law of the region (Wu & Yang, 2010).
To measure the local spatial relationship, degree of difference and spatial pattern of each province and neighboring neighbors, OpenGeoda1.2.0 software was applied for spatial statistical analysis. The LISA scatter plots and aggregate maps of 2008 and 2016 show that efficiency of public sports service created a low-low concentration area centered on Xinjiang in space in 2008, and generated a high-low concentration center centered on Tibet and Hunan, and a low-low concentration area centered on Guangxi in 2016. According to Moran’s I index, Moran scatter plot and LISA agglomeration graph, the efficiency of public sports services is not randomly distributed in geospatial space, but there are different degrees of spatial correlation, and this correlation shows the opposite in the two measurements.
Conclusion
Based on the need of scientific and comprehensive evaluation of the efficiency of public sports service, drawing on previous research results, selecting per capita financial allocation of sports, proportion of public sports financial appropriation in total fiscal expenditure, per capita public sports service financial input and proportion of public sports service practitioners in sports practitioners as the input index, and number of public sports facilities per 10,000 people, per capita public sports land area and annual opening rate of sports venues as the input index, the paper constructed a input-output efficiency evaluation index system of public sports service. Using the data envelopment analysis method, the paper also measured and analyzed the input-output efficiency of sports service resources in 2016 by CCR model, BCC model and SE-DEA model. Then, the spatial pattern of input-output efficiency level of public sports service in 2008 and 2016 was compared by exploratory spatial data analysis method, and the spatial-temporal differentiation and evolution characteristics of public sports service efficiency were explored. The research shows that: (1) The average comprehensive super efficiency value of public sports services in 2016 is higher than that in 2008. The provinces with the comprehensive super efficiency value greater than 1 have increased, but the comprehensive super efficiency value in 2016 is more discrete. (2) The efficiency of public sports service was roughly the highest in the central region, followed by the eastern region, and the lowest in the western region in 2008. Compared with 2008, the distribution of public sports service efficiency among China’s three major regions is more balanced in 2016. The difference between the eastern region and the central region is less, but the difference within the region is obvious. (3) China’s public sports service efficiency generated a low-low cluster with Xinjiang as the center in 2008. It generated a high-low cluster with Tibet and Hunan as the center, and a low-low cluster with Guangxi as the center in 2016. The efficiency of public sports service has different degrees of spatial correlation in the geographic spatial distribution, and this correlation is opposite in the two calculations.
As stated in the National Fitness Plan (2016–2020), the local governments should strengthen the organization and leadership of the national fitness program, establish and improve the organization and coordination mechanism for the implementation, form a mutually reinforcing development pattern, so that the people can share the results of the national fitness program. At the same time, the government should innovate the supply mode of public sports service, encourage social forces to participate in the market, and work together to solve the new contradiction between the people’s growing needs for a better life and unbalanced and insufficient development. Each province should scientifically and reasonably control the scale of investment. We will improve the budget system for financial expenditure on public sports services. At the same time, we should improve the government public sports service fund management mechanism to avoid the low efficiency of financial expenditure. In view of the diffusion of technical efficiency of public sports services, all provinces should strengthen communication and learning. So as to realize technology integration and improve technical efficiency.
Footnotes
Declaration of Conflicting Interests
The author(s) declared no potential conflicts of interest with respect to the research, authorship, and/or publication of this article.
Funding
The author(s) received no financial support for the research, authorship, and/or publication of this article.