
Abstract
Financial inclusion (FI) could create vast sums of revenue in the African economy, generating numerous chances and difficulties for countries. As the population becomes more financially included, their income rises over time, increasing government tax contributions. This paper investigates whether tax revenue changes are related to the evolution of financial inclusion (FI) in Africa. The paper employed panel microdata from 36 African countries from 2011 to 2017. The data was sourced from the Global Findex database. The paper uses Fixed Effects (FE) and Generalized Method of Moment (GMM) strategies. The empirical results indicate that the relationship between financial inclusion (FI) and tax revenue is significant and positive, proving that more access to financial services defined by credit card ownership (% age 15+) increases government tax revenue. The result using different tax proxies and other FI proxies is robust. The paper also unearths that mobile money, an alternative for FI, decreases tax revenue. Governments should prioritize policies that promote access to basic banking services, such as savings and checking accounts and consider providing tax incentives for mobile money operators who facilitate transactions that contribute to formal economic activity.
Plain language summary
This paper investigates whether tax revenue changes are related to the evolution of financial inclusion (FI) in Africa. The paper employed panel microdata from 36 African countries from 2011 to 2017. The data was sourced from the Global Findex database. The paper uses Fixed Effects (FE) and Generalized Method of Moment (GMM) strategies. The empirical results indicate that the relationship between financial inclusion (FI) and tax revenue is significant and positive, proving that more access to financial services defined by credit card ownership (% age 15+) increases government tax revenue. The result using different tax proxies and other FI proxies is robust. The paper also unearths that mobile money, an alternative for FI, decreases tax revenue. Governments should prioritize policies that promote access to basic banking services, such as savings and checking accounts and consider providing tax incentives for mobile money operators who facilitate transactions that contribute to formal economic activity.
Introduction
Until the mid-1980s, indirect financing dominated the financial sector, favoring bank balance sheet intermediation. This organization is increasingly changing due to several economic reforms that encourage the creation of a financial market system or direct finance. The theory did not involve banks and credit institutions since the agents participated decisively in the transition of savings to investment and economic development. The theoretical demonstration of financial intermediation was made at the end of the fifties. The pioneering works of (Gurley & Shaw, 1955; Smith, 1955) argue about the increased financial intermediation in the economy. The theoretical demonstration of financial intermediation was made at the end of the fifties by studying an economy of financial markets.
Financial intermediation always raises questions about its contribution to the economic development of countries (Umijah, 2022). In Africa, financing is a significant issue and a significant challenge. The last two decades have been marked by numerous development initiatives to boost growth and improve the financial system to limit poverty. According to Saab (2018), the agents’ level of FI (FI), the relationship between financial intermediation and people’s well-being is established.
Also, according to the quality of the institutions (G. W. Beck et al., 2016). Thus, FI or inclusive finance constitutes an essential lever for the development of expanding economies because it makes it possible to increase agents’ income, reduce poverty and create jobs (Park & Mercado, 2015; Pearce, 2011).
Financial inclusion (FI) refers to the state in which businesses and individuals access vital and accessible economic goods and services that meet their needs, transactions, payments, deposits, savings, borrowings, and insurance. Administered reliably and sustainably is one of the main policy instruments to improve healthcare, decrease poverty and promote macroeconomic stability (Hanning & Jansen, 2010; Park & Mercado, 2015). For Demirguc-Kunt and Klapper (2012), FI enables all individuals’ participation in financial services by providing local financial products/services to all layers of society, especially those excluded from traditional financial services. Financial inclusion (FI) concerns groups of individuals with difficulties using and accessing a bank account, payment methods, credit, and savings products. Financial inclusion (FI) is also an economic situation in which individuals and businesses can access essential financial services (Amidžic et al., 2014). Sarma (2008) emphasizes that FI is a method that ensures the accessibility, availability, and use of affordable financial services for all members of an economy.
In addition to access and use of financial services, a more expansive definition considers other dimensions, including performance and range, utility and suitability, accessibility, competitiveness and understanding of financial services and goods, as well as customer security, rendering FI a multifaceted term (Espinosa-Vega et al., 2020; Jahan et al., 2019).
Since 2011, about 1.2 billion adults have been financially included globally. However, nearly 1.7 billion people have been financially excluded. In view of this huge number of exclusion, the World Bank has committed to assisting individuals to achieve access to financial services and engage in the formal economy by 2020 (UFA2020 Overview). Interestingly, no consistent data sets were available until 2011 to help us understand people’s financial lives worldwide. All this has been modified with the Global FI website’s release, known as the Global Findex. This new database also allowed much academic research on FI. There are 1.2 billion adults who have opened an account since 2011. Five hundred fifteen million between 2014 and 2017, according to the Global Findex website.
By comparison, in the Africa region as a whole, 23% of adults possess a financial account. However, there is significant disparity in account ownership across the continent. Specifically, within Sub-Saharan Africa, 24% of adults report having an account with a formal financial institution. This percentage varies substantially, with Southern Africa having the highest account ownership at 51%, whereas Central Africa has the lowest at 11%. For instance, in the Democratic Republic of Congo and the Central African Republic, over 95% of adults are without a bank account, categorizing them as unbanked. In North Africa, 20% of adults have an account with a formal financial institution, with Morocco leading at 39% and Egypt at the lowest with 10%.
Access to financial services has significantly increased in African countries in recent decades. Many financial services have now been offered to individuals and companies, particularly credit. New technology, like mobile money, savings, and transaction services, have also helped expand access to financial services. However, lately, little was understood about the financial sector’s penetration in Africa and elsewhere, the extent of FI, and the extensiveness to which vulnerable citizens, such as the poor, women, and young people, remain excluded from formal financial structures. To provide more excellent financial connectivity in Africa, technical advancements such as mobile money, creativity, and the development of alternative distribution platforms, including mobile branches or banking services by third-party agents, have begun to play an important role. Mobile money, for instance, has enjoyed the most considerable impact in Africa, where 14% of adults have started using mobile money in the past 12 months.
In Africa, the share of adults having financial accounts has improved considerably from 23% in 2011 to 43% in 2017. This rapid rise in financial inclusion (FI) could cause immense income to the African economy, opening up new opportunities and posing new problems for some countries. As the population gets more financially included and their earnings increase over time, their tax contributions to government income can increase. As the world grows in the direction of FI, policymakers must take the opportunity of this situation to improve their tax revenues (Cull et al., 2012; Huppert & Blackburn, 2012; Maherali, 2017; Park & Mercado, 2015; Sarma, 2008).
We concentrated on the percentage of individuals who claimed to have a debit card and the percentage of individuals who said they had borrowed money from a bank or another financial institution in the past 12 months. Figure 1 shows an upward trend in North and Sub-Saharan Africa, suggesting that FI is advancing. More precisely, the percentage of adult credit card owners increased from 0.3% to 24%, and the percentage of adults borrowing from the financial institution from 0.9% to 30% in North Africa from 2011 to 2017. Similarly, the adult credit card rate has increased from 15% to 20%. From 2011 to 2017, the percentage of adults borrowing from financial institutions increased from 14% to 17% in North Africa.

Financial inclusion over time.
Tax collection and regulation in developed and emerging countries are challenging to implement. Policymakers can explicitly raise taxes by considering tax revenue determinants. Several papers concentrate on multiple tax revenue determinants (Addison & Levin, 2012; Chaudhry & Munir, 2010).
Figure 2 indicates that the total tax-to-GDP ratio has risen dramatically from 1980 to 2018 in both North and Sub-Saharan Africa. The rises have been significantly marked since the late 1980s. Overall, in 2018, the average tax-to-GDP ratio for all African countries was 15.42%. The tax-to-GDP ratio refers to total tax revenue, including social security contributions, as a GDP percentage. In 2019, revenue Statistics in Africa, Africa, the average tax-to-GDP ratio was below the Latin America and the Caribbean (LAC) average of 22.8% and the OECD average of 34.2%. Tax-to-GDP ratio ranged from 5.7% in Nigeria to 31.5% in Seychelles in 2017, with nearly three-quarters of the countries falling between 11.0% and 22.0%. The tax-to-GDP ratio exceeded 22% in four countries (Morocco, Seychelles, South Africa, and Tunisia).

Trends in tax as a percentage of GDP in Africa from 1980 to 2018.
This paper aims to establish a new determinant of tax revenue as a financial inclusion (FI) that has rarely been evaluated in the literature, mainly using the Global Findex database. Our study aims to investigate the effect of FI on tax revenue in Africa. Whereas very little literature has talked about the link between FI and tax revenue, this paper, to the best of our knowledge after having reviewed the extant literature is the first to conduct such a study in Africa using the Global Findex database. This paper also contributes to the literature by extending the research on another FI tool, mobile money. The paper empirically shows that mobile money, an alternative to FI, decreases tax revenue in Africa.
Following research delved into how the accessibility of financial services influences the extent of tax revenue (Ahmad et al., 2020; Mpofu & Mhlanga, 2022; Silue, 2021) and investigated the effects of the recent mobile money excise duty within the mobile networks sector on the adoption of electronic money and the progression of financial inclusion through digital services across African nations. These researches discovered that the implementation of the tax results in higher user fees, which, in turn, positively influences the demand for physical cash. It is only when this demand for cash is present that mobile money reduces its demand. However, in contrast to the existing body of literature, our study is primarily centered on financial inclusion and mobile money indicators, rather than focusing on mobile money taxation. Notably, our research stands as the first to present compelling evidence of the connection between financial inclusion and tax revenue. Our contribution to the field is underpinned by the utilization of comparable tax revenue and financial inclusion indicators. Additionally, unlike the empirical methodology employed in previous studies, we have adopted a dynamic specification to accommodate the persistence in government tax revenue.
The empirical results indicate that the relationship between FI and tax revenue is significant and positive, proving that more access to financial services, defined by the percentage of adults’ credit card ownership, increases government tax revenue, including social contribution. The result uses different tax revenue proxies such as Tax revenue excluding social contribution, tax revenue excluding Grant excluding social contribution, and tax revenue excluding Grant excluding social contribution. Total resource tax revenue and other financial inclusion (FI) proxies, such as ATM (% with a financial institution account, age 15+) and borrowing from a financial institution (% age 15+), are robust. The paper also discovered that mobile money, an alternative for FI, decreases tax revenue.
The paper’s reminder is organized as follows: The literature review is summarized in Section 2—the data and methods in Section 3, and the conclusion in Section 4.
Literature Review
Financial inclusion also referred to as financial exclusion, is one of the principal policy instruments for improving healthcare, minimizing poverty, and improving macroeconomic stability (Han & Melecky, 2013; Kim, 2016). Various authors have talked about the relationship between FI and growth. Mohan (2006) has thoroughly examined the difficulties and challenges of financial inclusion (FI) for sustainable development. He has effectively tried to illustrate the variables that can help India achieve FI for economic growth. He finds that FI in India may help drive economic growth and contribute to financial progress.
Similarly, Park and Mercado (2015) investigate 37 developing Asian countries’ connection between financial inclusion (FI) and poverty. The study discovered that poverty is minimized by FI and leads to equity of wealth. In a similar vein, according to Cull et al. (2012), FI will make the individual and local business sectors wealthier, thereby leading to better macroeconomic stability. Hanning and Jansen (2010) discussed the correlation between financial stability and FI. Lenka and Sharma (2017) show FI’s meaningful and optimistic impact on India’s economic development. They illustrate that FI improves financial stability in the long and short-term cycles from a macroeconomic and financial stability perspective. They found that financial inclusion (FI) plays an essential role in this relationship and that higher FI is part of the positive impact of ICT on development. Morgan and Pontines (2014), Han and Melecky (2013) say that financial stability is improved by expanded FI.
Furthermore, a study conducted by Anthony-Orji et al. (2023) examined the influence of financial development and financial inclusion on the economic growth of Nigeria spanning the period from 1981 to 2019. Utilizing the classical linear regression modeling approach, the findings indicated that both financial development and financial inclusion exerted a substantial and positive influence on Nigeria’s economic growth. Same positive effect has been found in by Daud and Ahmad (2023) using 84 countries since the GFC period.
Similarly, in a study conducted by Ozili et al. (2023) the impact of financial inclusion on economic growth was explored, with a specific focus on religious and secular countries. The research revealed several significant findings. In secular countries, the contraction of bank branches was found to have a positive effect on economic growth. Conversely, in secular countries, economic growth was positively influenced by the expansion of bank branches in conjunction with increased internet usage. However, a high supply of ATMs combined with greater internet usage was associated with a decrease in economic growth in secular countries. The study identified that in religious countries experiencing a widening poverty gap, the expansion of bank branches significantly contributed to economic growth. This suggests that promoting financial inclusion through the expansion of bank branches is an effective strategy for fostering economic growth in impoverished religious countries. Additionally, the research highlighted the pivotal role of internet usage as a determinant of economic growth in secular countries.
There have been few research works investigating the connection between financial growth and tax revenue, but few papers concentrate on tax revenue of financial inclusion (FI). During the years 1990 to 2014, Nnyanzi et al. (2018) analyzed the relationship between financial development and tax revenue in East African nations. They find out a positive effect of financial development on tax revenue. Besides, Ajide and Bankefa (2017) study the impact of financial development on tax revenue in Nigeria from 1981 to 2014. They find that the stock market’s growth and banking development have had a significant and optimistic effect on tax revenue. Also, as a measure of financial inclusion (FI), they use the number of bank branches and find a significant and negative association. Again, Bayar and Karamelikli (2017), from 2006 to 2016, researched the relationship between financial development and tax revenue in Turkey. As an economic development driver, they use the growth of the banking sector and the stock market growth.
The results demonstrate a robust and non-linear association between financial development and tax revenue. The findings support the favorable impact on tax revenue of financial developments. Taha et al. (2013) explores the relationship between direct tax revenue and financial sector operation in Malaysia from 1980 to 2008. So far, Akçay et al. (2016) have examined the 2006 to 2014 relationship between financial development and tax income in Turkey. Financial development is split into two sections: banking and non-banking. They find that bank and non-bank financial growth produces direct long-term tax revenues while banks’ financial development generates direct short-term tax revenue. Over the years 1990 to 2008, Ilievski (2015) reflects on the connection between the financial market and tax revenues for 96 countries and validates that stock markets positively affect tax revenues. Finally, in Pakistan, from 1975 to 2014, Akram (2016) tried to address how financial sector operations alter tax revenue. He concludes that the financial sector will help raise tax revenue.
According to a review of the literature and the extent of our knowledge, few studies examine the association between FI and tax revenue by using the Global Findex. Maherali (2017) uses many global databases and establishes a framework for estimating governments’ tax revenue due to financial inclusion (FI) by 2020. He affirms that FI affects income tax revenue. In the same contest, using a sample of 137 countries between 2011 and 2017, Oz-Yalaman (2019) showed a strong and positive association between FI and tax revenues. Compaoré (2022) used financial inclusion (FI) proxies from IMF, FAS 2019, for 2004 to 2017, based on a survey of 63 developed countries. He found that better FI collected by the number of ATMs per 100,000 adults raises the tax-to-GDP ratio of state non-resources powered by household demand and business expansion. Al-Own and Bani-Khalid (2021) used 28 countries in Europe from 2011 to 2017. He found substantial evidence that FI is one of the predictors of tax income in Europe. The findings of the study suggest that FI has a benefit on tax revenue.
This research contributes to the current literature by addressing a critical gap in empirical studies examining the influence of FI on tax revenue. While previous studies employed world and Europe samples, no study has been undertaken in Africa. The research used a selection of African countries and seeks to fill this gap by empirically providing facts in Africa on how FI and mobile money affect tax revenue.
The knowledge gathered from this research can also help public entities gain an additional understanding of the relationship between FI programs and tax income, which can assist them in assessing the success of financial inclusion (FI).
Theoretical Framework and Hypothesis Development
Financial inclusion refers to the extent to which individuals and businesses have access to and use formal financial services, including savings accounts, credit facilities, and digital payment systems. Tax revenue represents the income generated by a government through various forms of taxation, including income tax, value-added tax (VAT), corporate tax, and others. Increased financial inclusion can lead to a greater proportion of economic activities being conducted within the formal economy. This includes businesses opening bank accounts and individuals using digital payment systems for transactions, which makes their financial activities more visible to tax authorities. When individuals and businesses have access to formal financial services, there may be an improvement in tax compliance. Formal financial institutions often have reporting requirements and may withhold taxes on behalf of their customers, reducing the opportunity for tax evasion. As more people and businesses become part of the formal financial system, the tax base can expand. This means a larger pool of potential taxpayers contributing to government revenues. Digital payment systems associated with financial inclusion can streamline the tax collection process. Governments can leverage technology to collect taxes more efficiently and reduce administrative costs.
We expect to see a positive effect of financial inclusion (FI) on tax revenue because FI makes people and small enterprises healthier and boosts small businesses, consolidating economic stability and growth. Household income increases over time as they become more financially included. FI is also a tool to reduce poverty (Oz-Yalaman, 2019). We expect to have a significant increase in diverse tax revenue such as corporate tax, income tax, trade tax, and other tax revenue due to the explosion of financial services and an increase of income because World Bank is plighted to assisting 1 billion people in accessing financial services and getting engaged in the formal economy by 2020 (Maherali, 2017).
Hypotheses: Financial inclusion (FI) boosts tax revenue in Africa
Data and Empirical Methodology
Data
The article utilizes panel data to assess the relationship between tax revenues and financial inclusion (FI). The data encompasses 36 African countries for which the data is available. The dataset is a panel with significant time gaps defined by the dependent variable’s data available for 2011, 2014, and 2017. Table 1 shows the definitions and sources of the data. The dependent variables are tax revenue proxies collected from the most updated ICTD/UNU-WIDER Government Revenue Dataset (now ICTD dataset). The dataset has many sources of cross-country government revenue data, such as the World Bank, OECD (the Organization for Economic Cooperation and Development), and the CEPAL (Comisión Económica para América Latina y el Caribe). Our key independent variables’ FI proxies come from the Global Findex dataset. The Global Findex dataset is the most detailed data collection on how individuals save, lend, make payments and handle risk. The database, launched with funds from the Bill & Melinda Gates Foundation, has been released every 3 years since 2011. The data are gathered in collaboration with Gallup, Inc. organization through globally representative interviews of more than 150,000 individuals. The database contains more than 140 countries. The database offers over 200 measures of account ownership, payments, deposits, savings, credit, and financial stability. Global Findex data are recorded for many financial inclusion (FI) measures by country, area, and income level. Indicators available for 2017, 2014, and 2011 are documented. The rest of the independent variables are collected from the World Bank’s World Development Indicators (WDI, 2020) except governance indicators collected, including the rule of law and regularity, which are collected from Worldwide Governance Indicators (WGI).
Sources and Definitions of Data.

Source. Author’s computation.
In Figure 3a and b, we provide the correlation between financial inclusion (FI) indicators such as the percentage of automated teller machine (ATM), the percentage of a mobile phone or the internet to make a payment, the percentage of borrowing any money from a bank or another type of financial institution, the percentage of respondents who report having a credit card and tax revenue including social contribution. It seems explicit that improved access to financial inclusion (FI) is related to increased mobilization of tax revenue, except for mobile phone transactions that decrease tax revenue due to the costly fee of transactions that make the individual preferred cash payment transaction.

Figures (a) to (d) exhibit the correlation between financial inclusion (FI) and tax revenue, including social contribution.
Summary Statistic
Table 2 below shows the summary statistics for all the variables. The average tax revenue including social contribution (% of GDP), tax Revenue excluding social contribution (% of GDP), tax Revenue excluding grants and including social contribution (% of GDP), tax Revenue ex grants and excluding social contribution (% of GDP) and total resource Tax revenue (% of GDP) are respectively 21.27%, 21.23%, 19.51%, 19.01%, 5.11%. The average tax revenue in Africa is lower than the world average. The world average tax revenues are 30.51%, 27.50%, 28.19%, 25.01%, and 5.64% for, respectively, tax revenue including social contribution (% of GDP), tax Revenue excluding social contribution (% of GDP), tax Revenue excluding grants, and including social contribution (% of GDP), tax Revenue excluding grants and excluding social contribution (% of GDP) and total resource Tax revenue (% of GDP). Overall, tax revenue in Africa needs to be improved. Check Appendix Table A2 for world tax revenue variables summary statistics.
Descriptive Statistics.

Source. Author’s computation.
As the main mode of withdrawing, the average ATM (percentage with a financial institution account, age 15+) in Africa is 35.85%, much lower than the world average of 45.80%. The average Credit card ownership (percentage age 15+) is 3.58% compared to the world average, which is 16.96%. Besides, the average of respondents who reported borrowing from a financial institution in the past 12 months and who reported using a mobile phone for the transaction via their financial institution account in the past 12 months is 5.86% and 20.47%. The world average for borrowing in a financial institution is 10.34%, suggesting low participation in individual informal borrowing. Using a mobile phone from transaction Africa shows a very high user on average compared to the World average (3.24%). That is because emerging countries are rapidly moving from conventional banking to digital banking and finance, making heavy use of mobile transactions. Check Appendix Table A1 for world financial inclusion variables summary statistics.
Empirical Methodology
Regression Equation
The baseline model utilized to study the relationship between tax revenue and financial inclusion (FI) using Fixed Effects estimation, as determined by the Hausman test (Table A6). The model has the following form:

Where
The vector
Openness measures the volume of trade, but its sign prediction is ambiguous. The openness may have a beneficial impact because an increase in trade rate increases economic development and thereby increases fiscal revenue (Agbeyegbe et al., 2006; Gnangnon & Brun, 2018; Tanzi, 1989). On the other hand, openness may have a detrimental impact because the rise in trade rate reduces import and export tax revenue (Castro & Camarillo, 2014; Le et al., 2016). The paper also introduces another element as a variable control in the model: FDI, which is the net inflow of foreign direct investment. Capital inflows are among the key determinants of emerging-market growth, as the growth rate leads to tax revenues. In the literature, the predicted sign of capital inflow may be beneficial and detrimental. Capital inflows may positively impact economic growth and can positively influence tax revenue. However, negative consequences can occur if countries introduce fiscal stimulus to encourage capital flow (Castro & Camarillo, 2014; Mahmood & Chaudhary, 2013). Inflation is used as a proxy for macroeconomic stability in the paper. The inflation rate rise could reduce the incomes of taxpayers. Therefore, the estimated effects on tax collections are negative (Ghura, 1998; Tanzi, 1989). Agriculture is projected to adversely impact tax revenue (Agbeyegbe et al., 2006; Chelliah et al., 1975). Sustainability countries have broad subsistence farming sectors, which are not producing taxable surpluses, which small farmers practice.
Moreover, this sector is commonly excluded from taxation as a subsistence food field (Agbeyegbe et al., 2006). Unlike agriculture, the industry may positively impact tax income (Castro & Camarillo, 2014; Gupta & Kundu, 2007). By regularity and the rule of law, we proxy the efficiency of institutions. Regularity and the rule of law should have favorable effects on tax revenues. Good economic and political structures should encourage adequate tax administrations that enable a more effective collection of tax revenues (Davoodi & Grigorian, 2007; Fenochietto & Pessino, 2013; Gordon & Li, 2009). A huge population represents a tax-collecting opportunity, and public investment, described by Gross fixed capital formation, is expected to increase growth (Benedek et al., 2012; Ebeke, 2011).
The study is conducted on a sample of 39 African countries (See Appendix Table A3) over 2011, 2014, and 2017, based on World Bank Findex data availability. Data on financial inclusion (FI) is extracted from the Findex Survey database, including four indicators of financial access. Those four indicators are the percentage of respondents who report usually obtaining cash from their account at an automated teller machine (ATM), the percentage of individuals who report obtaining any money from a bank or another sort of financial institution in the past 12 months, the percentage of individuals who report having a credit card and the percentage of individuals who report using a mobile phone or the internet for transactions. (See Appendix Table A4 and Table A5 for the number of observations of dependent, independent and control variables per country).
Estimation and Results
Main Results
In this part, we focus on the percentage of respondents who report having a credit card and tax revenue, including social contribution. Benchmark results are as follows. Table 3 shows the impact of credit card ownership on tax revenue, including social contribution. In column 1, we first included the development indicator GDP growth and the total population in log form, as growth is the main determinant of tax revenue. In column 2, we have added FDI, Trade openness, Inflation, and Agriculture. Progressively, we added Industry and Public investment in column 3 as the sectorial value-added composition. We included the quality of institution indications such as the rule of law and regularity. The results are not sensitive to the progressive inclusion of variables since the signs and significance level are consistent no matter the variables’ addition.
Effect of the Credit Card on Tax Revenue, Including Social Contribution.

Note. All standard errors in parentheses are Huber–White robust. Sample sizes differ because of missing observations. Standard errors are reported in brackets.
p < .01. **p < .05. *p < .1. Significant at 1%, 5%, and 10% levels, respectively.
Table 3 reports the Fixed Effect estimates. The positive association of credit card ownership and tax revenue, including social contribution, implies financial inclusion (FI) promotes tax revenue on the African continent. The findings are consistent with (Oz-Yalaman, 2019) conclusions and (Compaoré (2022) For the control variables, the results indicate that the level of development measured by GDP growth tends to be an important determinant of tax revenue, including social contribution in African countries, and is positively and significantly associated with FI. These results align with previous studies (Davoodi & Grigorian, 2007; Feger & Asafu-Adjaye, 2014; Fenochietto & Pessino, 2013). From column 4, foreign direct investment and inflation are negatively related to tax revenue. About 1% increase in FDI and inflation reduces tax revenue by 19% and 5%, respectively. The negative impact of FDI on tax revenue occurs when countries introduce fiscal stimulus to encourage capital flow (Castro & Camarillo, 2014; Mahmood & Chaudhary, 2013). The negative impact of inflation is that a rise in the inflation rate could reduce taxpayers’ incomes (Ghura, 1998; Tanzi, 1989). As expected, trade openness, industry, and public investment have positive and significant signs. The total population, the rule of law, and regularity get mixed signs and are not significantly connected to tax revenue.
Endogeneity Test
Since the tax revenue, including the social contribution ratio at time t, could rely on its previous value (Compaoré, 2022), the result obtained using fixed-effect estimation could be inconsistent and biased (Wooldridge, 2002). The popular Generalized Method of Moment (GMM) seems to be the proper estimator for dynamic panel data. The GMM estimator is suitable with “small-T, large-N” panels and allows for correcting possible endogeneity, simultaneous, and omitted factor bias problems. Specifically, our study focused on the system-GMM (two-step estimator) recommended by Blundell and Bond (1998). However, the validity of the GMM prediction is based on the key presumption that instruments are exogenous (Roodman, 2009). Therefore, to verify the instruments’ validity, we rely on Hansen and Sargan test for over-identifying constraints. Table 4 shows the results of two steps system GMM estimator. The outcome is similar compared to baseline results. Besides, the p-values of the Hansen and Sargan tests are recorded at the bottom of the table, and the validity of our econometric method is verified.
Effect of the Credit Card on Tax Revenue, Including Social Contribution Using GMM Estimation.
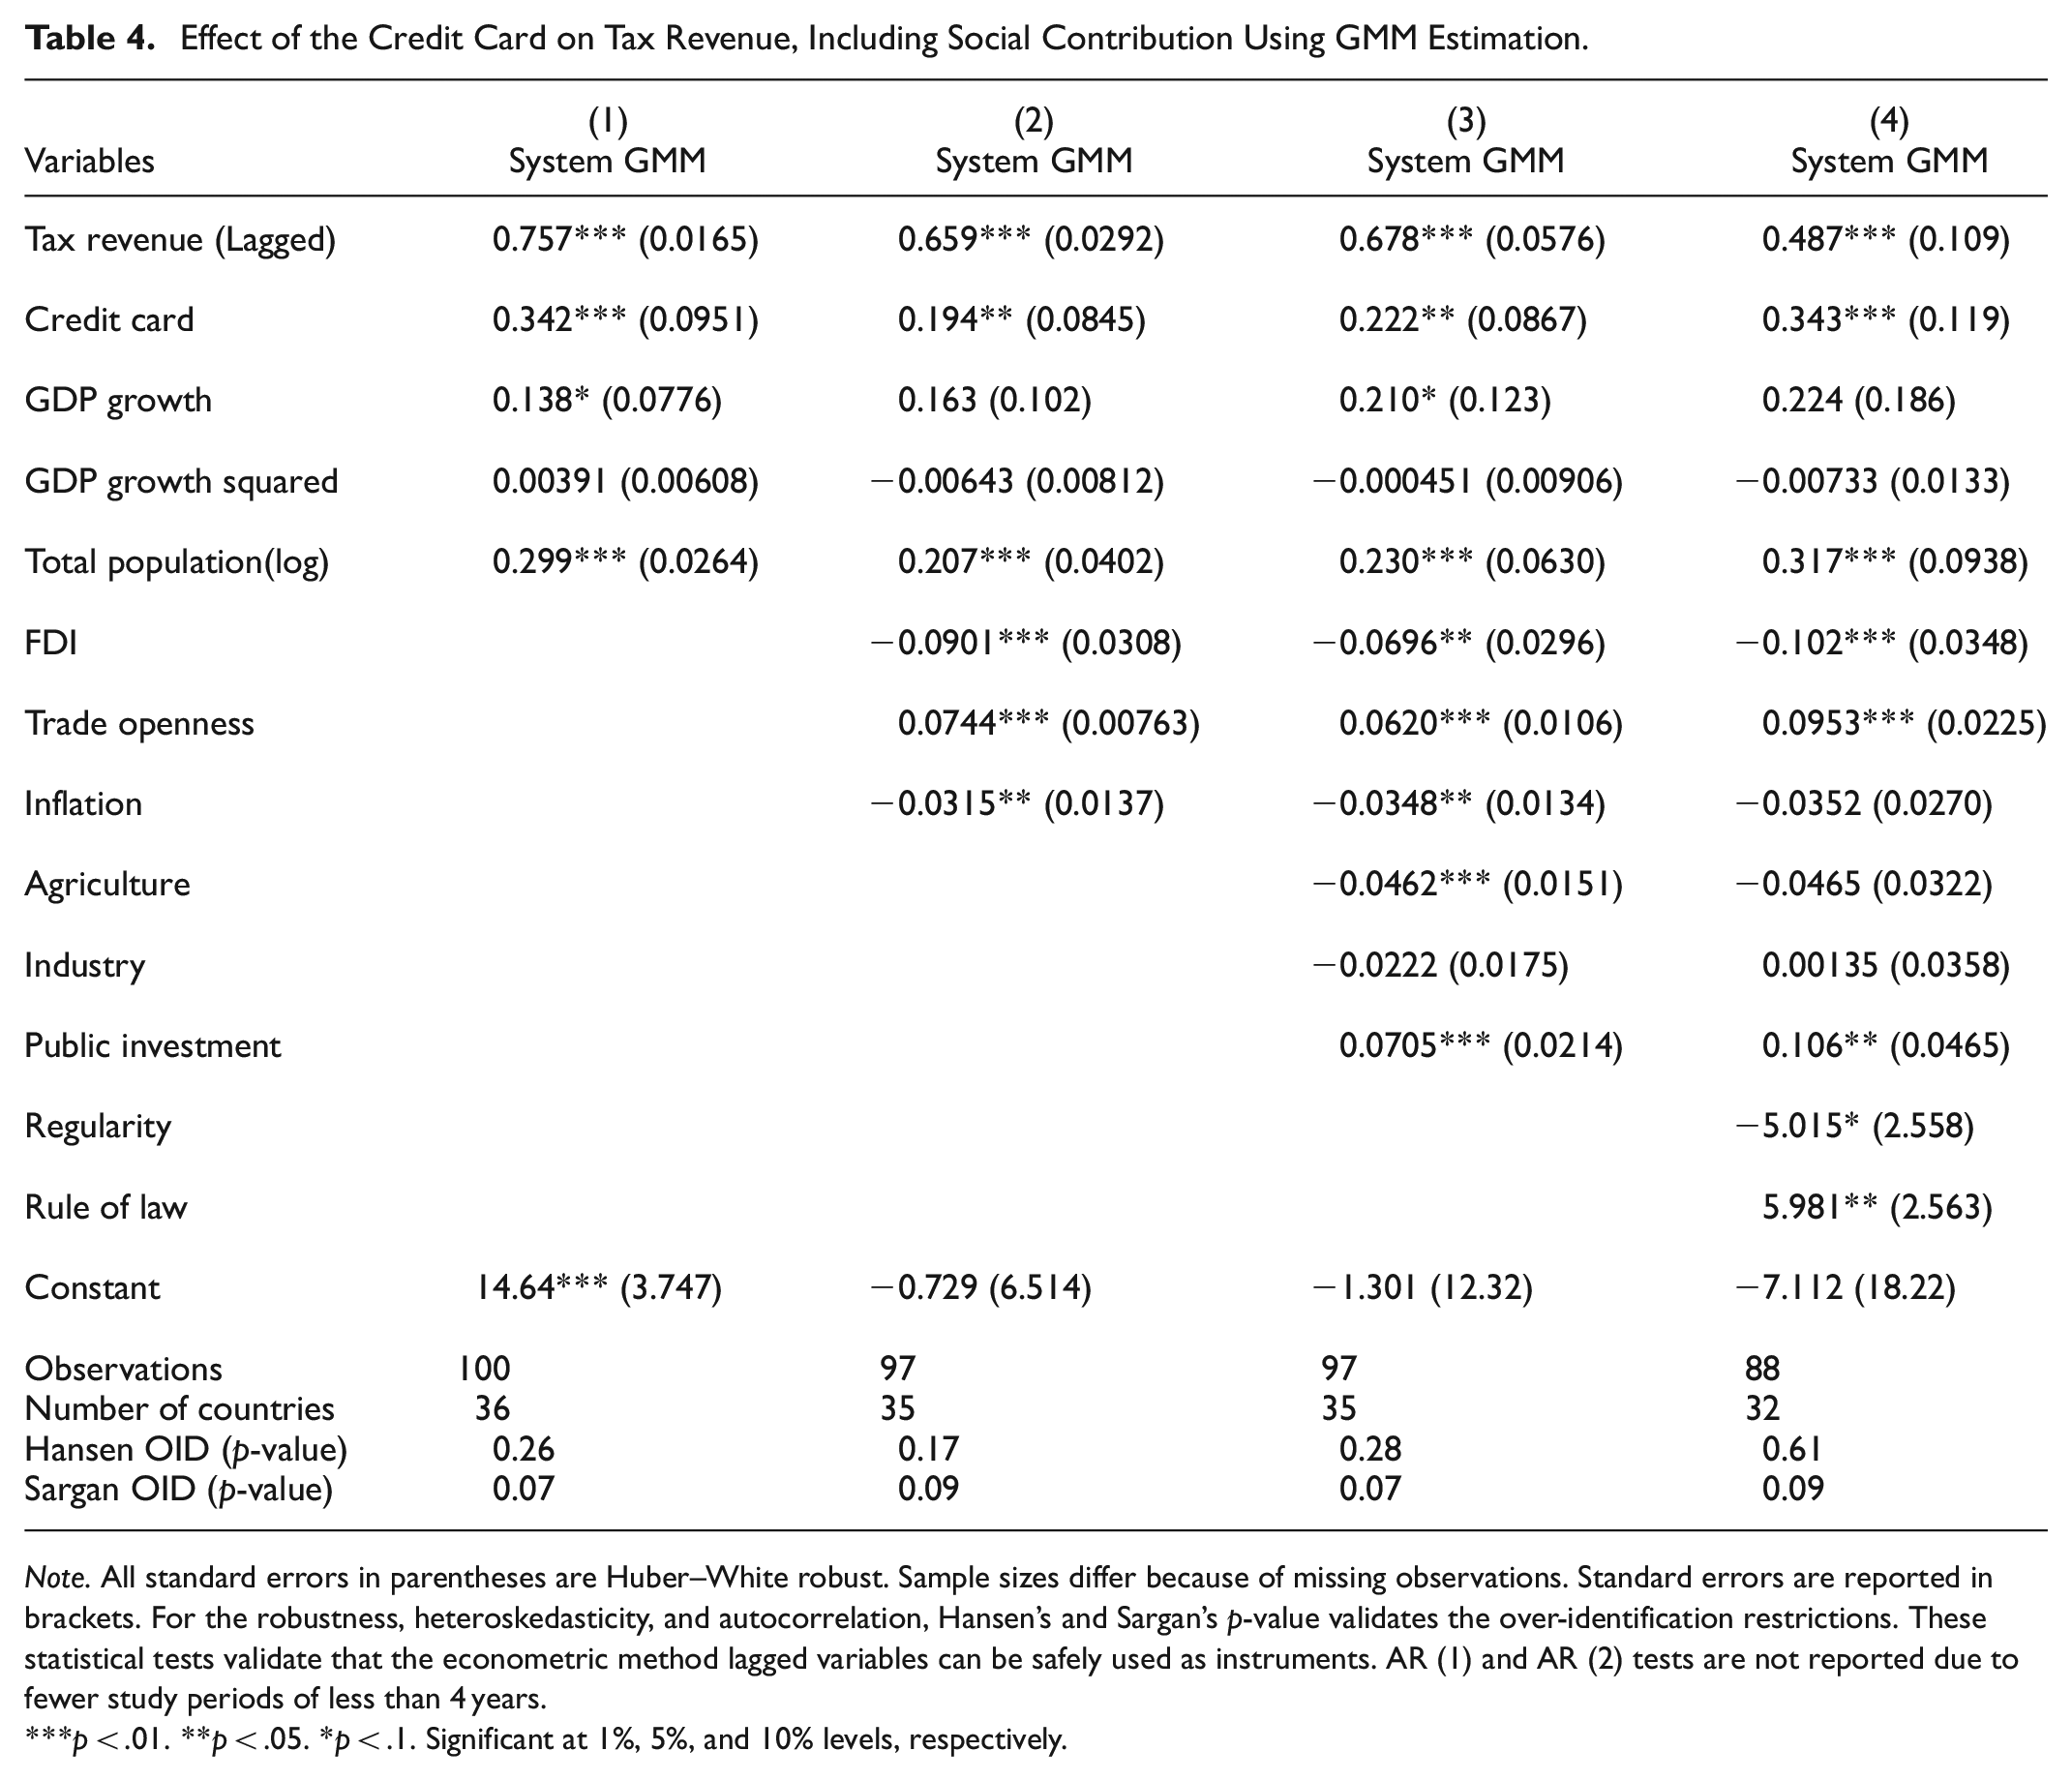
Note. All standard errors in parentheses are Huber–White robust. Sample sizes differ because of missing observations. Standard errors are reported in brackets. For the robustness, heteroskedasticity, and autocorrelation, Hansen’s and Sargan’s p-value validates the over-identification restrictions. These statistical tests validate that the econometric method lagged variables can be safely used as instruments. AR (1) and AR (2) tests are not reported due to fewer study periods of less than 4 years.
p < .01. **p < .05. *p < .1. Significant at 1%, 5%, and 10% levels, respectively.
Robustness Check
Robustness Check With Different Tax Revenue Proxies
In the section, we test the consistency of significance by using four new tax revenue measures such as total government revenue including taxes, non-tax revenue, and grants and excluding social contributions; tax revenue excluding grants and including social contribution; tax revenue excluding grants and excluding social contribution and total natural resource tax revenues. Table 5 presents the link between those 4-tax revenue proxies compared to baseline results in column 1. The results consistently confirm the positive relationship of FI (credit card ownership) with all tax proxies. Regarding the five new tax measures included, total natural resource tax revenues present a bigger coefficient, 76% of the increase.
Robustness Check with Five Tax Revenue Proxies.

Note. All standard errors in parentheses are Huber–White robust. Sample sizes differ because of missing observations. Standard errors are reported in brackets.
p < .01. **p < .05. *p < .1. Significant at 1%, 5%, and 10% levels, respectively.
The findings suggest that more access to financial inclusion (FI) allows for more total natural resource tax revenue collection, as Africa is rich in natural resources.
Robustness Check: Adding More Control Variable
In this section, the responsiveness of the baseline model’s findings to additional control variables is tested, including GDP per capita, net Official Development Assistant received per capita, Control of Corruption, Political stability, absence of violence, and Voice and accountability. GDP per capita is expected to increase tax revenue. Similarly, Control of Corruption, political stability, lack of violence, and voice and accountability are also expected to raise tax revenue. Net Official Development Assistant received as capital flows received could be positively or negatively associated with tax revenue.
Results in Table 6 are consistent with baseline results. The coefficients for the GDP per capita columns 3 and 3, Control of Corruption column 4, and Voice and accountability column 2 are positive and significant. Net Official Development Assistant received is negative and significant.
Robustness Check: Adding More Control Variable.
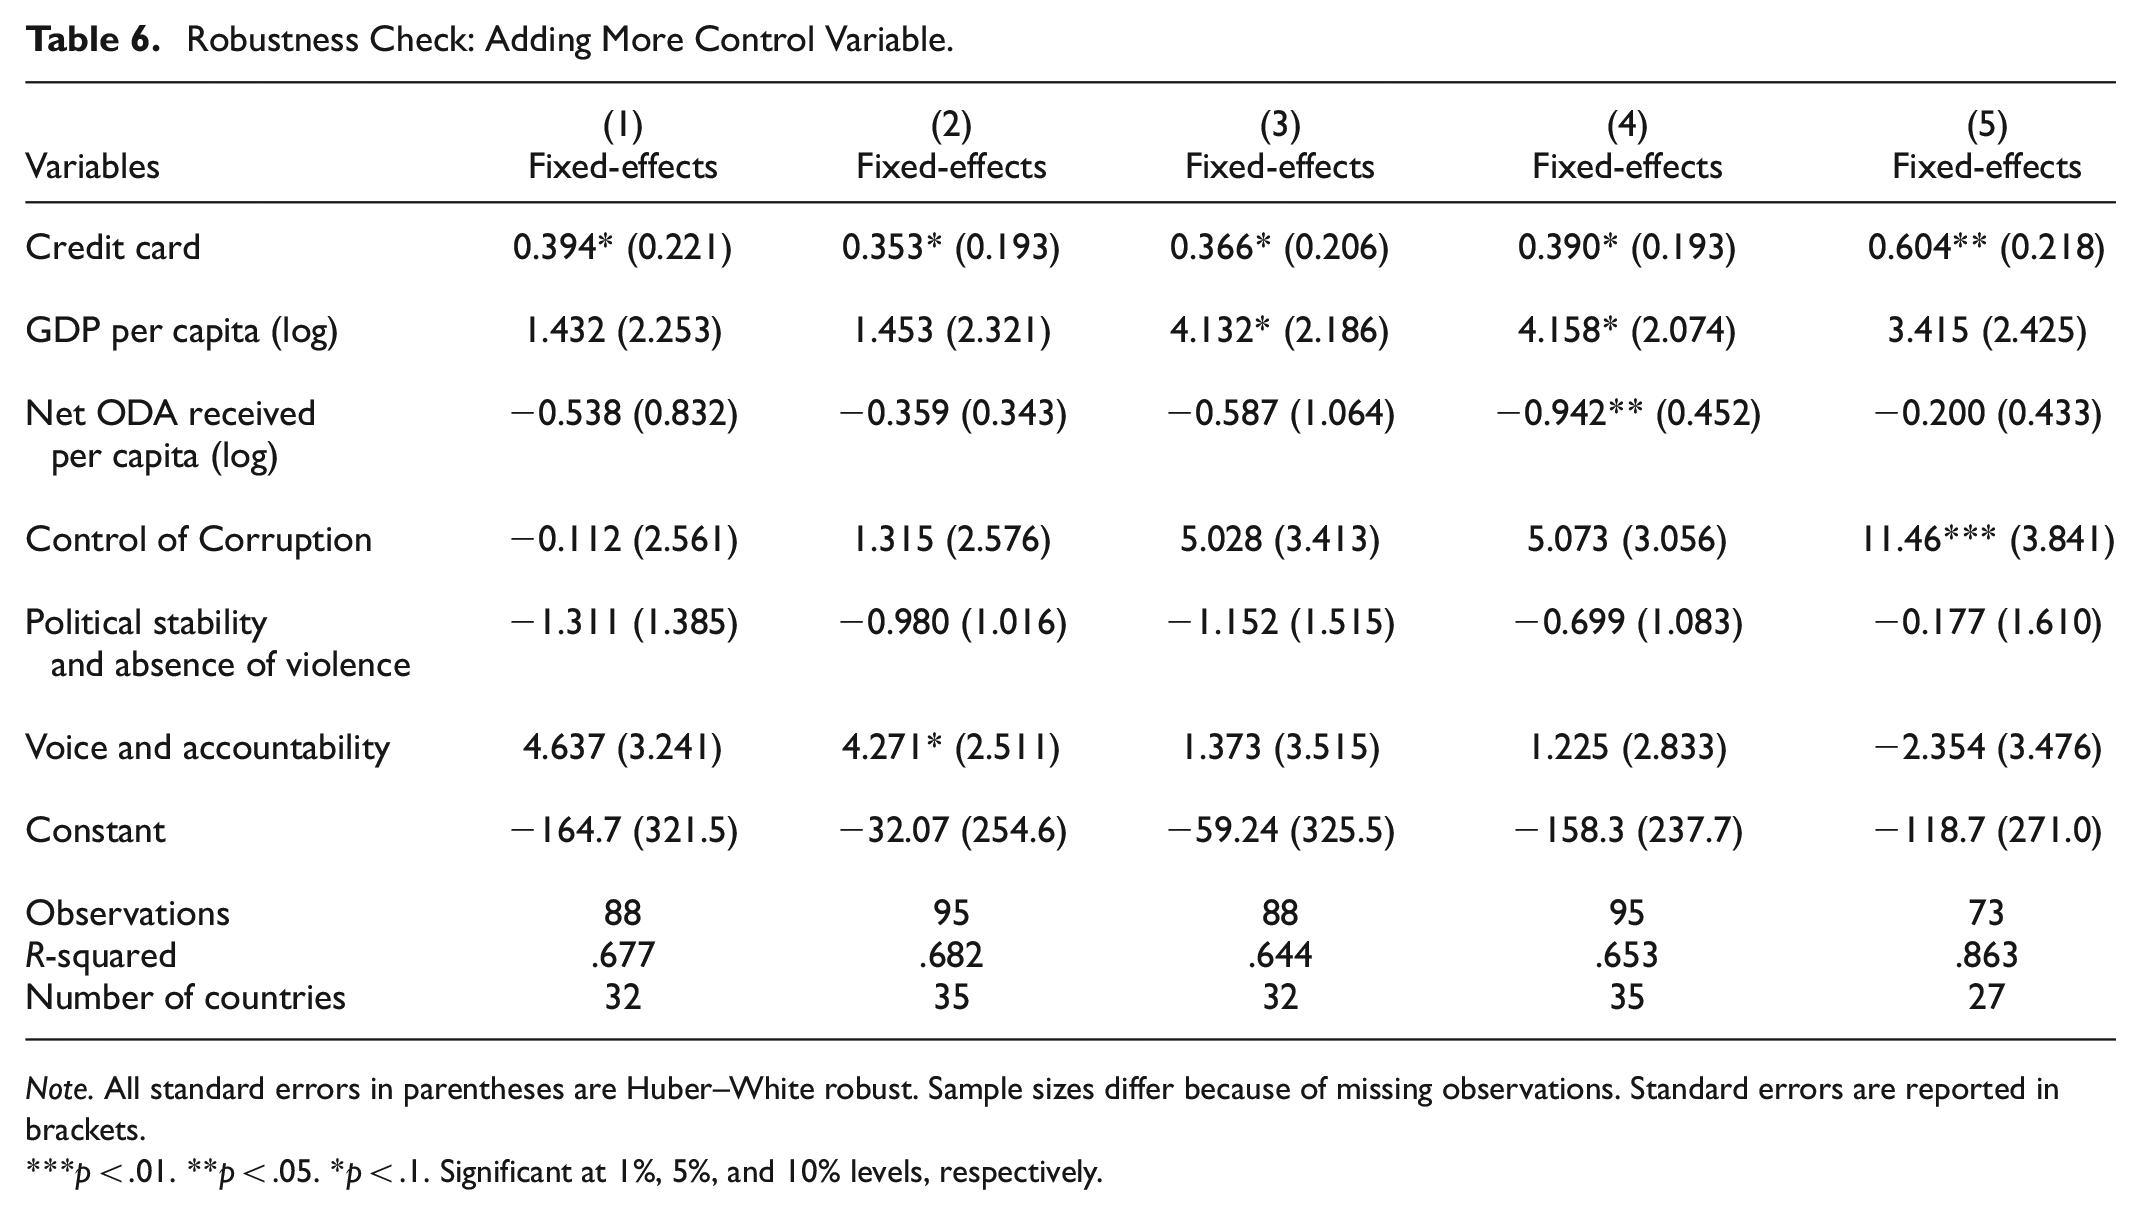
Note. All standard errors in parentheses are Huber–White robust. Sample sizes differ because of missing observations. Standard errors are reported in brackets.
p < .01. **p < .05. *p < .1. Significant at 1%, 5%, and 10% levels, respectively.
Robustness Check With Different Financial Inclusion (FI) Measures
In this part, we investigate the impact of three different financial inclusion (FI) measures, such as borrowing at a financial institution account and the percentage of using an automated teller machine (ATM). Table 7 shows that a 1% increase in ATM use increases tax revenue by 19%, and an increase in borrowing from a financial institution increases tax revenue by 45%. All those results are consistent with the baseline results.
Robustness Check with Different Financial Inclusion (FI) Measures.

Note. All standard errors in parentheses are Huber–White robust. Sample sizes differ because of missing observations. Standard errors are reported in brackets.
p < .01. **p < .05. *p < .1. Significant at 1%, 5%, and 10% levels, respectively.
An Alternative for a Formal Account: Mobile Money
Although people without accounts at a formal financial institution can risk their protection and reliability, they also use reasonably advanced approaches to handle their everyday finances and prepare for the future. A rising number of Africans are using new solutions to conventional banking, made possible by the quick spread of mobile phones. Recent mobile payment growth has made financial transactions reasonably safe and efficient for millions of people who are otherwise exempted from formal banking institutions. Mobile money in Africa has been the most competitive, with 16% of adults reporting using a mobile telephone (Findex). This increased emphasis on the mobilization of domestic revenues comes when developing nations’ tax-to-GDP levels are significantly behind those of developed countries. Further government income tension is due to falling commodity prices, rising debt, and the ongoing COVID-19 pandemic. Nevertheless, developing nations face major challenges in closing the gap while increasing domestic revenue, including the rise of informality, the growth of the digital economy, and low ability in tax administration tasks.
Mobile money has been one of many developed countries’ economic success stories over the past decade, especially in Africa. Mobile money accrued more than 1 billion registered accounts (Naghavi & Andersson-Manjang, 2019), including disadvantaged groups financially, which previously had neither the necessary identity documents nor adequate minimum funds to maintain a formal bank account. Nevertheless, this progress has seen mobile money catch the attention of tax administration officials trying to fix public expenditure deficits (See Appendix Figure A1 for mobile phone use map in Africa).
That has taken many types of sectorial taxation, from excise duty on service charges to sector taxes on gross income or underlying transaction taxes. African countries benefit from this latter transaction levy, but little is known about the effect of these taxes on mobile device taxation. While government revenue is supplementary, there could be a danger that the underserved communities that usually use the service may have a negative effect and potentially reverse financial inclusion (FI) advances to date, raise inequality, and undermine achieving development goals.
Mobile money now plays a key role in financial intermediation by allowing savings to be invested in the local economy, increasing businesses’ productivity, promoting job creation, and stimulating economic growth (Lopez, 2019). Mobile money is expected to be the payment backbone for many public services, including healthcare, education, and social security, as emerging countries converge on their digital development agendas.
How the digital economy can be taxed successfully is a global issue. Large social media multinationals (Google and Facebook from the US or Tencent and Alipay from China) frequently pay no tax in the countries where clients use their services, considering challenges in deciding the geographical position where digital transactions occur and the opportunity to transfer earnings and taxes to low-tax jurisdictions. These issues are amplified for developing countries with insufficient tax administration ability and without a clear voice.
This segment discusses the context and the effect of mobile money on taxation across Africa, where mobile money taxation has recently been imposed.
Table 8, surprisingly, shows a decrease in tax revenue due to mobile money. The decline in tax revenue might come from high mobile money transaction costs that people will prefer going back to hand-to-hand payments. The results follow Clifford (2020), who analyzed four African countries’ mobile money taxation theatrically. To Clifford (2020), the Government of Uganda introduced a law in May 2018 that imposed a 1% tax levy on the valuation of all mobile money transactions, including cash, transfer, and cash-out. The tax was launched in July and was unusual since the transaction tax on transferring or paying between individuals was unknown. The tax law revised in November 2018 was contentious, and public outcry saw the introduction of a 0.5% tax on the number of withdrawals only. In Congo, the tax was a 1% fee for all electronic transactions that flow through the HUB. In 2018, the Ivory Coast tax administration attempted to introduce a mobile money transaction tax of 0.5% that did not apply to banking. It was quickly forced to withdraw after public outrage. In July 2019, the Government of Malawi announced implementing a 1% withholding tax on all mobile money transfers as part of the budget statement for the following fiscal year, citing similar rules as inspiration in other nations.
Impact Mobile Money on Tax Revenue.

Notes: All standard errors in parentheses are Huber–White robust. Sample sizes differ because of missing observations. ***p < 0.01, *p < 0.1 Significant at 1, 5, and 10 percent levels, respectively. Standard errors are reported in brackets.
As a result, the management of mobile money transaction taxes generates an obstacle for MMPs, who must assess and collect the tax on behalf of the tax ministry. There is an additional difficulty for service users for whom remote digital purchases become more costly or out of control if they return to cash. It has been seen that badly structured mobile money taxes distort the market for mobile money services. In exchange, this has harmed total tax revenue and has impacted the accomplishment of national economic and growth goals.
Conclusion
A significant challenge for policymakers is the exploration of FI dynamics. Financial inclusion (FI) is the key tool for welfare improvement, poverty reduction, and stable macroeconomics. This paper analyzed the association between financial services and tax revenue in Africa. We rely on the Fixed effect and system-GMM estimator of Blundell and Bond (1998) for the possible endogeneity of financial inclusion (FI). To the best of our knowledge, following the literature review, this study is the first to take into account empirically different individual characteristics in FI investigation and mobile money, which is an alternative to financial inclusion (FI). Based on the panel microdata method of 36 African countries over the years 2011 to 2017 collected from the Global Findex, the empirical results indicate that the relationship between FI and tax revenue is significant and positive, proving that more access to financial services defined by the percentage of adults’ credit card ownership increases government tax revenue including social contribution. Financial inclusion initiatives, such as providing access to bank accounts and digital payment systems, can encourage individuals and businesses in the informal sector to formalize their financial activities. When they join the formal economy, they are more likely to report their income and engage in tax compliance. Access to formal financial services can reduce opportunities for tax evasion, such as underreporting income or engaging in cash-based transactions that are difficult for tax authorities to track. Governments can use digital financial platforms to disburse social benefits, subsidies, and tax refunds. This can ensure that funds reach the intended recipients, reduce leakage, and improve overall tax administration.
The result using different tax revenue proxies, including tax revenue exclude social contribution, tax revenue excludes Grant include social contribution, tax revenue excludes Grant exclude social contribution, total resource tax revenue, as well as other financial inclusion (FI) proxies such as ATM (% with a financial institution account, age 15+), borrow from a financial institution (% age 15+), is robust. The paper also discovered that mobile money (% age 15+), an alternative for financial inclusion (FI), decreases tax revenue. Mobile money can facilitate informal economic transactions that are difficult for tax authorities to track. In some cases, people might use mobile money to engage in off-the-books transactions, avoiding taxes altogether. Mobile money can be used for tax evasion purposes, such as underreporting income or conducting unrecorded cash transactions. This can erode tax revenues if not effectively monitored and regulated. As mobile money adoption grows, people may rely less on physical cash for transactions. Cash transactions can be easier for tax authorities to monitor and tax since they leave a paper trail. A shift to mobile money could reduce the visibility of transactions, potentially impacting tax collection.
Policymakers must consider how their citizens’ increased financial inclusion (FI) can influence their tax income.
Regarding policy recommendations, our research aligns with past findings and calls for expanded access to FI. Considering the urgent funding needs for structural financing investments in Africa, our paper gives insight into the possibilities of improved access to FI for countries that have started or are implementing financial inclusion (FI) policies regarding tax income.
In the current particular circumstance of the coronavirus (Covid-19) pandemic, which is causing serious economic frustration worldwide and requiring significant financial resources for adequate and accurate response, encrypting access to financial services will help better deal with income shocks and smooth domestic consumption.
Footnotes
Appendix
Hausman Test.

| Coefficients ____ | ||||
|---|---|---|---|---|
| (b) | (B) | (b − B) | sqrt(diag(V_b − V_B)) | |
| Fixed | Random | Difference | SE. | |
| Credit card | 0.4390008 | 0.464039 | −0.0250382 | 0.0908429 |
| GDP growth | 0.1314953 | 0.152742 - | 0.0212467 | 0.0801458 |
| GDP growth2 | −0.010215 | −0.026728 | 0.0165134 | 0.0073648 |
| Total population(log) | 1.060693 | −1.225885 | 2.286578 | 15.779470 |
| FDI | −0.186890 | −0.186374 | −0.000516 | 0.0125772 |
| openness | 0.0252297 | 0.099286 | −0.074056 | 0.0212479 |
| Inflation | −0.0491335 | −0.076316 | 0.027183 | 0.0290001 |
| Agriculture | 0.0237609 | −0.068764 | 0.092525 | 0.1522251 |
| Industry | 0.2495954 | 0.162502 | 0.087094 | 0.0848209 |
| Investment | 0.1928743 | 0.189057 | 0.003817 | 0.0133150 |
| Regularity | −1.562699 | −3.640442 | 2.077742 | 2.8343020 |
| Rule of law | 0.1487895 | 2.996444 | −2.847654 | 1.5845870 |
| b = consistent under Ho and Ha; obtained from xtreg | ||||
| B = | inconsistent under Ha, efficient under Ho; obtained from xtreg | |||
| Test: Ho: | The difference in coefficients is not systematic | |||
| chi2(14) = (b − B)′[(V_b − V_B)^(−1)](b − B) | ||||
| 46.9 | ||||
| Prob > chi2 = 0.0000 | ||||
| (V_b − V_B is not positive definite) | ||||
Declaration of Conflicting Interests
The author(s) declared no potential conflicts of interest with respect to the research, authorship, and/or publication of this article.
Funding
The author(s) received no financial support for the research, authorship, and/or publication of this article.
Data Availability Statement
Data sharing not applicable to this article as no datasets were generated or analyzed during the current study.