
Abstract
The objective of this study is to examine the impact of mobile money (m-money) adoption on some household outcomes such as farm output, welfare (consumption expenditure), and wealth (value of assets). Using primary data collected from three districts in Ghana, three Propensity Score Matching methods were employed to estimate the m-money adoption effect on the household outcomes. It is found that advertisements and higher than basic levels of education, among other variables, were important in influencing the adoption of m-money among smallholder farmers. The adoption of m-money was also seen to have an enhancing effect on the household outcome variables (farm output, welfare, and wealth) of smallholder farmers. The results suggest that mobile money can help enhance some of the smallholder economic outcomes that are relevant for rural development and poverty reduction. Policy options should consider expanding m-money services to smallholder farmers in rural areas.
Introduction
There has been some positive marginal growth in the formal banking sector (from 14.9% in February, 2018, to 15.2% in February, 2019) in Ghana in recent years (Bank of Ghana, 2019). However, the penetration rate of banking activities is still low. Adult account ownership increased from 29% in 2011 to 58% in 2017 (Demirgüç-Kunt et al., 2018), but financial inclusion in rural areas remained low, especially among rural farmers. This is mainly due to location disadvantage of financial institutions, low level of education for the rural farmers, lack of savings due to insecure income of the rural farmers, lack of collateral to qualify for loans, and other covariate and individual risks (Okello et al., 2010; Poulton et al., 2006).
In the Philippines, a study showed that without access to appropriate financial products and services, rural farmers may resort to loan sharks or money lenders and family and friends who might lend based on certain conditions (see Owens, 2007). Importantly, saving breaks the cycle of low agricultural investment and productivity (Batista & Vicente, 2017) that is typical of many rural farmers in Ghana. Providing conducive avenues for savings may be part of the solution to the developmental challenges that are faced by rural farmers. Some studies (Demirgüç-Kunt & Klapper, 2013; Dupas & Robinson, 2013) have shown that enhancing households’ access to financial services promotes efficient allocation of resources, increases productivity, enhances investment in education, enhances welfare, and contributes to financial resilience among households (Han & Melecky, 2013). Stakeholders and policymakers now have interest in the development of m-money, particularly in less developed and low-income countries, to resolve infrastructural gaps that hinder an all-inclusive financial system (Dermish et al., 2011).
Thanks to modern technology and telecommunications, financial transactions have been made accessible for the unbanked and the under-served rural farmers. Mobile phones and other digital media allow smallholder farmers, for example, to use financial services without going to a bank (Kirui et al., 2012a, 2012b). M-payments and m-money agent networks also make it possible to offer payments for inputs, household expenditures, sale of produce, and credit to rural farmers. Other things being equal, it stands to reason that the use of m-money has the potentials to increase productivity (see Dupas & Robinson, 2013) for rural farmers.
While this study tries to use m-money to confirm such potentials among rural smallholder farmers in Ghana, it acknowledges the endogenous nature of m-money adoption which has biased results from past studies (see, for example, Cobla & Osei-Assibey, 2018). This study analyses the impact of m-money adoption on smallholder farmers in some districts of Ghana. Specifically, the study seeks to (a) identify smallholder farmer characteristics that drive the adoption of m-money (b) and assess the impact of m-money adoption on output, consumption expenditure, and wealth (value of assets). To achieve these objectives, we test the hypothesis that m-money adoption does not significantly influence the output, consumption, and welfare of smallholder farmers. The next section looks at smallholder farmers and m-money in Ghana; the section “Related Literature” reviews related literature; the section “Methodology” focuses on the methodology whereas the section “Results and Discussions” presents and discusses the findings. The section “Conclusion and Policy Recommendations” concludes with some recommendations.
Smallholder Farmers and Mobile Money in Ghana
According to the Ministry of Food and Agriculture (MoFA; 2010), agriculture is dominated by smallholders who use simple farm tools. Also, farmers with farm size less than five acres constitute about 90%, even though there are some large farms and plantations, mostly for rubber, oil palm, cocoa, and coconut and to a lesser extent, rice, maize, and pineapples. Alternatively, Food and Agriculture Organization’s (2017) definition for smallholder farmers placed the threshold of their farm size at 3.64 hectares in 2013.
Smallholders generally possess small-scale plots of land and rely mostly on household labor for the cultivation of subsistence crops together with a single or two cash crops. Among the main features of smallholder farmers’ production systems include use of simple, obsolete technologies, low returns, high fluctuations in seasonal labor, and women occupying an important role in the production process (Peprah et al., 2016). Besides, smallholders vary in characteristics, the size of farm, resource distribution between food and cash crops, livestock and off-farm activities, the utilization of external inputs and hired labor, the share of food crops sold and household spending patterns (Peprah et al., 2016).
In Ghana, Asuming-Brempong et al. (2004) define smallholder farming based on the method of maintaining soil fertility and the level of technology. They determine such characteristics of farming systems as patterns of land use, capital inputs, yield, cultivation intensity, and the permanence and impermanence of rights in cultivation. This study adopts the MoFA’s definition for smallholder farmers as households cultivating less than five acres.
The use of mobile phones is not new to farmers in Ghana. In 2010, Ghana Cocoa Board introduced the CocoaLink (an outreach program) to provide mobile phone services to farmers. For two-way communication, the service uses voice and text messages through a dedicated short code on the mobile phone. It allows cocoa farmers to directly send text or photo inquiries for diagnostics to experts and to receive practical and timely agricultural and other information. The messaging platform of CocoaLink is complemented by weekly training sessions to equip farmers on mobile phone use, agronomy, and social issues, for example, child labor. Field officers and extension agents use CocoaLink registration app loaded onto smartphones to collect farmer information such as age, mobile number, farm size, average production, preferred language, and a photo.
In addition, farmers can also register independently via SMS. The advent of CocoaLink exposed farmers to the use of mobile phones which implies possible adoption of m-money. However, unlike the CocoaLink messaging platform, traditional m-money services provide the avenues for sending and receiving money as well as making payments. We adopt the definition by Gosavi (2018), which indicates that m-money is mobile phone-based financial tool that can transfer money safely and quickly across a wide geographical area. M-money is not designed for rural farmers but because they do not have access to traditional banking services, we believe that m-money could offer alternative means of banking services to rural farmers due to the locational disadvantage of the rural smallholder farmers.
Currently, three main telecommunication companies (MTN Ghana, Vodafone Ghana, and Tigo/Airtel) provide m-money services in Ghana with MTN being the market leader with the widest network coverage. M-money in Ghana has enjoyed a boost with the passage of the Electronic-Money Issuers and Agents Guidelines since July 2015 to replace the Branchless Banking Guidelines, 2008. A research by the World Cocoa Foundation (WCF; 2014) reveals that there is 80% m-money awareness among the cocoa farmers surveyed. Of this figure, 52% of the farmers have m-money wallets, and 28% have experienced using m-money services. WCF (2018) reports that less than 50% of farmers use m-money for financial transactions. Also, 67% of farmers are receptive to m-money payments and are willing to use m-money to purchase farm inputs (WCF, 2018). The two studies reveal that between 2014 and 2018 m-money usage increased among farmers which is an indication that m-money may produce potential benefits for rural farmers.
Related Literature
One of the transmission mechanisms deemed relevant in some studies is how m-money reduces economic shocks. For instance, higher remittances received from relatives and friends (Jack & Suri, 2014; Munyegera & Matsumoto, 2016; Suri et al., 2012) has been proven to support such families and thus enhanced their welfare. Even though such remittances from family members working in urban areas and abroad for purposes of family support are regular and often small, the costs of transfers also vary depending on the amount sent, the instruments used, and the destination (World Bank, 2016). Remittances are often a more dependable source of income than self-employed activities for the rural poor (Jack et al., 2013). According to Suri et al. (2012), money sent or received through mobile phones reduces the impact of negative economic shocks, thus providing a form of insurance for recipients. Thus, m-money impacts welfare through reduced transaction costs. Transaction is reduced because instead of traveling a longer distance to receive or send money through a bank, users can do that within a few meters in their neighborhood. The travel time is also part of the cost that is saved. Thus, time saved and transportation expenses that are avoided could be used for something else.
In a study in Kenya, Kikulwe et al. (2014) show that rural farmers who use m-money are more likely to apply fertilizers and pesticides, hire labor, and market a larger proportion of their output especially when ordering and delivering goods and services, and the payment can be done via the use of mobile services. Such conditions are particularly relevant in high-value agricultural markets that often involve contractual ties between buyers and sellers through m-money services (Rao & Qaim, 2011; Reardon et al., 2012).
The use of mobile phones and m-money allows farmers to negotiate with buyers of their products. For instance, smallholders may often sell their produce to local traders immediately after harvest, without any further storage or processing, because they need the cash to pay for urgent consumption needs or outstanding bills (Fafchamps & Hill, 2005). Because negotiations and payments are done via mobile phone and m-money, farmers are relieved of the burden of travel time and transportation expenses. According to Chiputwa et al. (2015), coffee growers in Uganda, sometimes decide to sell their coffee to middlemen when it is still at the flowering stage in the field. Many farmers sell the red coffee cherries right after harvest or after drying, even though more money can usually be earned when selling as shelled green beans. They contend that the use of m-money allows farmers to sell a larger proportion of their products before they are harvested through mobile phone arrangement. Also, the authors continue to argue that the use of m-money allows farmers to pre-negotiate higher prices for their products because of the convenience in communication.
Thus far, it is important to note that m-money effect on farm output and welfare passes through some channels including reduced cost of buying farming inputs, convenience in selling farm produce, opportunity to purchase input on credit via m-money, avoiding travel time to access banking services among others. Relatedly, Asongu (2013), using data from several Sub-Saharan African countries, shows that m-money in Africa has provided the opportunity for cost-effective means of doing business. Moreover, in terms of consumption, farmers who adopt m-money can purchase goods and services at any time anywhere so long as there is a credit balance on the m-money account.
Studies in Ghana (Osei-Assibey, 2015; Narteh et al., 2017) and elsewhere (Ismail & Masinge, 2011) also find that seeming benefits, willingness, external pressures, structural changes, skills and openness to external sources of information, perceived user-friendliness, usefulness, trust, and cost of use have a strong influence on adoption of m-money. Apiors and Aya (2018) also investigate the impact of m-money on payments, savings, and investments among different groups of people such as petty traders, artisans, and some salaried workers in Ashanti Region, Ghana. The problem with this study is that the sampled respondents were not homogeneous, thus a comparison would be biased in favor of salaried workers. As indicated earlier, these studies failed to deal with the endogeneity problem associated with m-money adoption and its impact as well as comparing heterogeneous groups. Adaba et al. (2019) explore the contribution of mobile money to well-being from a capability perspective in the Upper East Region, Ghana. The study was qualitative and failed to deal with problem of endogeneity of m-money.
Furthermore, Riquelme and Rios (2010) found that ease-of-use and social norms were important in influencing adoption of m-money for females than males in Singapore. Mbiti and Weil (2011) identified age, educational level, living standard, and location as determining factors of m-banking adoption. Bankole et al. (2011) demonstrated that culture plays an important role in determining the adoption behavior of users of mobile banking in Nigeria. Afawubo et al. (2017) found that, in Togo, social networks such as religious and student groups were great influencers for m-money adoption.
Some studies have concluded that the use of m-money has significant and positive impact on marketing, input usage, and income levels among smallholder farmers (Kikulwe et al., 2014; Sekabira & Qaim, 2016). Kikulwe et al. (2014) and others (Sekabira & Qaim, 2016) have confirmed that the use of m-payment services enhance savings among rural dwellers. These point to the fact that m-money services contribute to the welfare of rural people. Particularly, Batista and Vicente (2017), Munyegera and Matsumoto (2016), Aker and Wilson (2013), Cobla and Osei-Assibey (2018), and Jack and Suri (2014) find that m-money reduces the cost of distributing funds and recipient’s collection, providing more privacy and changing intra-household decision-making resulting in observed increases in household consumption. Gosavi (2018) finds that m-money provides the avenue for access to loans to firms in Eastern Africa and that firms that adopt m-money are more productive compared with their counterparts that do not. By implication, and holding other factors constant, it can be inferred that owners of firms that adopt m-money are more likely to improve their output and welfare than those who do not.
While many of these studies document improvements in the welfare of low-income people, majority of the studies provide inconclusive outcomes, with most of them finding evidence of positive impact of financial services on one or more agricultural household indicators in Sub-Saharan Africa. So far, little is known about the impact of m-money on output and welfare of rural farmers in the Ghanaian context. Because previous studies on Ghana focused only on factors that influence adoption of m-money, this study extends the frontier of knowledge by examining the impact of m-money on three household outcomes of smallholder farmers. Moreover, our sample is homogeneous and the use of the propensity scores matching eliminates the problem of selectivity bias.
Methodology
Study Design
The study adopts the quasi-experimental design with the use of control and experimental or treatment groups. The quasi-experimental design was used as this avoids random assignment of individuals into a control and treatment group. Control group consists of farmers who do not adopt m-money while the treated group is which adopts m-money. This helps us ascertain the effect of m-money adoption with reference to non-adopters. The analysis uses the quantitative approach which conforms with the positivist philosophy.
Data, Sample, and Sampling Procedures
The survey was conducted in three districts in three regions of Ghana: Abura Asebu Kwamankese (AAK) in the Central Region, Shama in Western Region, and Adansi South in the Ashanti Region. These districts were selected because the activities of smallholder farmers are intense, and there is high patronage of m-money. In particular, m-money active subscribers ranged between 68% and 94% in the regions within which these districts are found (see Akosen, 2018). Given the high patronage of m-money, these districts were conveniently sampled for the study. A reconnaissance survey and pre-testing of the instruments preceded the actual fieldwork in September 2018. Rural smallholder farmers in these districts make up the study population.
According to the Ghana Statistical Service (GSS; 2010), Shama District has 8,555 people living in rural areas. The proportion of households engaged in agricultural activities in the district was 50%. Adansi South District has 20,745 people living in rural areas with 98.8% engaged in crop farming. AAK District has 18,790 people living in rural areas. The proportion of households engaged in agricultural activities in the district was 75% with crop farming constituting 96% (GSS, 2010). Using the Krejcie and Morgan’s (1970) sample size determination table, a population of almost 40,000 requires a sample size of 379 and it was purposively distributed equally among the three districts.
The sampling of respondents, however, was based on simple random sampling. The study used the lottery method because District Agricultural Offices provided list of respondents. To cater for nonresponses, 550 questionnaires were administered but 460 questionnaires were finally obtained and used for this study due to incomplete responses. The selected farmers were asked to provide their names and telephone numbers on the first page of the questionnaire to ensure their consent to participate in the survey for ethical reasons. Respondents were assured of anonymity of responses and data protection.
After the face-to-face data collection, it was revealed that respondents who used m-money in Shama, AAK, and Adansi South districts were 62.99%, 65.38%, and 63.91%, respectively. Hence, the distribution of respondents into m-money adopters and non-adopters was due to chance. Even though there is equal distribution of the sample size across the districts, without regards to the respective proportions, the results could be biased toward the oversampled district making the results of the study not generalizable.
Analytical Framework
We use the probit model to estimate the probability of adopting m-money. The decision to adopt m-money is observed when the latent utility is greater than zero. This decision to adopt m-money depends on some observable characteristics of the household such as household size, age, gender, and education level. One way to measure the impact of m-money adoption is to assume two groups: adopters and non-adopters (Kikulwe et al., 2014) with common characteristics. M-money adoption is not random across farmers, but rather rural farmers self-select to adopt, therefore adopters and non-adopters may be systemically different from each other.
Modeling m-money adoption
The adoption of m-money is a choice rather than imposition and thus the choice model fits this study. In a model with a binary outcome, MMi, denoting whether a farmer adopts m-money (1) or not (0)

Thus,
where ω i is a matrix that represents the determinants of m-money (MM), β is the coefficients to be determined and μ i is the error term.


where φ represents the standard normal distribution. Therefore, without loss of generality of Equation 8, Equation 9 expands the scope of consideration for what drives m-money adoption among smallholder farmers.

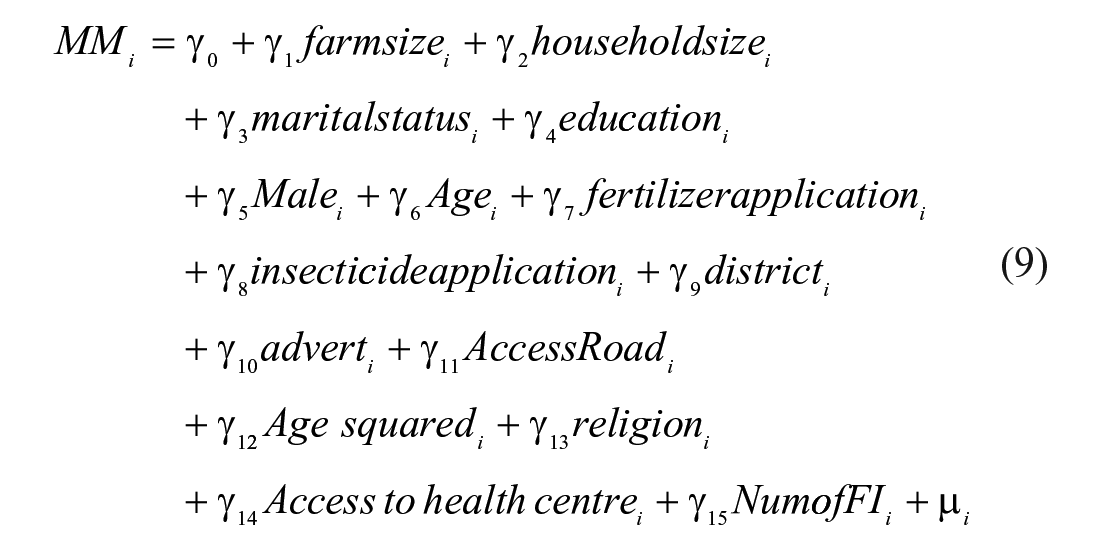
ω i is a vector of a farm, household, and locational characteristics that may influence the decision to adopt MM, γ is the vector of parameters to be estimated and μ i is the error term.
Propensity score matching of m-money on output, consumption, and wealth
The study examines the impact of m-money adoption on smallholder farmer’s outcome variables including output, consumption, and wealth. The study adopts the propensity score matching (PSM) technique. This method compares the household outcomes of smallholder m-money adopters with their counterfactual group. The method is defined as:

where P(X) is the conditional probability of receiving treatment given pretreatment characteristics,
The Average Treatment on Treated (ATT) is the parameter of interest in estimating the PSM model and is expressed as

where
A balancing property that establishes that household behavior within each group is actually similar must be passed. Furthermore, the conditional independence assumption (CIA) should also be met to establish that the adoption of m-money is random and also uncorrelated with the outcome once the observable characteristics are controlled for. Also, the common support condition which must also be met requires that smallholder farmers with the same values of covariates have positive probabilities of being in either regime, that is, adopters and non-adopters.
Generally, there are several matching techniques that can be adopted to compare the p-score of participants and non-participants and to further estimate the ATT. This study uses the radius matching technique as this utilizes all the comparison units within a predetermined radius. However, for robustness checks, the direct nearest-neighbor matching method and the Kernel matching methods are also estimated.
Diagnostic tests: The balancing property condition check
Rubin (2004) recommends that a treatment evaluation model balances the confounding factors before examining the results for the estimated treatment evaluation model. The balance test checks if the distribution of the conditioning variables (pretreatment characteristics) is the same as the treated and the counterfactual group in the matched samples. More so, this test helps check if the selection bias (due to observable characteristics) have been eliminated. This satisfies the matching requirements for calculating average treatment effects.
Description and Measurement of Variables
Table 1 shows the name, type, definition, measurement, and the expected signs of the variables used for the study. From Table 1, the treatment variable in all models is m-money adoption, which is defined as a dummy that takes a value of one if a smallholder farmer adopts m-money services and zero if otherwise. The components of consumption expenditure used to construct this aggregate fall into two main groups: food items and non-food items purchased within the past 7 days. The natural log of consumption expenditure was used to cater for outliers.
Definition and Measurement of Variables.

Source. Authors’ Construct 2018.
Note. MM, log output, log consumption, and log wealth are dependent variables. All other variables are independent variables. JHS = junior high school; SHS = senior high school.
In our sample, the types of crops smallholder farmers cultivate are vegetables, cereals, cash crops, tubers, and others. All outputs were converted into kilogram as the standard unit. Religious affiliations of the respondents were Catholic, other Christianity, Islam, Traditional, and no religious affiliation. Religious affiliations can also influence consumption and wealth because of certain beliefs relating to consumption and farming on a certain day. Wealth was calculated as the value of durable assets such as furniture, television sets, fridge, radio set, sewing machine, stove, air condition, and fan. In the estimation, we used log of the value of assets (wealth) to remove all outliers. Education was measured as a categorical variable (1 = No education, 2 = Primary, 3 = JHS, 4 = SHS & Higher) and marital status as four categories (1 = Divorced, 2 = Single, 3 = Married, 4 = Widowed).
Results and Discussions
Summary Statistics
Figure 1 shows that the proportion of males who adopt m-money in all the three districts was greater than that of their female counterparts. The district with highest male adopters of m-money is Adansi South (75%) whereas the district with lowest male adopters of m-money is AAK. However, in Shama district, the proportion of females who adopt m-money is the same as those who do not adopt whereas in the other two districts there are more female m-money adopters than non-adopters. In general, there are more m-money adopters than non-adopters across the selected districts.

Mobile money adoption across districts by sex.
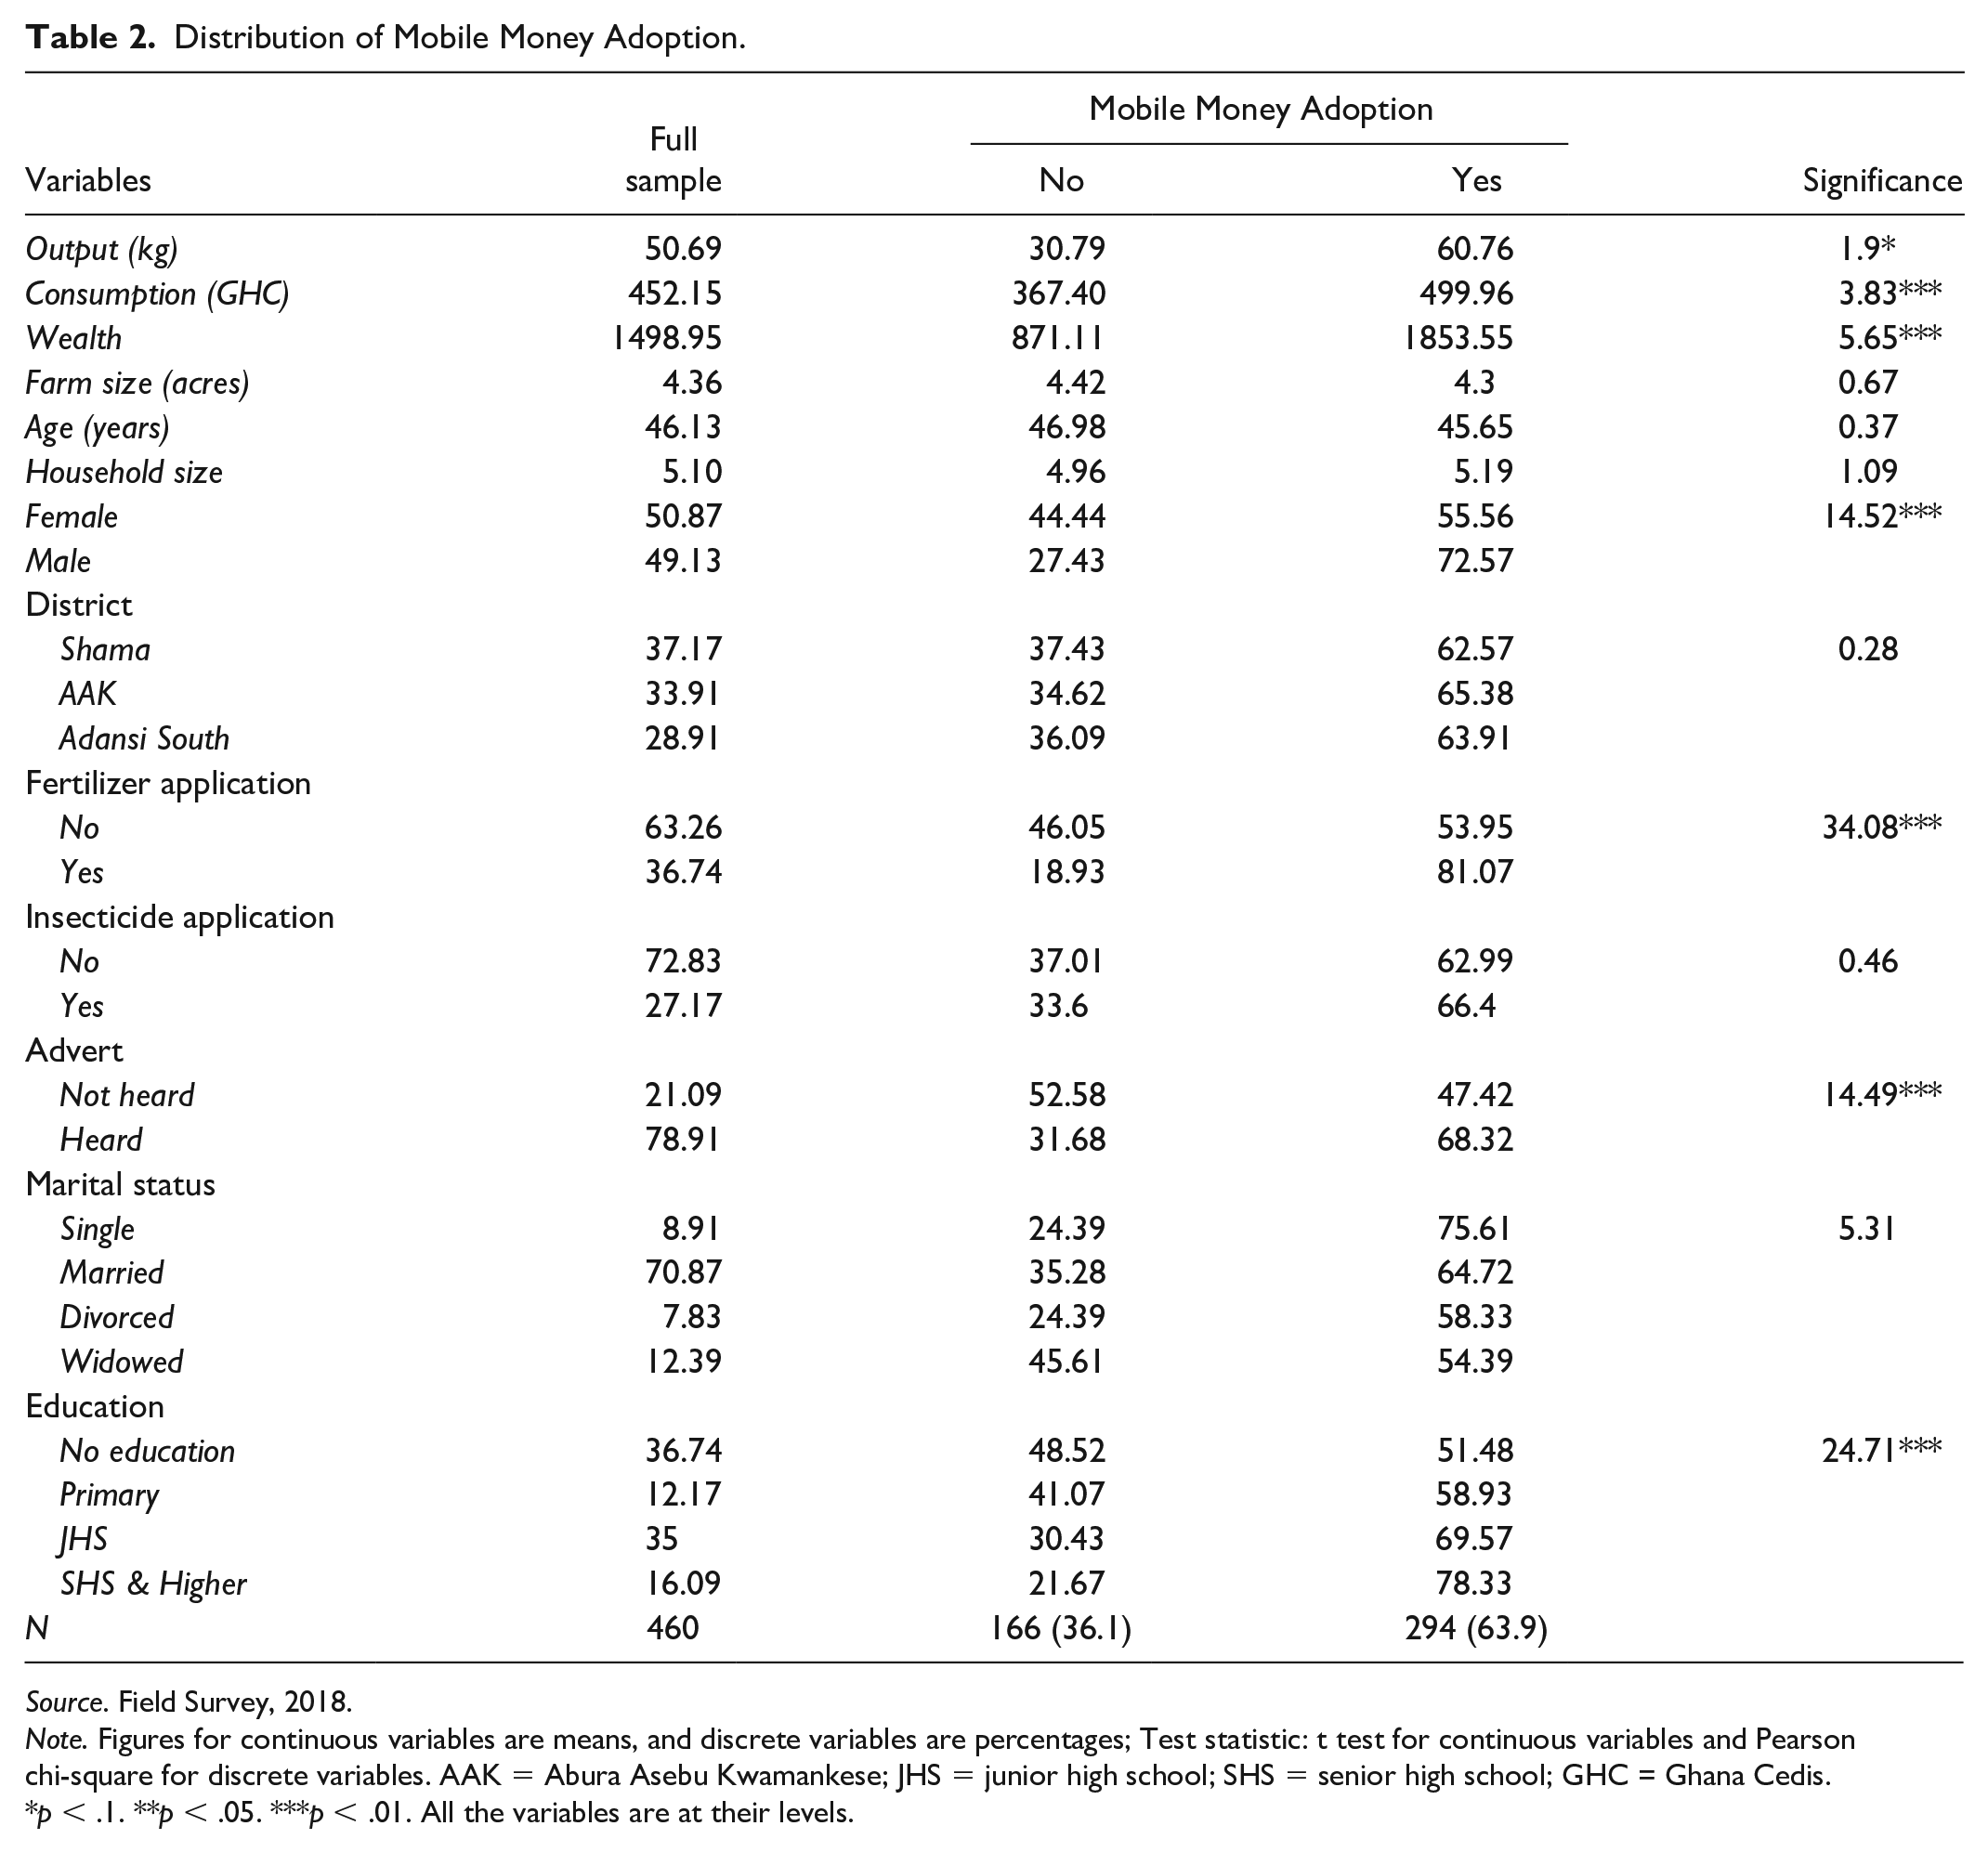
Table 2 shows that farmers who adopt m-money have higher output compared with non-adopters. The t test shows a significant difference in output between adopters and non-adopters of m-money at 10%. This is also true for consumption expenditure and wealth at significant level of 1%. There is no significant difference between the age of farmers, household size, and farm size for farmers who adopt m-money and those who do not adopt. The percentage of farmers who adopt m-money and apply fertilizer is almost 60 percentage points higher than farmers who apply fertilizer but have not adopted m-money. The Pearson chi-square test of association shows that there is a strong association (significant at 1% level) between fertilizer application and m-money adoption. However, the same test shows no significance between m-money adoption and insecticide application.
Distribution of Mobile Money Adoption.
Source. Field Survey, 2018.
Note. Figures for continuous variables are means, and discrete variables are percentages; Test statistic: t test for continuous variables and Pearson chi-square for discrete variables. AAK = Abura Asebu Kwamankese; JHS = junior high school; SHS = senior high school; GHC = Ghana Cedis.
p < .1. **p < .05. ***p < .01. All the variables are at their levels.
Farmers who have ever listened to m-money campaigns on the radio or television would be motivated to use it. This is deduced from the Pearson chi-square test that shows a strong relationship between advertisement and m-money adoption. M-money adoption increases with the level of education, from about 51% for no education to about 78% for SHS & higher. The bivariate test also shows a strong relationship between education and m-money adoption. Farmers in AAK have the highest adoption rate followed by Adansi South and Shama. Despite these high rates, the test shows no significant difference between location in terms of these districts and m-money adoption. This is also the case for the relationship between marital status of the farmers and their m-adoption decisions.
Factors that Influence M-Money Adoption
Table 3 shows the correlates of m-money adoption. Farmers who listen to m-money advertisement are almost 12% more likely to adopt m-money compared with those who do not. M-money advertisement informs users about ease, convenience, and safety associated with its usage. Similar evidence is revealed by Chogo and Sedoyeka (2014) in their study in Tanzania that for customers to adopt m-money, they need to be aware that the service gives the customer value for money and has usability qualities. For a customer to be aware of a service, he or she must have some knowledge about the service, know the location of the agent(s) and the benefits the service brings.
Correlates of Mobile Money Adoption.

Note. Base: Marital Status: Divorced; Education: No education; District: Adansi South; Number of financial institutions: 0 (Category 5 was automatically dropped by Stata due to perfect collinearity); Religion: Traditionalist.
p < .01. **p < .05. *p < .1.
Compared with traditionalists, Moslem smallholder farmers are about 20% more likely to adopt m-money. Interestingly, those who do not belong to any religious group are about 22% more likely to adopt m-money. Even though belonging to a religious group influences the use of m-money, we find that those who are not part of any religious sect are more likely to be m-money adopters. The study presents contradictory results as it was expected that group interaction may influence m-money adoption; however, only the Moslem group was statistically significant but weak. It may, however, be that not all types of social networks influence adoption of technology as found in this case. Our study partially contradicts a study by Afawubo et al. (2017) who showed that members in a common group influence one another and the actions of one member might influence that of the other through networking.
Level of education seems to be one of the major correlates of adoption of m-money. The results show that the probability of adoption of m-money increases with higher levels of education, from approximately 18% (JHS) to 23% (SHS & Higher). This is not surprising because educated households are more likely to be financially informed compared with the non-educated and being educated has higher probability of exposing an individual to knowledge, availability, and usage of financial products and services (Sekabira & Qaim, 2016). Interestingly, with reference to no education, primary education is not significant in influencing m-money adoption. This might be because people who terminate at primary level in Ghana may have had little exposure to the use of mobile phones. Moreover, their level of knowledge might not be different from those who did not go to school, and so in Ghana, primary level of education does not really drive the adoption and use of m-money.
On average, smallholder farmers who apply fertilizer are approximately 33% more likely to adopt m-money compared with those who do not apply fertilizer. The bivariate analysis earlier also showed a highly significant association between fertilizer application and m-money adoption. This is probably because the use of m-money enables farmers to purchase fertilizer on credit and pay later via m-money. Once the fertilizer sellers are also using m-money, it makes it easier for the farmers to make credit transactions with the suppliers. Farmers in AAK are about 12% more likely to adopt m-money compared with those in Adansi South; however, the significance level is weak. Interestingly, having up to six financial institutions in the community reduced the adoption of m-money by about 13% compared with no financial institutions. Given that the lower number of financial institutions is not also significant, it is likely that these financial institutions in these rural areas do not operate m-money services.
PSM Results of M-Money Adoption on Output, Consumption, and Wealth
Before examining the results from the PSM model, the balancing diagnostics is done to check the balance of the coefficients in the model. Using the box plot presented in Figure 2, the diagram shows that the model balances the coefficients. Thus, the distribution of the conditioning confounding factors is not different across the treatment and the control group in the matched samples. This confirms that there are no pretreatment differences between m-money adopters and non-adopters: meaning that the self-selection bias has been eliminated, satisfying the matching requirement for computing treatment effects.
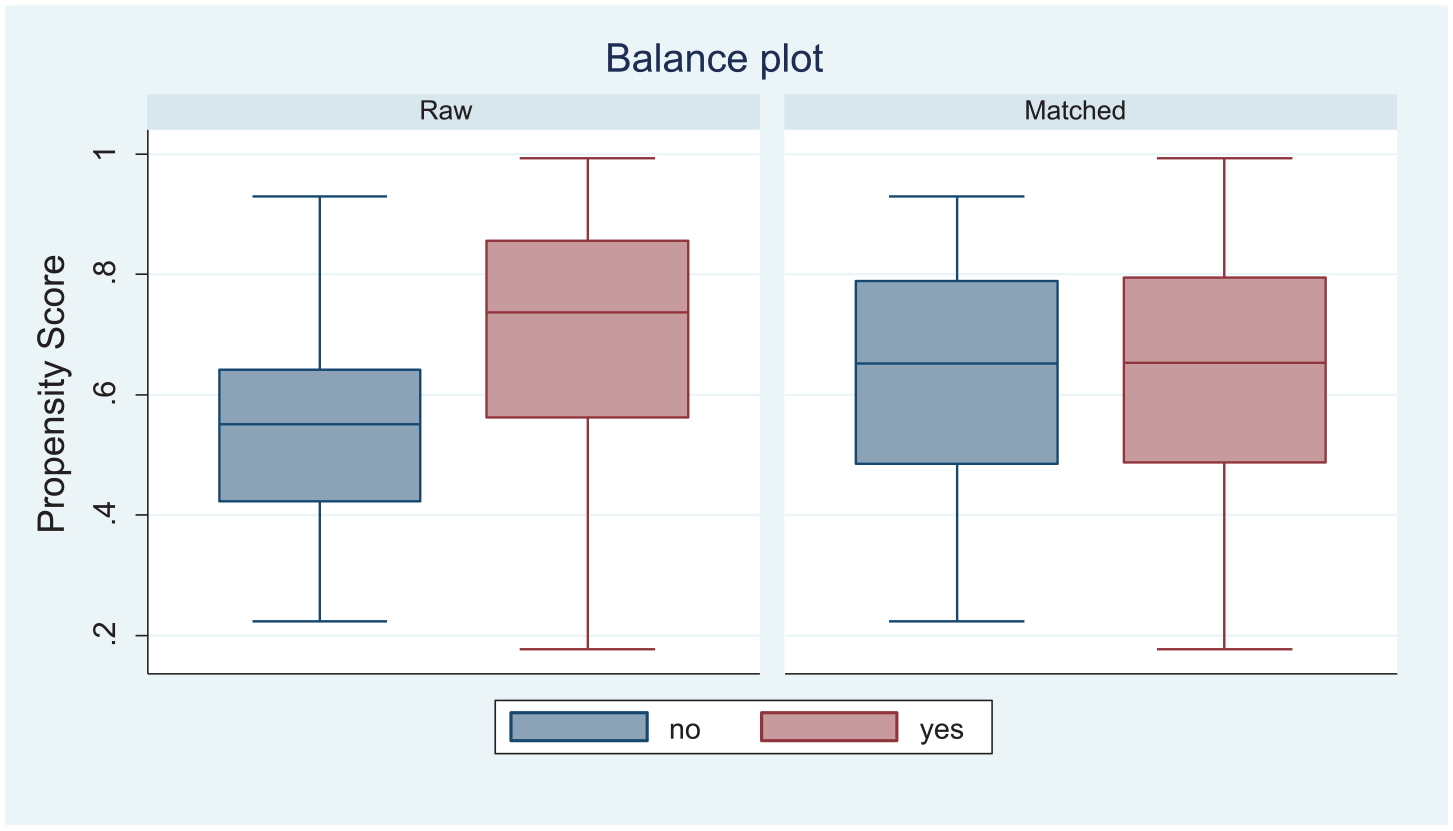
Balance plot of covariates.
Conceptually, financial inclusion through m-money presents households with the opportunity to access credit, operate savings account, receive remittances, and patronize insurance products, which could enhance their agricultural activities. Higher income levels for farmers imply higher crop output and with available financial institutions such farmers are more likely to use financial services. Results in Tables 4 to 6 show the treatment effect or the average household outcome (output and welfare) enhancing effects of adopting m-money by smallholder farmers. These are based on three PSM techniques (stratification, radius, and kernel matching).
PSM Result of M-Money Adoption on Log of Output.

Note. PSM = propensity score matching; ATT = Average Treatment on Treated.
p value *10%, **5%, and ***1%.
PSM Result of M-Money Adoption on Log of Consumption.

Note. PSM = propensity score matching; ATT = Average Treatment on Treated.
p value *10%, **5%, and ***1%.
PSM Result of M-Money Adoption on Wealth (measured as value of assets).

Note. PSM = propensity score matching; ATT = Average Treatment on Treated.
p value *10%, **5%, and ***1%.
Impact of M-Money Adoption on Farm Output
Table 4 presents the results on the average treatment of the effect of adoption of m-money on farm output. The results show that using any of the PSM matching techniques adoption of m-money increases the output of the household between 33.8% and 56%, however, at differing significant levels.
M-money usage translates into higher output via two channels. First, m-money offers smallholders safe and convenient method for saving, perhaps committed savings vehicle for inputs acquisition (Grossman & Tarazi, 2014). Second, it offers smallholders better access to finance for their farming activities. For instance, Gosavi (2018) recently confirmed that firms that use m-money recorded higher productivity compared with nonusers indicating that adoption does translate into increased productivity. This works through the interoperability (Scharwatt et al., 2015) concept which provides timely access to finance at reduced transaction cost. M-money reduces the transactions costs of sending and of receiving money, especially with inadequate and expensive transport infrastructure in farming communities. Transaction costs include the transport costs of travel (to a bank), the travel time, and the waiting time in long queues, which can be extensive in time and money lost. Moreover, the findings confirm Kikulwe et al. (2014) who show that rural farmers who use m-money are more likely to apply fertilizers and pesticides and hire farm labor which are essential inputs for increasing output, all other things being equal.
Impact of M-Money Adoption on Welfare (Log of Consumption Expenditure)
The average treatment effect of m-money adoption on welfare measured by log of consumption expenditure also reveals a positive effect, thus improvement in welfare. The increase in welfare due to adoption of m-money ranges between 39% and 42% depending on the matching technique (Table 5).
This result aligns with findings from a previous study by Munyegera & Matsumoto (2016), who found in Uganda a welfare (measured by per capita consumption) enhancing effect due to the adoption of m-money. It is argued that the adoption of m-money influences smallholder farmers’ spending behavior, hence their level of consumption. M-money provides fast and convenient means of financial transactions making money easily accessible to farmers who can effortlessly receive payments for their goods and remittances from friends and family. Thus, m-money adoption increases access to financial resources needed for individual and household purchases thereby increasing household consumption and subsequently their welfare.
Impact of M-Money Adoption on Wealth (Value of Assets)
The final results shown in Table 6 follow similar results like the one presented earlier. Thus, m-money adoption improves the wealth (value of assets) of households. From the table, m-money users have between 64% and 75% more value of assets than non-m-money adopters. Household adoption of m-money may not only impact their improvement welfare but also in the assets of the household. Some of the resources obtained from m-money can be used to acquire household assets such as radios, televisions, farm inputs among others.
Conclusion and Policy Recommendations
This study sought to examine the factors that influence m-money adoption and its impact on output and welfare (consumption and wealth) among smallholder farmers. We adopted the propensity score matching to examine the counterfactual effect of m-money usage. The results show that advertisement and higher than basic levels of education among other variables were important in influencing the adoption of m-money among smallholder farmers. Adoption of m-money was also seen to have an enhancing effect on the household outcome variables of smallholder farmers. In conclusion, it can be deduced that m-money provides great potential for facilitating the process of meeting existing financial needs, which is a step toward increasing farm output, smoothing consumption, and increasing household wealth. Our findings suggest that mobile money can help enhance smallholder economic outcomes that are relevant for rural development and poverty reduction. Policy options should therefore consider expanding m-money services to smallholder farmers especially those in rural areas. This can be done by intensifying m-money advertisement and education.
Limitations of the Study
M-money business is not without risks. Unfortunately, this study did not consider the issue of risk because risk is very difficult to measure. Furthermore, this study concentrated on selected rural smallholder farmers in the southern part of Ghana which also represents a very limited geographical space, thus making findings non-generalizable. Moreover, given that the selection of sample from the districts was not based on the proportional distribution, the study cannot be generalized and care must be taken in that respect. However, it is very likely results may not have differed much if they were representative. Regarding data limitation, baseline data would have allowed us to use panel data analytical approach to produce robust results. Future study could consider larger geographical areas and panel data to provide a bigger picture of m-money and its effects on farmers.
Footnotes
Declaration of Conflicting Interests
The author(s) declared no potential conflicts of interest with respect to the research, authorship, and/or publication of this article.
Funding
The author(s) disclosed receipt of the following financial support for the research, authorship, and/or publication of this article: The authors received financial support from the Directorate of Research, Innovation and Consultancy (DRIC) of the University of Cape Coast (UCC), Ghana.