
Abstract
The present study aims to compute the level of financial inclusiveness in MENA region countries, considering the three fundamental dimensions that impact financial inclusion: depth, accessibility, and usage of financial services. Moreover, this article incorporates digital payments-related indicators, credit and debit cards, total borrowers, savers, and other indicators to create a more comprehensive financial inclusion index. A two-step PCA methodology with endogenous weighting is employed to develop the financial inclusion index. The data was collected from the IMF and the World Bank from 2010 to 2021. The resulting composite financial inclusion index (FI Index) can be compared across other countries in the MENA region over time, providing a valuable tool for policymakers and evaluators. The two-stage PCA approach implemented in this study addresses the issue of random weight selection and results in a more comprehensive evaluation of the degree of financial inclusion. In summary, this research enhances our understanding of financial inclusion in MENA region countries and offers a methodology to gauge and monitor progress.
Keywords
Financial Inclusion (FI) gives everyone in a country easy access and an opportunity to participate in the formal financial system (Demirgüç-Kunt & Singer, 2017). In particular, FI is currently considered critical for a country’s long-term economic and financial development (Otiwu et al., 2018). FI is currently viewed as a prerequisite for a country’s economic and financial growth in the long run. Poverty reduction and economic development are at the heart of finance-led growth policy strategies in many developing economies. Existing academic and scholarly literature confirms that FI promotes significant redistribution of capital and risks between various social and income groups (Allen et al., 2016; Neaime & Gaysset, 2018). FI helps achieve various objectives rather than only providing easy access to financial services, which involves promoting financial stability (Elsayed, 2020; Tomilova & Valenzuela, 2018) and providing financial security in a country (Ahamed & Mallick, 2019; Siddik et al., 2018). Substantial evidence shows that adequate financial services benefit all people, particularly low-income people (Anwar et al., 2017).
Additionally, it has been recognized that no country, including some of the most advanced economies, has ever fully provided all its segments with access to a financial system. FI, as defined by the economic development literature after the mid-2000s, has been an important element of economic development strategies. Implementation occurs partly due to the increased influence of global organizations such as the United Nations, IMF, and World Bank, as well as through the active participation of national governments and private finance sector entities.
FI is a major challenge in the MENA regional countries, and it is a key strategy to reduce poverty and bolster economic development (Emara & El Said, 2021). The first step towards achieving FI is ensuring everyone has bank account access (Ahamed & Mallick, 2019). This account could be a mobile money one or with any other financial institution enabling citizens to save, receive, and send payments (Donovan, 2012).
Measuring FI is vital for understanding the connections between FI and economic expansion (Demirgüç-Kunt & Singer, 2017). We created a FI index to help us quantify the degree of people’s access to financial services in the MENA region. Despite the importance of linking FI to GDP development and financial development (Neaime & Gaysset, 2018), there is currently no agreed-upon method to calculate it. Even more, the extent of the literature on the composite FI index is quite limited. Government agencies, academics, and policymakers have taken an interest in the issue of FI, making it even more important to quantify it.
Scholars initially measured FI by determining the number of adult households or populations available for formal financial services (i.e., bank accounts) (Allen et al., 2016). This approach had several drawbacks, such as using primary surveys because banks typically do not share information on their customers or accounts (Honohan, 2008). The surveys (like Eurobarometer surveys and Finscope surveys) have narrow scopes because they have only been carried out in a few countries. Survey units provide inconsistent and non-comparable measurements across nations due to different procedures (Eurobarometer surveys used adult individuals as the unit, and Finscope surveys used households as their unit) (Sarma, 2008).
The FI indices created in the past have conceptual and methodological issues (Chakravarty et al., 2010). This is due to several factors. The previous index created occasionally failed to measure the different aspects of FI included in its definition. In some cases, weights for the dimensions of FI are arbitrarily or subjectively assigned, while in others, certain aspects of FI are viewed as interchangeable (Sarma, 2012). Second, FI indices are frequently based on generalized indicators that don’t provide much insight into how people access or use financial services (Chakravarty et al., 2010; Sarma & Pais, 2011).
Several conceptual and methodological drawbacks of previous constructions of FI indices have been identified in the academic analysis of such indices (Chakravarty et al., 2010). These issues often repeat in different parts of index creation and use. Mainly, they fail to cover all parts of financial inclusion fully, only measuring some aspects. Most indexes, despite their methodology, present the authors’ assignment of often arbitrary or subjective weights to the dimensions included in the index (Sarma, 2012), thus making the instrument less objective and robust. It has also been argued that some elements of financial inclusion are considered to be fungible when creating such indices. Finally, it has been suggested that using generalized indicators to construct FI indices is not a viable approach to creating well-informed conclusions about the ways in which people interact with financial services. This implies that the resulting index may not be sufficiently helpful in measuring the actual level of financial inclusion in the areas.
This study presents a new composite FI index spanning 2010 through 2021 using principal component analysis using 10 indicators of three dimensions representing the overall FI picture in MENA regions.
The motivation for measuring FI in the MENA region is to identify the critical dimensions that impact FI the most and to create a composite index that captures the overall level of FI. The benefit of using PCA to calculate the FI index is that it allows the identification of the most significant dimensions of FI in the region, such as penetration, availability, and usage, which can provide valuable insights into the specific factors that need to be improved to enhance the level of FI. Additionally, PCA enables the creation of composite indices that capture the overall level of FI, which can be used to compare the level of FI across different countries and regions, allowing policymakers to identify the best practices and areas for improvement (Mishra, 2007).
Because digital payments are becoming more important to FI initiatives (Wang & Guan, 2017), this research contains both digital payment-specific indicators and additional dimensions used to compute the overall FI index. Our FI index covers indicators from three dimensions to provide a more comprehensive picture of the extent to which people can access and use the financial products and services available to them. By including these additional indicators, our FI Index more accurately captures the full spectrum of FI in the MENA region. Furthermore, to avoid weight biasedness, we use two staged PCA.
Measuring FI comprehensively involves a few critical steps. Firstly, combining various indicators into a unified index simplifies the complexity of FI and monitors its progress. Secondly, a robust FI measure enables analysis of its interaction with key macroeconomic factors. Thirdly, detailed data across different dimensions of FI enhances our understanding and aids in crafting and assessing policies aimed at development.
Our research highlights a significant issue in the MENA region: individuals who are illiterate or unemployed are disproportionately excluded from financial services, posing a notable challenge. It suggests that FI initiatives should prioritize the most vulnerable segments of society. An inclusive financial ecosystem is crucial; without it, households rely on limited, traditional means for saving and financing, perpetuating inequality and stifling economic growth. Thus, FI stands out as a critical avenue to support disadvantaged, low-income households, offering them a path toward economic participation and stability. This study seeks to create the FI (FI) index—used to measure FI levels in nine MENA region countries—using the PCA two-stage method to meet major research questions and verify relevance with additional indicators from other studies.
The remainder of the paper is organized as follows. The next section presents an overview of the theoretical background and previous studies; Section “Methodology” addresses data collection methods; results are discussed in Section “Results,” while Section “Conclusion” presents conclusions and policy implications.
Literature Review
FI is a broad concept that has been defined differently by the past studies. The definition of FI also seems to be different depending on the national levels of socioeconomic development of the country from which it has been described with varying points of emphasis (Aduda & Kalunda, 2012; Akileng et al., 2018; Kempson & Whyley, 1999). However, although there is no definition for FI, common points include easy access and use of financial services via formal financial institutions, which are adjusted to suit the financially incapable groups.
Access to affordable, practical, and need-based financial products and services, including but not limited to transactions, payments, savings, credit, and insurance, is known as financial inclusion (FI), and the World Bank has stressed the importance of taking both individual needs and the sustainability of the system into account when implementing FI.
As a result, there is a continuous discussion about what constitutes FI worldwide. However, most scholars agree that FI occurs when all people, regardless of income or location, have access to a full range of formal financial services at acceptable prices and in sufficient quantities to meet their needs.
The term FI has been given many different explanations in the literature. The definitions, however, depend on the socioeconomic development of a nation (Akileng et al., 2018). Some studies focus on the lack of access to the official financial system and social isolation (i.e., financial exclusion) (Leyshon & Thrift, 1996). The financial exclusion was first described as caused by policies restricting access to the financial system for people from underprivileged backgrounds (Gardener & Molyneux, 2005).
A number of studies have shown that FI is an easy and practical solution to make formal financial services, including bank accounts, regular use, and cheap payments, available to all segments of the economy (Brown et al., 2009). That is to say, regardless of a person’s socioeconomic standing, they should be able to obtain financial services and participate in a universally accessible financial system. The percentage of households having access to formal financial services was estimated by Leyshon and Thrift (1995) and Honohan (2008) using an econometric methodology.
Amidžic et al. (2014) created an index as a combination of characteristics relevant to many dimensions: accessibility, use, and effectiveness. Each variable was first statistically recognized for each dimension and then consolidated using weights, with the aggregated value being calculated after a weighted GM (geometric mean). Using factor analysis to reduce a large number of variables to a manageable number of components has the potential drawback of limiting the strategy’s ability to use the data available for each country. Additionally, it gives each dimension a varied weight, which can suggest that one dimension is more important than the others.
Cámara and Tuesta (2017) employed a two-stage analysis, wherein the first stage involves the estimation of three sub-dimensions that characterize their FI measure: usage, access, and barriers. In the second phase of the analysis, the sub-indices of each dimension from the first phase were employed as explanatory variables to calculate the dimension weights and the overall FI index.
Research has shown that measuring FI in underdeveloped countries requires innovative approaches. Tram et al. (2021) expanded the traditional FI (FI) index by incorporating “mobile money” factors, reflecting modern access to financial services. They utilized a two-stage principal component analysis (PCA) to assign weights intelligently to various indicators, creating a more comprehensive FI index. Similarly, Amidžic et al. (2014) developed a new FI index, and Pesqué-Cela et al. (2021) applied confirmatory factor analysis to measure FI, also conducting a systematic review of the field. These studies collectively enhance our understanding of FI by adapting to changing financial technologies and service landscapes, particularly in underdeveloped regions.
After utilizing data from eight MENA countries from 2002 to 2010 and employing GLS and GMM models, Neaime and Gaysset (2018) determined that FI fosters financial stability. They concluded that broad access to financial services helps the stability of the banking sector’s deposits by individuals, stabilizing the overall financial system (Alhassan et al., 2021), and looked into the connection between political stability and people’s access to financial services. Dahiya and Kumar (2020) and Emara and El Said (2021) established a connection between access to financial services and increased economic output. Al-Smadi (2022) researched the impact of digital banking on underserved populations’ access to credit. Azimi (2022) highlighted the significance of FI in maintaining a sound banking system.
Research from a variety of regions confirms that FI contributes positively to economic growth. Financial inclusion (FI) significantly boosts economic growth, according to Emara and El Said’s (2021) analysis of the MENA region from 1990 to 2018, with the effect being more pronounced in nations with stronger governance. A study conducted by Ifediora et al. (2022) examined 22 African countries between 2012 and 2018. The researchers found that the presence of more ATMs and bank branches significantly impacts economic growth. There is a two-way causal relationship between FI and economic growth, according to Ali et al. (2021), who examined the effect of FI on GDP growth in 45 Islamic Development Bank member nations between 2000 and 2016.
However, the literature dedicated to the effect of certain FI indicators on economic growth, especially presenting the results of profound studies, has not yet been fully developed. According to Azimi (2022), some of the challenges regarding the understanding of the nature and effects of FI are still emerging. Moreover, in developed and developing countries, there is still a lack of scientific papers dedicated to FI, which results in a biased understanding of the phenomenon. Gómez Rodríguez et al. (2021) describe the problems associated with having an incomplete understanding that does not permit the creation of an appropriate policy framework.
Table 1 below describes the previous studies that calculated the FI index using different methodologies and different indicators.
Previous Studies FI Index.

FI Index
Previous studies have demonstrated that a single measure is inadequate to capture the multifaceted nature of FI fully (Ghosh & Vinod, 2017; Park & Mercado, 2018). As a result, a comprehensive estimate is essential, and this article presents the FI Index for the MENA region using available data from 2010 to 2021. While an ideal scenario would capture FI from multiple perspectives, the index represents a valuable effort to provide a more holistic picture of FI in the MENA region.
We propose the following criteria for building a robust FI measure:
(1) A wide range of FI-related information should be included.
(2) It should be straightforward to calculate and
(3) It needs to be consistent throughout time and across nations.
Theoretically, such an index should meet limited, unit-free, homogeneous, and monotonic fundamental mathematical qualities (Dupas et al., 2018; Sarma, 2016). Following these guidelines, we propose an FI index for the MENA region with three dimensions: penetration, availability/access, and usage.
Penetration
It’s vital that as many individuals as possible have access to a comprehensive financial system, requiring users to adopt it broadly. The level of banking system penetration can be estimated by looking at the population that uses banking services or the percentage of people with a bank account (Dupas et al., 2018). The number of deposit bank accounts (per 15+ adults) per adult may be used as a surrogate for the number of banked adults, given that there is likely a positive association between these two variables (Allen et al., 2016). Therefore, based on a study (Sarma, 2012), we use the data on the number of deposit accounts with all financial institutes, including commercial banks, credit unions, and credit cooperatives per 1,000 adults, as an indicator of FI’s depth rather than relying solely on the number of commercial bank deposit accounts (Tram et al., 2021), other variables included in penetration are the number of adults who use credit or debit cards, as these indicators are additive to those who have a bank account (because one needs a bank account before being issued a debit or credit card) (Sarma, 2012).
Accessibility
A user-friendly financial system includes convenient access to banking services (Karlan & Morduch, 2010). ATMs and the number of bank branches are good indicators of accessibility. ATMs play a significant part in the modern banking system of many countries. Some automated teller machines (ATMs) offer additional services, such as credit card-related and bill payment transactions, in addition to the more typical tasks of providing account information and facilitating the deposit and withdrawal of cash and checks. Bank branch density (per one thousand adults) and ATM density (per one thousand adults) can be used as indicators of service accessibility (Hakimi et al., 2022). Consequently, we use data on the number of branches per 100,000 adults and ATMs per 100,000 adults to measure availability along this dimension (Tram et al., 2021). When we talk about branches, Banks are not the only financial organizations we have considered; credit unions, credit cooperatives, and microfinance institutions are all part of the conversation (Beck et al., 2007).
Usability
Ahamed and Mallick (2019) used the number of bank deposits per 1,000 people to measure the usage dimension. Meanwhile, Tram et al. (2021) used different variables as per the percentage of GDP, including outstanding deposits, outstanding loans, and the value of mobile money transactions. According to Wang and Guan (2017), the usage dimension is indicative of the frequency and consistency with which individuals use financial services. The concept of underbanked or marginally banked individuals drives the usage dimension. They’ve noticed that although many individuals in various countries have access to banking services, they don’t use them even in highly penetrated bank countries.
Although these underbanked people have access to official financial services, they do not often make use of them for a variety of reasons, including the inconvenient location of banking branches, the high costs associated with using these services, or previous bad interactions with the financial institution (Leyshon & Thrift, 1995). Because of this, it’s clear that a bank account alone isn’t enough to sustain a functional financial structure (Mandira, 2012; Sarma & Pais, 2011).
To fill the research gap, we used any individual borrowed from a financial institution, namely Borrower (15+ age), the number of individuals in percentage saved at a financial institute, Saved (% aged 15+), and Digital Payments (Azimi, 2022). Other Variables used are Bank credit to the private sector as a % GDP and total deposits to financial institutes.
Methodology
To construct an adequate index from data, it is necessary to determine the correct importance or weight of its components and indicators, ensuring that no aspect of the issue dominates excessively. This allows for an accurate presentation of the data of an adequate index. The two-stage principal components methodology is used to calculate the overall index of the MENA region. The goal of this method is to determine the ideal combination of indicators that would best represent the subject of this study.
In the first stage, the method identifies the optimum dimensions of FI. The second stage, PCA, is preferable in this regard as it works effectively with large numbers of variables without being concerned about overlapping of data. The division of the total index into three specific indices, in turn, enables the fulfillment of the dual function of this stage. The first is to develop, based on the results of each of the sub-indices, specialized practical data for policymaking. Secondly, it allows for the treatment of these sub-indices as independent research units, thus addressing the issue of closely related indicators that skew the conclusion of the analysis. Such an approach precludes the possibility of being dysfunctional or of having a hidden bias in weighting due to closely related indicators. The use of a two-stage PCA, as outlined, increases the accuracy and fairness of the FI index.
First Stage PCA
As described earlier, in the first stage of PCA, we estimate the three dimension’s sub-indices: Penetration, Accessibility, and Usage. That is, the three unobserved endogenous (


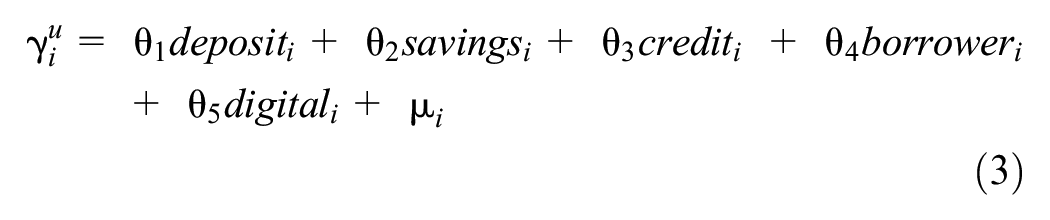
Here, (
Second Stage PCA

Where,
The overall FI index is computed in the second stage by replacing
Results
A dataset’s linear relationships between variables are found through correlation analysis. Using a new set of principal components and uncorrelated variables, PCA attempts to minimize the dimensionality of the data.
The correlation between each indicator is displayed in Table 2, and a high correlation between indicators indicates that the data is suitable for PCA to proceed with. Variables with values greater than 0.5 are regarded as highly connected. Not only may high correlation variables be employed in PCA, but they also yield significant benefits from it. PCA is useful for handling datasets with strongly linked variables since it can minimize redundancy and noise and increase interpretability (Jolliffe, 1986).
Pairwise Correlations.

Source. Author calculation.
The descriptive data analysis for the dimensions-related indicators is shown in Table 3. We normalize the variables for each dimension prior to using the PCA technique in order to eliminate any potential bias caused by the various measurement scales.
Descriptive Statistics.

Source. Author calculation.
First Stage PCA Results
The weights of each variable in PCA mean the importance of this variable when capturing the variation within the data. They are calculated based on the product of the absolute value of the variable and the proportion to the part in the principal component. The point of the principal component is to capture as much of the variance in the data as possible. As such, the variable gives a grasp of which data variable explains the data variation and differences.
Table 4 describes the results of a PCA applied to three dimensions in the context of the MENA region. It lists the eigenvalues of each component for each dimension. For the “Penetration dimension,” the eigenvalue of component 1 is 2.421, component 2 is 0.468, and component 3 is 0.111. For the “Availability dimension,” the eigenvalues of component 1 and component 2 are 1.246 and 0.754, respectively. For the “Usage dimension,” the eigenvalues of components 1 to component 5 are 3.217, 1.324, 0.242, 0.14, and 0.076, respectively.
Principal Component Analysis for Sub-Dimensions.

Source. Author calculation.
In this analysis, the eigenvalues of each component are calculated and evaluated to determine which components should be considered for further analysis. The rule of thumb is that components with eigenvalues greater than one are considered important and should be retained for further analysis (Kaiser, 1960).
The results show that the eigenvalues of the first component in the “Penetration dimension” and “Availability dimension” are greater than 1, as well as the eigenvalues of the first and second components in the “Usage dimension.” These components are considered important and are analyzed further. The eigenvalues of the other components are less than 1, so they are not considered for further analysis.
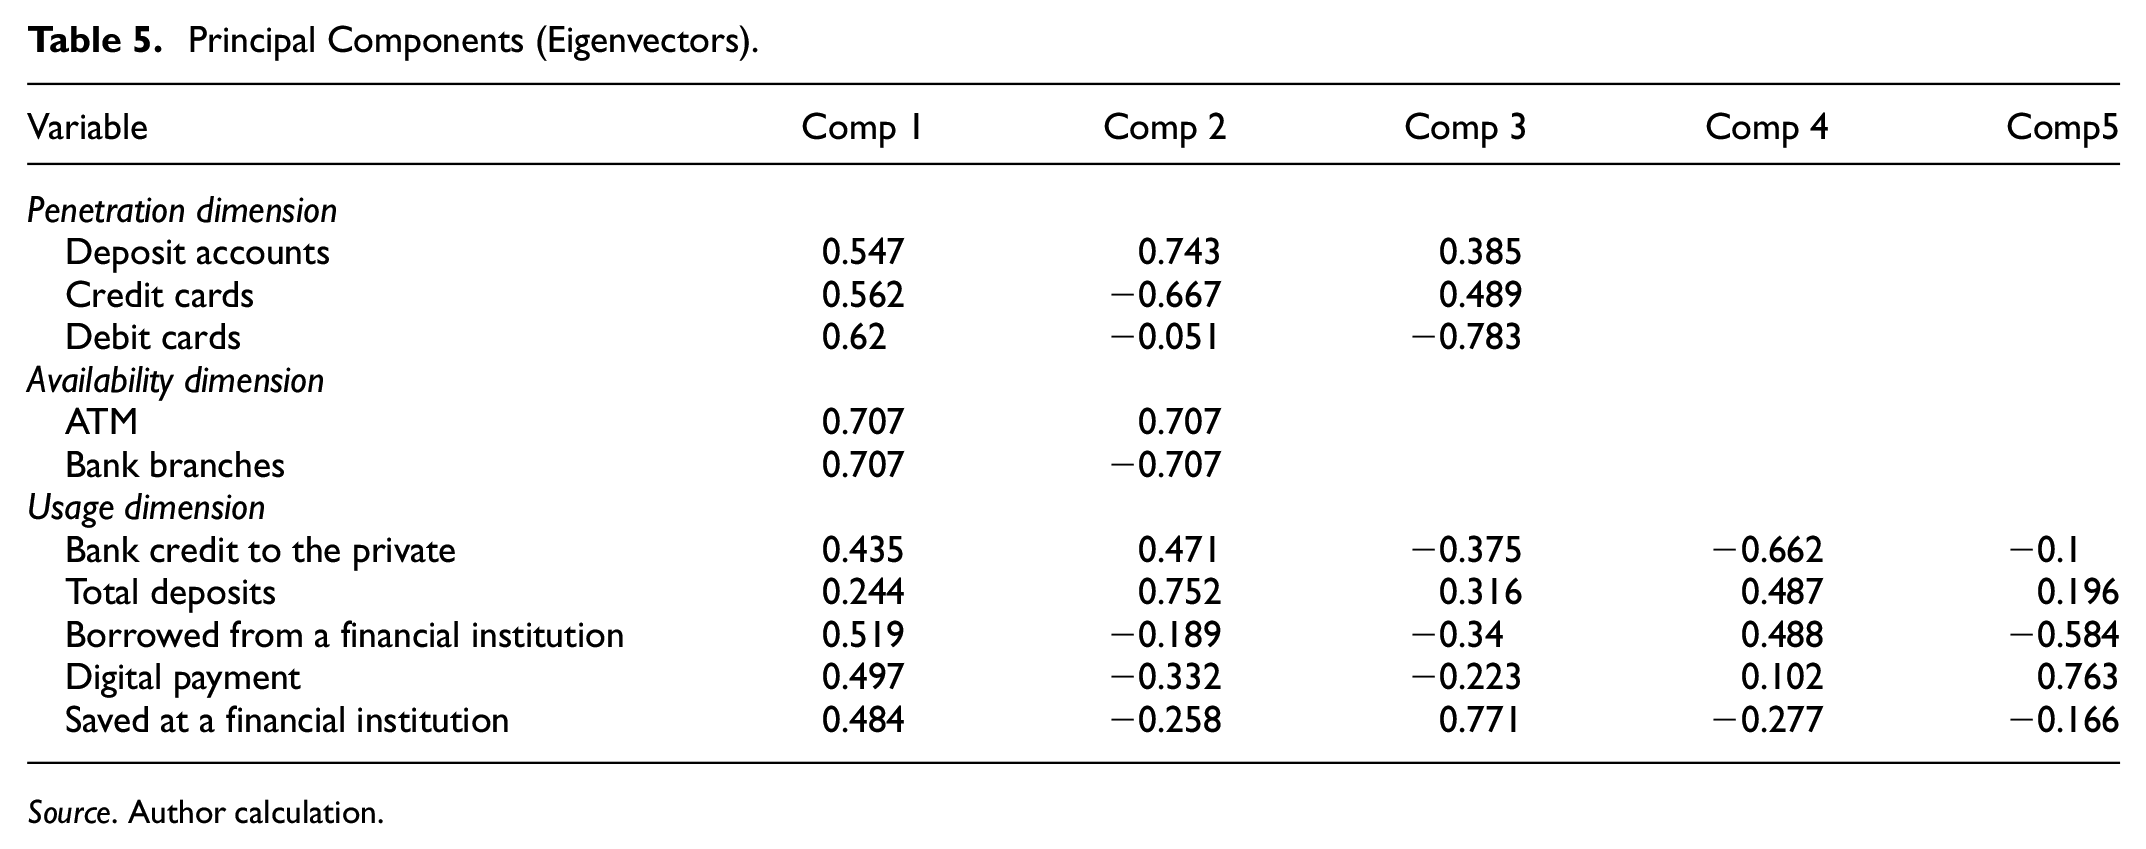
The Principal Component Analysis (PCA) results for the MENA area are displayed in Table 5. The weights assigned to each indicator are displayed. The following weights apply to the first component of the Penetration dimension: 0.547 for “deposit accounts in all financial institutes,” 0.562 for “credit card of 15 years and above,” and 0.62 for “debit card of 15 years and above.” Among these three factors, “debit card of 15 years and above” has the highest weight in this instance, suggesting that it contributes more to the data’s variability.
Principal Components (Eigenvectors).
Source. Author calculation.
For the Availability dimension, the “ATMs” and “bank branches” have an equal weight of 0.707. This indicates that both variables have an equal contribution to the first component and are considered to have a similar level of importance.
The analysis of the Usage dimension in the MENA region revealed the first component and the respective weights assigned to each variable. These weights are a representation of the contribution of each variable to the first component. The weights, in this case, are 0.435 for “Bank credit to private investors,” 0.244 for “total deposits in all financial institutes,” 0.519 for “Borrowed from the financial institute,” 0.497 for “digital payments,” and 0.484 for “saved at any financial institute.”
These weights demonstrate the relative significance of each variable in explaining the variability in the data of the Usage dimension in the MENA region. The first component, a linear combination of the original variables, is intended to explain the majority of the variability in the data. The weights suggest that “Bank credit to private investors” has the most significant impact on the first component, followed by “Borrowed from the financial institute.” Meanwhile, “total deposits in all financial institutes” and “saved at any financial institute” have a comparatively lesser impact, and “digital payments” have a similar impact on the first component as “saved at any financial institute.”
Table 6 shows the Kaiser-Meyer-Olkin (KMO) test results. The results of the KMO values for penetration, availability, and usage are 0.58, 0.5, and 0.6976, respectively. The total values represent the adequacy of sampled data in relation to their common variance with a possible common variance measure of 1. To a large extent, common variance is defined, with a general benchmark indicating that a KMO result of above 0.5 means the dataset sufficiently samples the data for conducting PCA. In this regard, all three dimensions sampled show adequate common variance data, implying an effect of PCA application.
Kaiser-Meyer-Olkin Measure of Sampling Adequacy.

Source. Author calculation.
Second Stage PCA Results
In the second stage, we use the result of three dimensions and use principal component Analysis.
Table 7 displays the findings of PCA estimations. The eigenvalues of PCA results are 2.153, 0.603, and 0.244, respectively, indicating that only component one is considered for analysis because it is the only one with an eigenvalue greater than 1.
Principal Component Analysis.
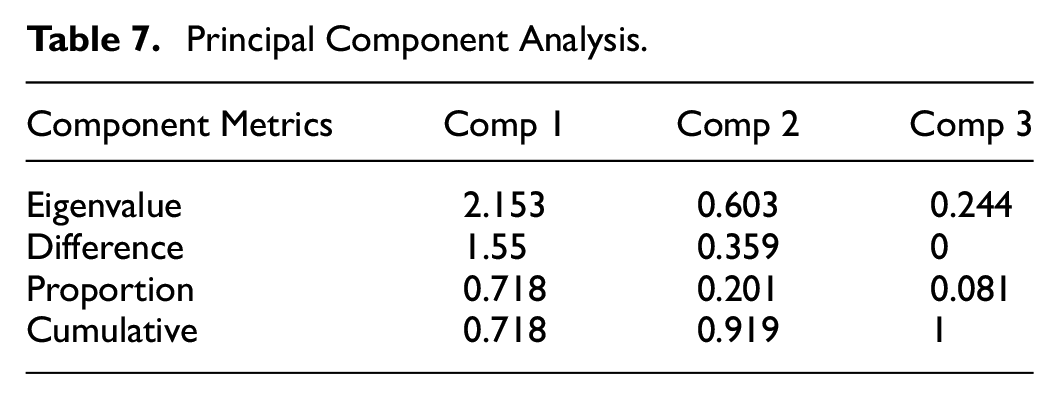
The first component in the principal component table shows a total of 0.718 overall variations in the data in the cumulative column of Table 6. The second component shows 0.201 data variation; cumulative, both components show 0.919. As only the first component Eigen value is above 1, we take only component 1 for PCA analysis and to predict the FI index.
Table 8 shows the weights for all three dimensions, like the first stage’s methodology. According to Table 7, the availability dimension is given the most weight by the PCA (0.625), followed by usage (0.5838) and penetration (0.519). The relatively identical weights of the three dimensions imply that all of them are crucial in assessing the FI status in the MENA region. These results suggest that policymakers and financial institutions in the region should prioritize improving the accessibility, usage, and penetration of financial services to enhance the level of FI in MENA.
Principal Components (Eigenvectors).

Table 9 displays the overall index KMO values. KMO 0.6262 value satisfies the condition of greater than 0.5.
Kaiser-Meyer-Olkin Measure of Sampling.

Source. Author calculation.
The scree plot after PCA. In a principal component analysis, a scree plot visualizes the eigenvalues linked to each principal component (Figure 1).
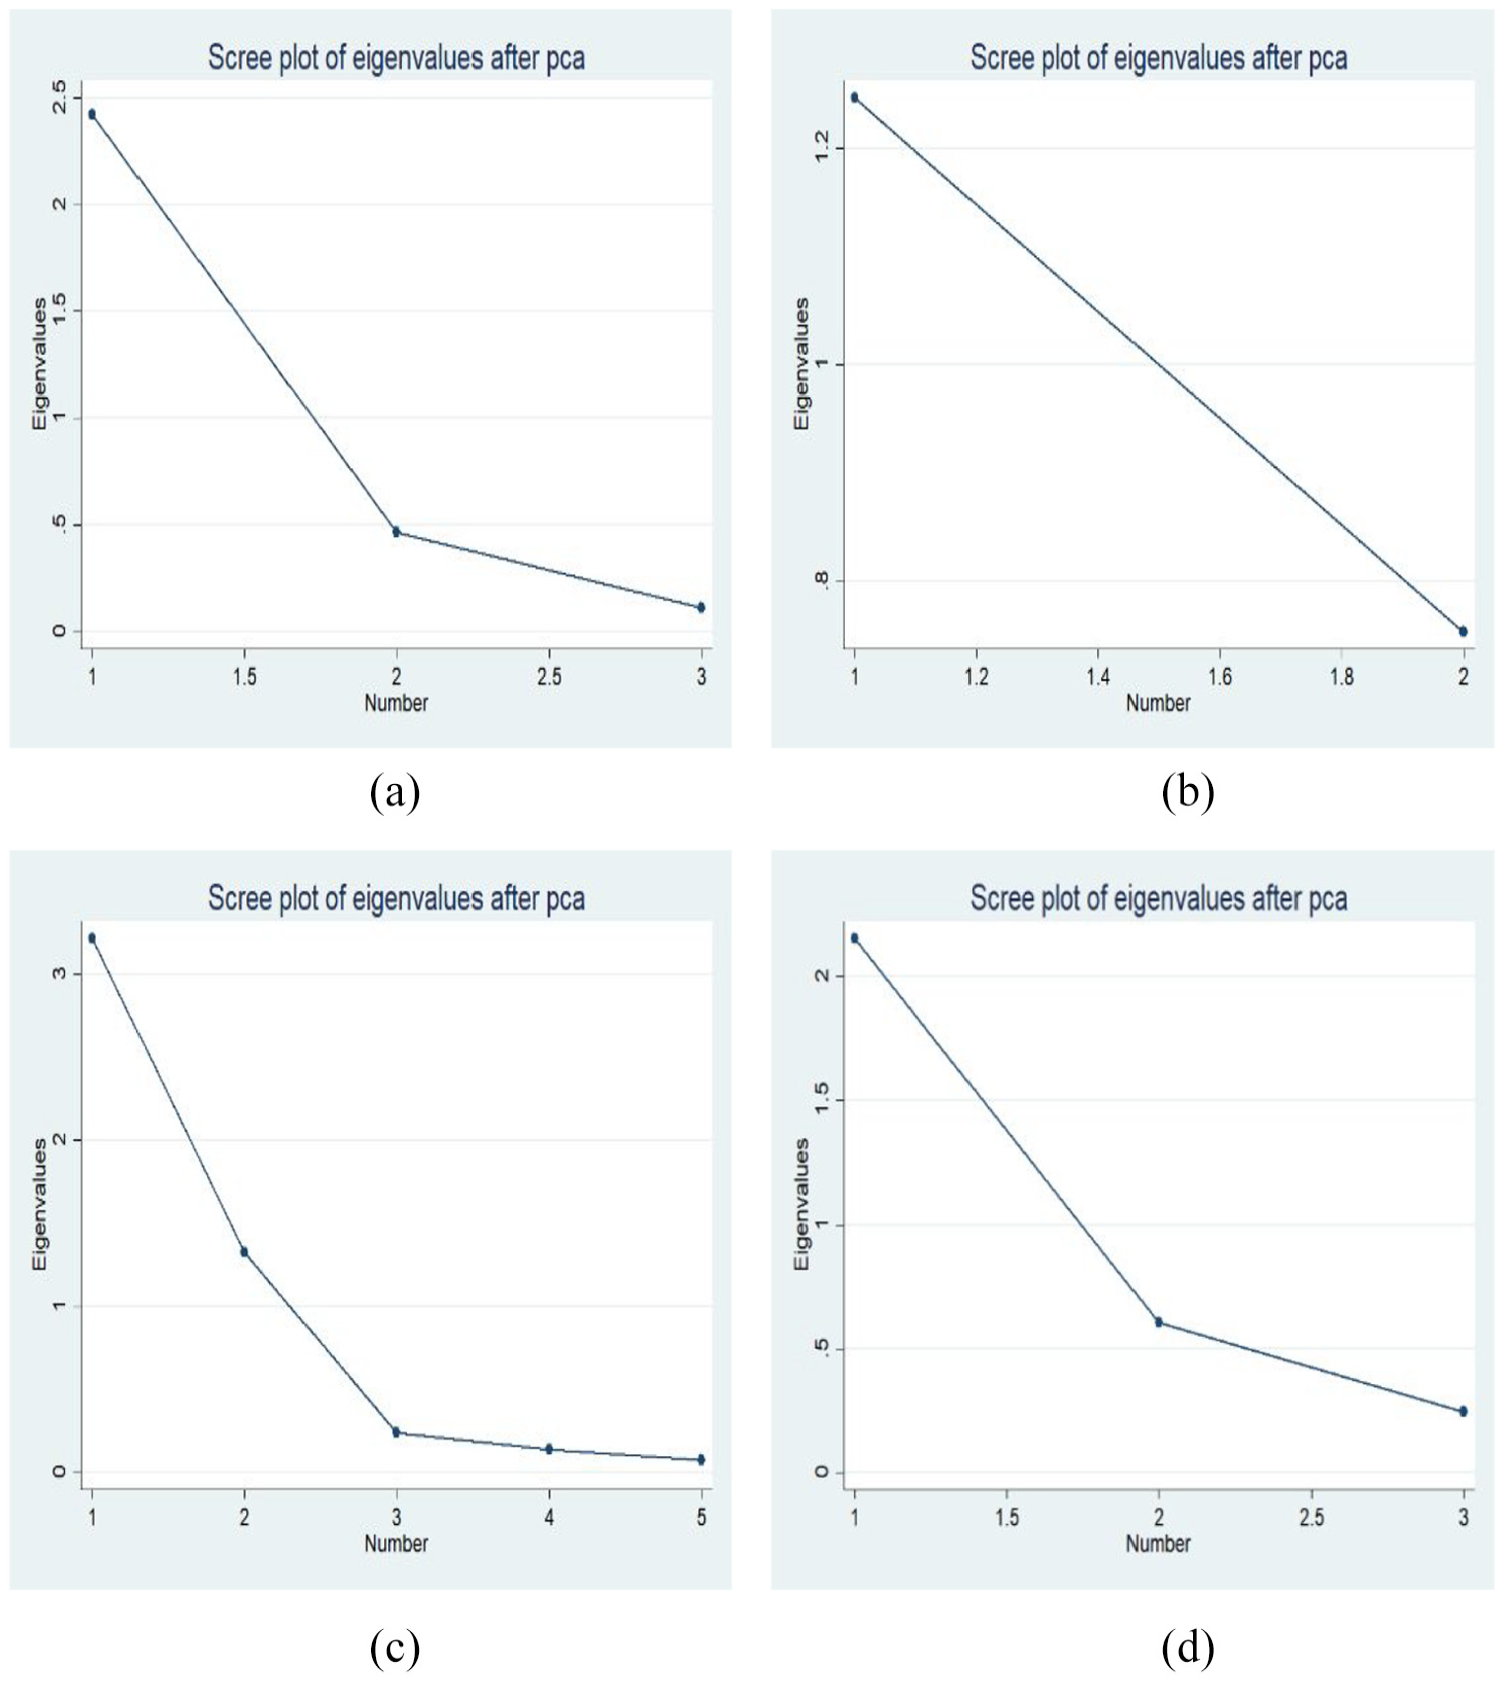
Presents a scree plot analysis from a principal component analysis (PCA) focusing on FI across three dimensions: penetration, availability, and usage. The scree plot for each dimension illustrates the eigenvalues associated with each principal component, indicating their importance in explaining variance within the data: (a) penetration, (b) accessibility, (c) usability, and (d) final PCA.
For the penetration dimension, the first principal component stands out with an eigenvalue of 2.421, showcasing its significant role in explaining data variance. In contrast, the subsequent components have considerably lower eigenvalues (0.468 and 0.111), indicating lesser explanatory power. In the availability dimension, the first principal component’s eigenvalue is 1.246, highlighting its primary importance in variance explanation compared to the second component with an eigenvalue of 0.754, suggesting a notable but reduced impact. Regarding the usage dimension, the analysis reveals a descending order of importance, with the first principal component having the highest eigenvalue of 3.217. The following components’ eigenvalues decrease progressively (1.324, 0.242, 0.14, and 0.076), reflecting their diminishing contributions to explaining the variance. This analysis underscores the significance of the first principal component in each dimension for understanding the variance in FI data, with subsequent components offering diminishing explanatory power.
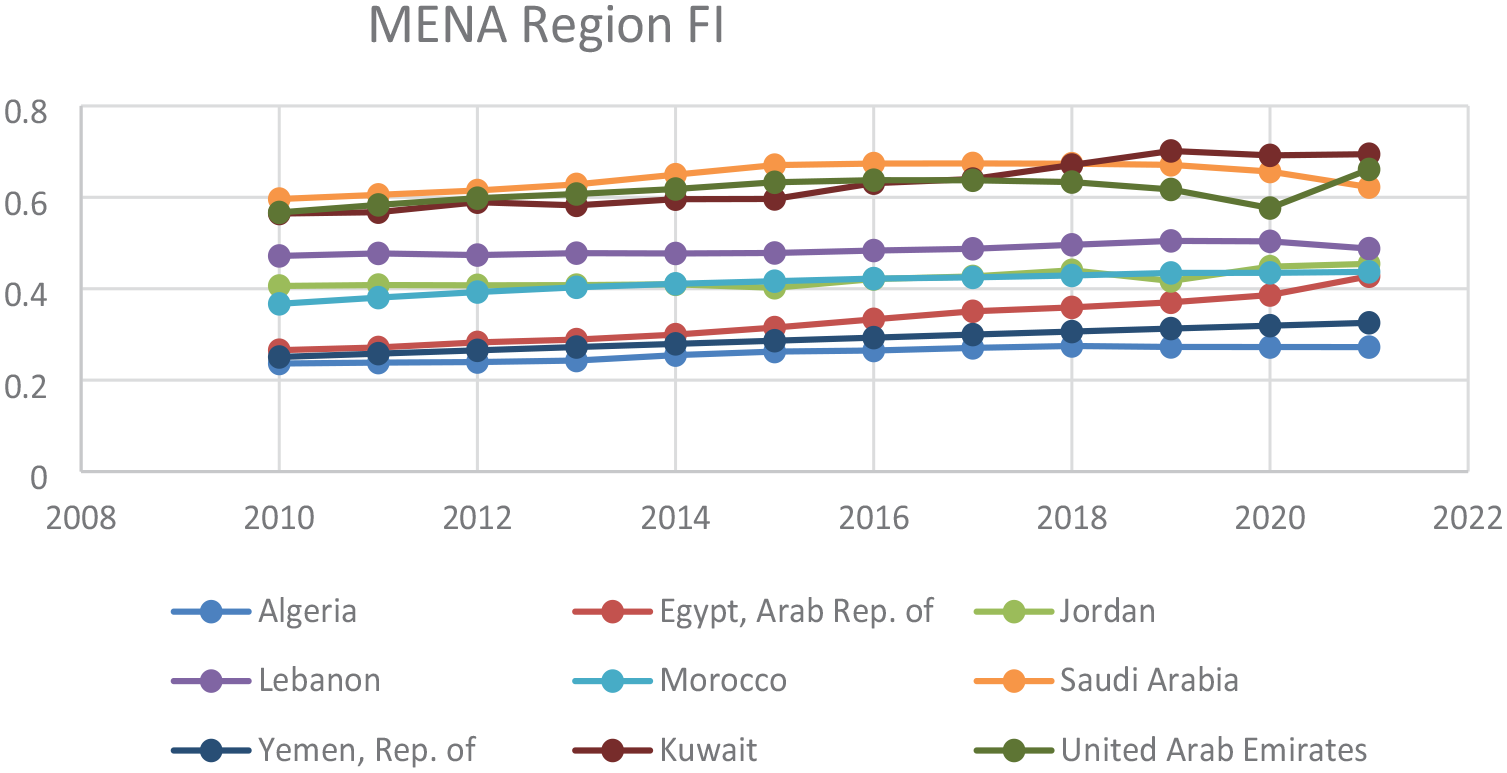
Table 10 displays the final FI index of nine countries in the MENA region. Saudi Arabia, Kuwait, and the UAE are the leading economies in the MENA region, with optimal FI rates. On the other hand, Egypt, Yemen, and Algeria have the lowest rates, indicating substantial room for progress in these countries.
FI Index—Mena Region Countries.

Source. Author calculation.
In 2021, the best FI-performing countries included Kuwait, UAE, and Saudi Arabia, with index values of 0.6944, 0.6611, and 0.6224. It shows that the UAE improved significantly in 2021. In Saudi Arabia, for example, the usability dimension has jumped from 0.4 to 0.6 in just 11 years, and penetration has also experienced significant growth. In the United Arab Emirates, the penetration and accessibility dimensions made strides in 2020, while in Kuwait, the accessibility dimension has made significant progress from 2010 to 2021.
The table provides a useful snapshot of the current state of “FI” in the MENA region, and the countries lagging could benefit from learning and adopting best practices from those leading. By doing so, countries with lower FI rates can work towards closing the gap and enhancing access to financial services for their citizens, which could positively impact their overall economic growth (Figure 2).
The graphical representations of the progress made in FI across nine countries in the MENA Region, categorized by dimension. The graphs illustrate the advancements in penetration, accessibility, and usability, allowing for an easy comparison of the progress made in each dimension in each country. The graphs provide a clear and concise visualization of the region’s current state of FI and highlight the countries leading in each dimension.
As we explore FI across various nations, it’s clear that Saudi Arabia, Kuwait, and the UAE are leading the way, with Kuwait and UAE crossing Saudi Arabia in FI in recent years. Over the past decade, these countries have seen notable advancements in penetration, access, and usability. Notably, all three dimensions have progressed in tandem, reflecting the overall development of FI in these countries.
Conclusion
In recent years, the Middle East and North Africa region has achieved significant success in expanding FI. The region enjoys relatively high internet access and mobile phone penetration, facilitating the expansion of new digital financial services that could accommodate the previously unbanked segments. The region’s government organizations have also formulated policies and initiatives that have furthered the cause of FI, including increasing access to core banking services, fostering financial literacy, and lowering entry thresholds for fintech. However, the region’s FI levels have differed significantly between countries. For example, some countries such as UAE, Qatar, Bahrain, and Kuwait already have a high FI level because a significant proportion of the populace already enjoys access to formal financial products.
In contrast, countries such as Yemen, Syria, and Libya have poor FI levels due to their political instability and the problems related to war. In this study, we propose an FI index to examine the stage of the FI degree in the nine selected MENA countries using the yearly data in 2010 to 2021 from the FAS and World Bank databases and the weights from the two-step PCA approach. As the FI index is multidimensional, the weight-based free index is established from a statistical perspective.
While there have been positive trends in enhancing FI in the MENA region, Findex indicators indicate that a significant part of the populations and businesses in the studied countries are still unbanked or underbanked. Therefore, to achieve true FI, it is crucial to increase the accessibility of financial services to all people in society, including those from remote areas and individual people and businesses working under the cash economy and facing other financial/social bottlenecks. Only if all people have access to financial institutions can economies in the region realize their fullest economic potential and ensure that all people and businesses embrace the benefits of FI. Based on the PCA findings, which show a need to improve the availability, usage, and penetration of financial services to foster FI, we argue that policymakers and concerned institutions need to prioritize investments in increasing access to finance. This may include providing financial products and services to people in remote areas and underprivileged populations, promoting financial literacy and education to boost the usage of financial institutes, and developing incentives that encourage people and businesses to operate or save in a bank account or use other finance utilities. Further, the massive load on the availability dimension suggests improving physical infrastructure and technology to ensure financial services reach more people in the region. These measures can promote FI in MENA countries, leading to overall economic development.
This research is relevant for policymakers and the population for policymaking and evaluation, as it helps create a system for increasing FI and considering the possible impact on other indicators. To grow the economy in a sustainable way to reach more people have to enter the financial system.
Implications
There are also various economic reasons why measuring the FI Index for MENA would be beneficial. For one, it generates relevant information that aids in making informed decisions. The FII blueprint helps policymakers target areas where they can allocate resources efficiently while examining where directed actions could have the most significant impact on FI in MENA. Regular reassessment of the FI offers a view of advancement and helps to determine whether the region’s ability to access financial services is improving. Resourcefulness and competition on the part of financial service providers are boosted relative to the FII, incentivizing them to innovate in ways that might help those who are unbanked or underbanked. It can provide data-driven signs that permit evidence-based policies to be adapted to the distinct difficulties of a given region or country. It helps to align governments, financial institutions, non-governmental organizations, and the private sector behind an economic vision by raising public awareness of the importance of FI.
Limitations
In the MENA region, there is a large underground economy that includes both legitimate and illicit trades like narcotics and weapons. Nevertheless, the official banking industry is undermined by this enormous economy. The first effect is a decline in faith in established monetary institutions. Banks and financial services lose credibility when the majority of the economy shuns them, particularly when dealing with illicit activities. Additionally, the financial services are undermined. People opt to use cash or turn to informal borrowing techniques as a result, and fewer have bank accounts. Consequently, FI and general economic growth in the region are diminished.
The informal economy is difficult to quantify because of how hidden it is. To further understand its scope and impact on the financial sector, more study is required. Finding out how formal financial features like borrowing rates relate to the unrecorded economy is also useful; in general, the lower the level of unrecorded activity, the lower the rate of formal borrowing.
Footnotes
Acknowledgements
The authors would like to express their gratitude to Muhammad Umar for his invaluable contributions to this research.
Declaration of Conflicting Interests
The author(s) declared no potential conflicts of interest with respect to the research, authorship, and/or publication of this article.
Funding
The author(s) received no financial support for the research, authorship, and/or publication of this article.
Data Availability Statement
Data sharing not applicable to this article as no datasets were generated or analyzed during the current study.