
Abstract
The research topic related to transport infrastructure and the impact of increasing land prices has attracted the attention and research interest of many scholars, practitioners, and policymakers. This is an essential basis to provide the necessary information in allocating and regulating the land value-added accordingly. The study surveyed three suburban districts of Hanoi’s capital, with 524 survey samples. The case study focuses on a road project that is constructed and passes through three of Hanoi’s suburban areas. We collected these samples using the convenience sampling method. The authors chose to conduct a survey among households with land and real estate within a 1 km radius. The purpose of these survey samples is to gauge how the development of transportation infrastructure affects the cost of urban land. Additionally, the study put out seven hypotheses, and the findings indicated that, in line with the authors’ expectations, five of the seven hypotheses were supported. Specifically, land use change and accessibility are the two variables that had the strongest impact on land price changes in the study area, while travel time and development opportunities do not show any influence on land prices. The study’s findings further support the idea that the development of transportation infrastructure in urban periphery has altered the character of land use. The study also provides some policy implications in land price management to regulate and mobilize financial resources from land generated by infrastructure development.
Plain language summary
The purpose: This study explores the impacts of infrastructure development on urban land prices surrounding that development area. Methods: The study conducted a survey in three suburban districts of Hanoi capital, with 524 survey samples. Conclusions: The appearance of transport infrastructure in urban fringe areas has changed the nature of land use. There are 03 variables “Travel time,”“Accessibility,”“Business opportunities” all positively impact the intermediate variable “Change in land use.” The intermediate variable “Change in land use” has the strongest impact on changing “Land price” in the area. Next is the variable “Accessibility” which also has an impact on “Land price.” Implications: When new traffic infrastructure projects are invested and developed or old projects are upgraded, the number of urban residents increases too quickly. This in turn causes negative effects and impacts on access to land, travel time and business opportunities in urban areas. Limitations: This research model needs to be tested in other research contexts to learn more related content. In addition, future studies should have more comparisons and evaluations with other research units to provide evidence of the increase in urban land value when there are intervention factors.
Introduction
Urban land is the main object and focus of research in modern urban economic theories (Fujita, 1989). Notably, urban land use is involved in the majority of financial allocation decisions of households and organizations (Nuissl & Siedentop, 2021). At the same time, urban land use is a fundamental determinant of the development of urban residents (Tuan & Hegedus, 2022). This development defines the different locations that urban dwellers go to or from and affects productivity, prosperity, and equity (Duranton & Puga, 2015). In common sense, urban land is used in cities (urban areas). Urban land also determines urban activities’ location, forming urban land use models (O’Sullivan, 2012). Furthermore, land used or anticipated to be used for urban activities is another definition of urban land (Qadeer, 1981). Because of this, the determination of urban land is dependent on both the land use functions for socio-economic activities (Rodrigue, 2020) and the current limits of the urban region (Schneider-Sliwa, 2001).
In Vietnam, the 1993 land law has divided land use purposes into six groups, directly mentioning the urban land group (Article 11) and defining urban land in detail (Article 55) (Nguyen & Hegedus, 2022). However, up to the 2003 and 2013 land laws, legal regulations do not directly refer to urban land when classifying land. The land is separated into three categories: non-agricultural land, underused land, and agricultural land (Tuan, 2022). Urban land belongs to the group of non-agricultural land. Based on the purpose of use, urban land is divided into specific types of land, such as residential land in urban areas, land used for embellishment and urban development, land for construction of office buildings and non-business works in urban areas, and land used for planned urban functions. Accordingly, within the scope of this study, urban land is defined as a land fund, including the entire land area in the planned areas that will become urban areas and the existing urban land area to continue to be invested and developed.
Meanwhile, most economists and planners determine that infrastructure includes road systems, airports, hydroelectric power networks, oil and gas pipelines, wastewater supply and drainage works, health and housing services, urban services, and telecommunications networks (Kumari & Sharma, 2017; Straub, 2011). Accordingly, investment in infrastructure development is related to one of the abovementioned factors (Grimsey & Lewis, 2002). There is one common point that researchers agree on when evaluating the role of infrastructure. Infrastructure is an essential economic input factor and provides primary conditions for individuals, households, and businesses (Torrisi, 2009). At the same time, the infrastructure classification can be divided into two primary groups. They include transportation infrastructure and social infrastructure. While transportation infrastructure includes elements that contribute to the production and economic activities (such as transportation, communications, electricity, and irrigation), social infrastructure includes factors that facilitate social development and improve the quality of life (such as education, health care, clean water, sanitation, and environment; Kumari & Sharma, 2017). Therefore, in urban areas, infrastructure is a complex, continuous system of technical works to serve economic activities and people’s livelihoods (L. Wang et al., 2018). From the above analysis, transportation infrastructure development in this study is understood as investment activities aimed at increasing the quantity or improving the quality of technical works. Specifically, road traffic projects serve economic activities and people’s livelihoods of urban areas.
Practice in Vietnam shows that investing in the development of transport infrastructure or project development during the urbanization process has many impacts on land value (Thuy et al., 2020). However, the distribution of benefits among stakeholders is ineffective and lacks fairness (Tuan, 2023). This issue increases land-related disputes. Specifically, businesses or land users exploit most of the increased land value. However, this added value needs to be mobilized and regulated back into the state budget to compensate for the investment capital cost of transport infrastructure projects. Therefore, “From the perspective of land users, how does transportation infrastructure affect urban land prices?” is the topic this study aims to address. A review of the literature on the mechanism influencing land price while investing in transportation infrastructure will be the next section of the article. In this overview, the authors discuss the term “accessibility” and define what accessibility is. The authors then review some of the reasons why transport infrastructure investment affects land price changes through land accessibility. These reasons include travel time, distance, and land use potential. We also discuss the research model, including the proposed hypotheses and research site, before presenting the research outcomes. Lastly, the study will include analyses and findings pertaining to the research topics. This study provides reference materials for state management agencies to continue researching and innovating state management of land prices and land valuation.
Mechanism of Impact on Land Price Changes When Investing in Transport Infrastructure: Research Overview
Transport infrastructure development is closely related to socio-economic changes and land value in the area where infrastructure works are invested (Prus & Sikora, 2021). The process of planning and investing in new transport infrastructure will bring the potential to improve access to transport facilities and utilities of land users (current and new land users) (Setboonsarng, 2005). Because of the improvements in regional amenities and accessibility brought about by transportation infrastructure, land users’ land will be capitalized into land value (Yen et al., 2020). This is the increased land value, expressed through the market change of land/real estate prices. It can be seen that many studies are referring to the impact of infrastructure on land use and land prices, in which measuring the accessibility of land to infrastructure is an essential factor (Henneberry, 1998). When relating changes in urban infrastructure to accessibility measurements, Geurs and van Wee (2004) looked at various metrics. According to the findings of that study, accessibility is a crucial factor in determining how land prices change.
Accessibility is a term that was first used in 1920 in location theory (Batty, 2009). The idea has been extensively employed in social scientific research since the 1950s, particularly in the fields of urban planning, transportation, economic geography, and marketing. Numerous interpretations exist for this idea as well (Malekzadeh & Chung, 2020). Therefore, defining and measuring accessibility is complicated (Handy & Clifton, 2001) and depends on the research purpose (Geurs & Ritsema van Eck, 2001). L. Yang et al. (2018) have compiled some different definitions of accessibility by previous researchers. Activities that can be accessed from a fixed place can be included (Geurs & Ritsema van Eck, 2001). The degree to which land use and transportation systems permit individuals or groups of people to travel to locations or hubs for activities is often referred to as accessibility (Geurs & van Wee, 2004). It is also defined as the ease of traveling to a particular destination of interest (Sun et al., 2017). In the most general sense, accessibility can be understood as the potentiality of interaction opportunities (Hansen, 1959).
Furthermore, the advent of transport infrastructure reduces travel time from one place to another (Skorobogatova & Kuzmina-Merlino, 2017). From an economic point of view, the most important feature of transport infrastructure is the public nature of the services it provides (Kadyraliev et al., 2022). It affects the economy and society by facilitating the movement of people and goods (Zhang & Cheng, 2023). The changes taking place due to infrastructure development are promoting connectivity between less developed areas and areas with higher economic activity (Du et al., 2022; Meersman & Nazemzadeh, 2017). Transport infrastructure, if properly developed, can have a stimulating effect on a given area, leading to increased economic activity and environmental competitiveness (Lenz et al., 2019; Palei, 2015; C. Wang et al., 2020). On a regional scale, the state of the road infrastructure and its compatibility with major transport routes are essential conditions for the area to be attractive to potential investors (Ng et al., 2019). In other words, the development of transport infrastructure also creates many opportunities for development investment and employment (Sobieralski, 2021). Many researchers believe that infrastructure development can significantly improve a country’s economic performance, as seen in China (Chen, 2023) and sub Saharan Africa (Abdullahi & Sieng, 2023; Ssekibaala et al., 2022). Meanwhile, some other scholars believe that countries like Greece, Spain, and Portugal are in economic recession due to insufficient investment in infrastructure development (Serven & Calderon, 2004).
In addition, it is believed that transportation infrastructure gradually shapes land use (Su et al., 2014). With the improvements in transportation, a trend of fragmentation of land use patterns has emerged (Hadi et al., 2021), and urban land use efficiency has also shown a decreasing trend (X. Yang et al., 2017). These changes include an increase in built-up area and a decrease in agricultural land area. However, the impact of infrastructure development on land use may not always be immediate or significant in the vicinity of the infrastructure (Navalkar et al., 2023). Land use changes may occur at greater distances from infrastructure, but the presence of infrastructure still has a significant impact on land prices in nearby settlements.
In general, the impact of urban transport infrastructure development or investment on urban land price changes through changes in land accessibility is due to several reasons. Firstly, renovating existing traffic works or developing new investments in traffic infrastructure works will shorten the travel time of land users (Koh & Lee, 2020). This improvement reduces transportation costs and impacts increasing land values around the area of the transport facility. Second, traffic facilities are developed and invested to reduce the distance. Since then, the accessibility to central locations and urban amenities has improved (Elldér et al., 2022). Depending on land user assessment, the central locations, and urban utilities will be determined differently. Usually, the central locations and utilities are commercial centers, workplaces, parks, schools, hospitals, open spaces, administrative areas, and public places. Third, the development of transport infrastructure will have potential in land use due to opportunities for economic development, development of the land, and real estate market (Lu et al., 2021). This is due to increased expectations about land uses and business opportunities related to land and real estate. Accordingly, the intensity and purpose of land use will be enhanced due to the increased land demand due to population attraction and socio-economic activities.
Overall, studies indicate that the impact of transport infrastructure development projects significantly influences changes in land prices. Methods for measuring the impact of transport infrastructure on land prices often use three analytical techniques. The first is Hedonic, in which the dependent variable is the price of real estate and the explanatory variables include the properties of the real estate (Li & Huang, 2020; McIntosh et al., 2014; Munoz-Raskin, 2010; Pan, 2019). The second method involves controlling and comparing time series data to analyze changes in the real estate price index in each area over the years (Jun & Kim, 2016). In addition, to assess the impact of infrastructure investment on urban land use, it is possible to apply techniques to measure density and diversity in land use (Pagliara & Papa, 2011; Panchapagesan et al., 2021; Wagner et al., 2017).
According to the research overview, the authors propose research hypotheses in Table 1. These studies aim to measure factors based on the perceptions and assessments of land users. This is a shortcoming in previous studies, which did not measure factors from the perspective of land users.
Research Hypothesis.
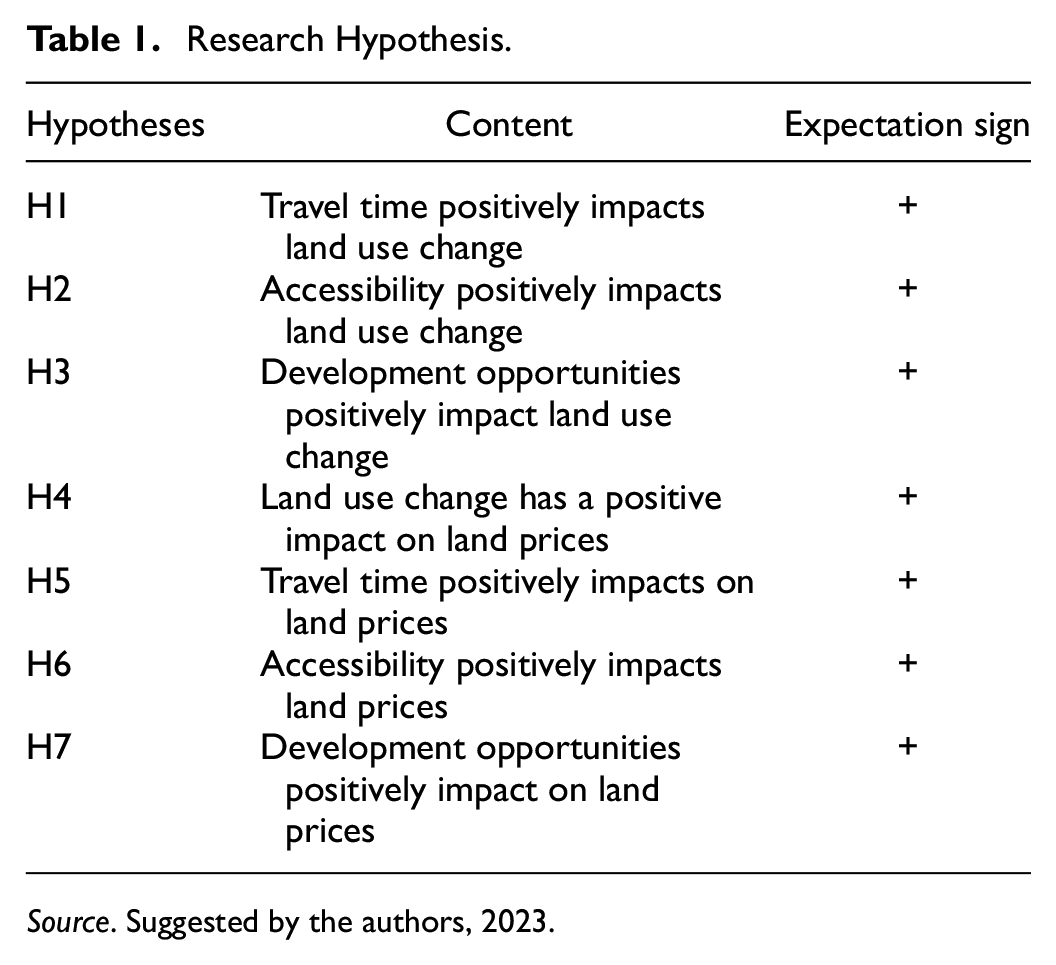
Source. Suggested by the authors, 2023.
Methodology
Introduction of Case Study
Vietnam’s largest centrally administered city is Hanoi, which has a population of 8.4 million as of 2022 and an area of more than 3,300 km2. In addition, of the 63 administrative divisions at the provincial level in Vietnam, this city has the second-highest population density and the second-most populous status. Since the beginning of Vietnamese history, Hanoi has served as a critical hub for politics, the economy, and culture. Being the capital, Hanoi is home to numerous significant sports, entertainment, and cultural venues. In 2022, Hanoi contributes nearly 13% of the country’s GDP, 43% of GRDP and 43.8% of the Red River Delta’s budget revenue (Ha, 2023). Hanoi capital has focused on promoting economic growth and speeding up the recovery of tourism, culture, and social security, so many areas have developed and maintained the pace. In particular, the investment in road development has contributed to this capital’s economic development. The expanding inner city area and the urban chain east of Ring Road 4 are home to the Le Van Luong—To Huu route, as per the capital’s general building plans through 2030 with a vision to 2050. Specifically, this route passes through the Nam Tu Liem, Thanh Xuan, and Ha Dong districts. Around this area is developed with high density, saving land. This is also an area with high-rise space. From there, it creates a modern urban image for the extended inner city.
Data Collection and Research Model
The authors developed a survey questionnaire based on study hypotheses and a review of the literature on the effect of infrastructure investment on urban land value. The questionnaire consists of two parts, including the personal information of survey respondents and their assessments of the impact of infrastructure on changes in residential land prices in the area. To find out how infrastructure investment affects the prices of urban land, the study used Hair et al.’s (2021) formula, which says that n = 10 × 16 samples, where 16 is the number of independent variables in the model shown in Table 1. Moreover, before the official survey was implemented, the authors conducted a pilot survey with 40 questionnaires. The surveyed subjects are land users in the study area. The authors synthesized and analyzed the survey samples and adjusted some spelling and punctuation errors to complete the questionnaire to serve the official investigation. To conduct the official survey, the authors guided and trained a group of students to support the survey process. This group comprises four final-year students majoring in Real Estate and Land Administration at National Economics University. The survey was carried out directly in three districts where the project passes. The survey period was carried out from November 2022 to January 2023. The group selected convenience sampling as their sampling method. This is a sampling method in which the researcher simply selects a characteristic relevant to the study and conducts surveys with accessible individuals. To collect survey results, the group selected households with land and real estate within a 1-kilometer radius. The survey team surveyed 608 samples, and after removing 84 missing questionnaires, the final number of research questionnaires used for analysis was 524 valid samples. These are answer sheets with enough information regarding changes in land prices in the area. This sample size satisfies the minimal requirement for the quantity of samples suitable for PLS-SEM analysis. Statistical results of the survey form appear in Appendix 1.
Collected data was entered into Excel software, using the Countif function to calculate the number of respondents with the same content. In addition, the authors also used SPSS software for descriptive statistical analysis. Using SmartPLS software, the authors tested the hypotheses in the research model. Indicators on the impact of infrastructure development on land price changes in the area are also coded in Appendix 2. The authors used quantitative research methods and PLS-SEM techniques to analyze the relationships among factors in the model. This statistical modelling method has the advantage that it explains relationships between multiple variables at the same time. Before testing scientific theories, it is necessary to evaluate the reliability and validity of the scale. This study employed the Cronbach alpha method to evaluate the scale’s reliability. We also used exploratory factor analysis (EFA) to assess two important types of scale validity: convergent validity and discriminant validity. We used confirmatory factor analysis (CFA) to assess the overall fit of the data based on model fit indices. This type of structural equation modeling is specifically related to measurement models. They include the relationship between observed measures, or indicators, and latent variables, or factors. The CFA tool serves to validate or challenge measurement theory. The results of the CFA test help to assess the convergent and discriminant properties of the structural theory. Specifically, the steps the group took were as follows:
Step 1: The descriptive statistics method.
In this step, the authors described the sample to gain a comprehensive understanding of the research.
Step 2: Exploratory factor analysis (EFA)
EFA aids in considering the possibility of reducing the number of observed variables to a smaller number. From there, it is straightforward to consider the relationship between the factors. The criteria for EFA include KMO coefficients ranging from 0.5 to 1. With a significance level of less than 0.05, the Barlett test demonstrates statistical significance. Furthermore, the retained factors must have an Eigenvalue >1, a percentage of variance >50%, and a factor loading >0.5.
Step 3: Use SmartPLS to evaluate the model’s measurement results and causes.
To evaluate the model using SmartPLS, the team assessed the reliability of the scale through 3 indexes, including CR, AVE, and Cronbach’s alpha. Then, the group tested convergent validity with two criteria: outer loading and AVE. The group also tested discriminant validity using cross-loading, the Fornell and Larcker criteria, and the HTMT index. Finally, the authors evaluated the impact relationships based on the results of the Bootstrap analysis. This testing step helps the research team conclude the hypothesis of the impact relationships in the topic model.
Research Results
The Results of Measurement Test
The results of running Cronbach’s alpha of the measures show that most of them satisfy the conditions in measuring variables because the observed variables have total variable correlation coefficients, all reaching values greater than 0.3 (Table 2).
Results of Running the Measure of Observed Variables.
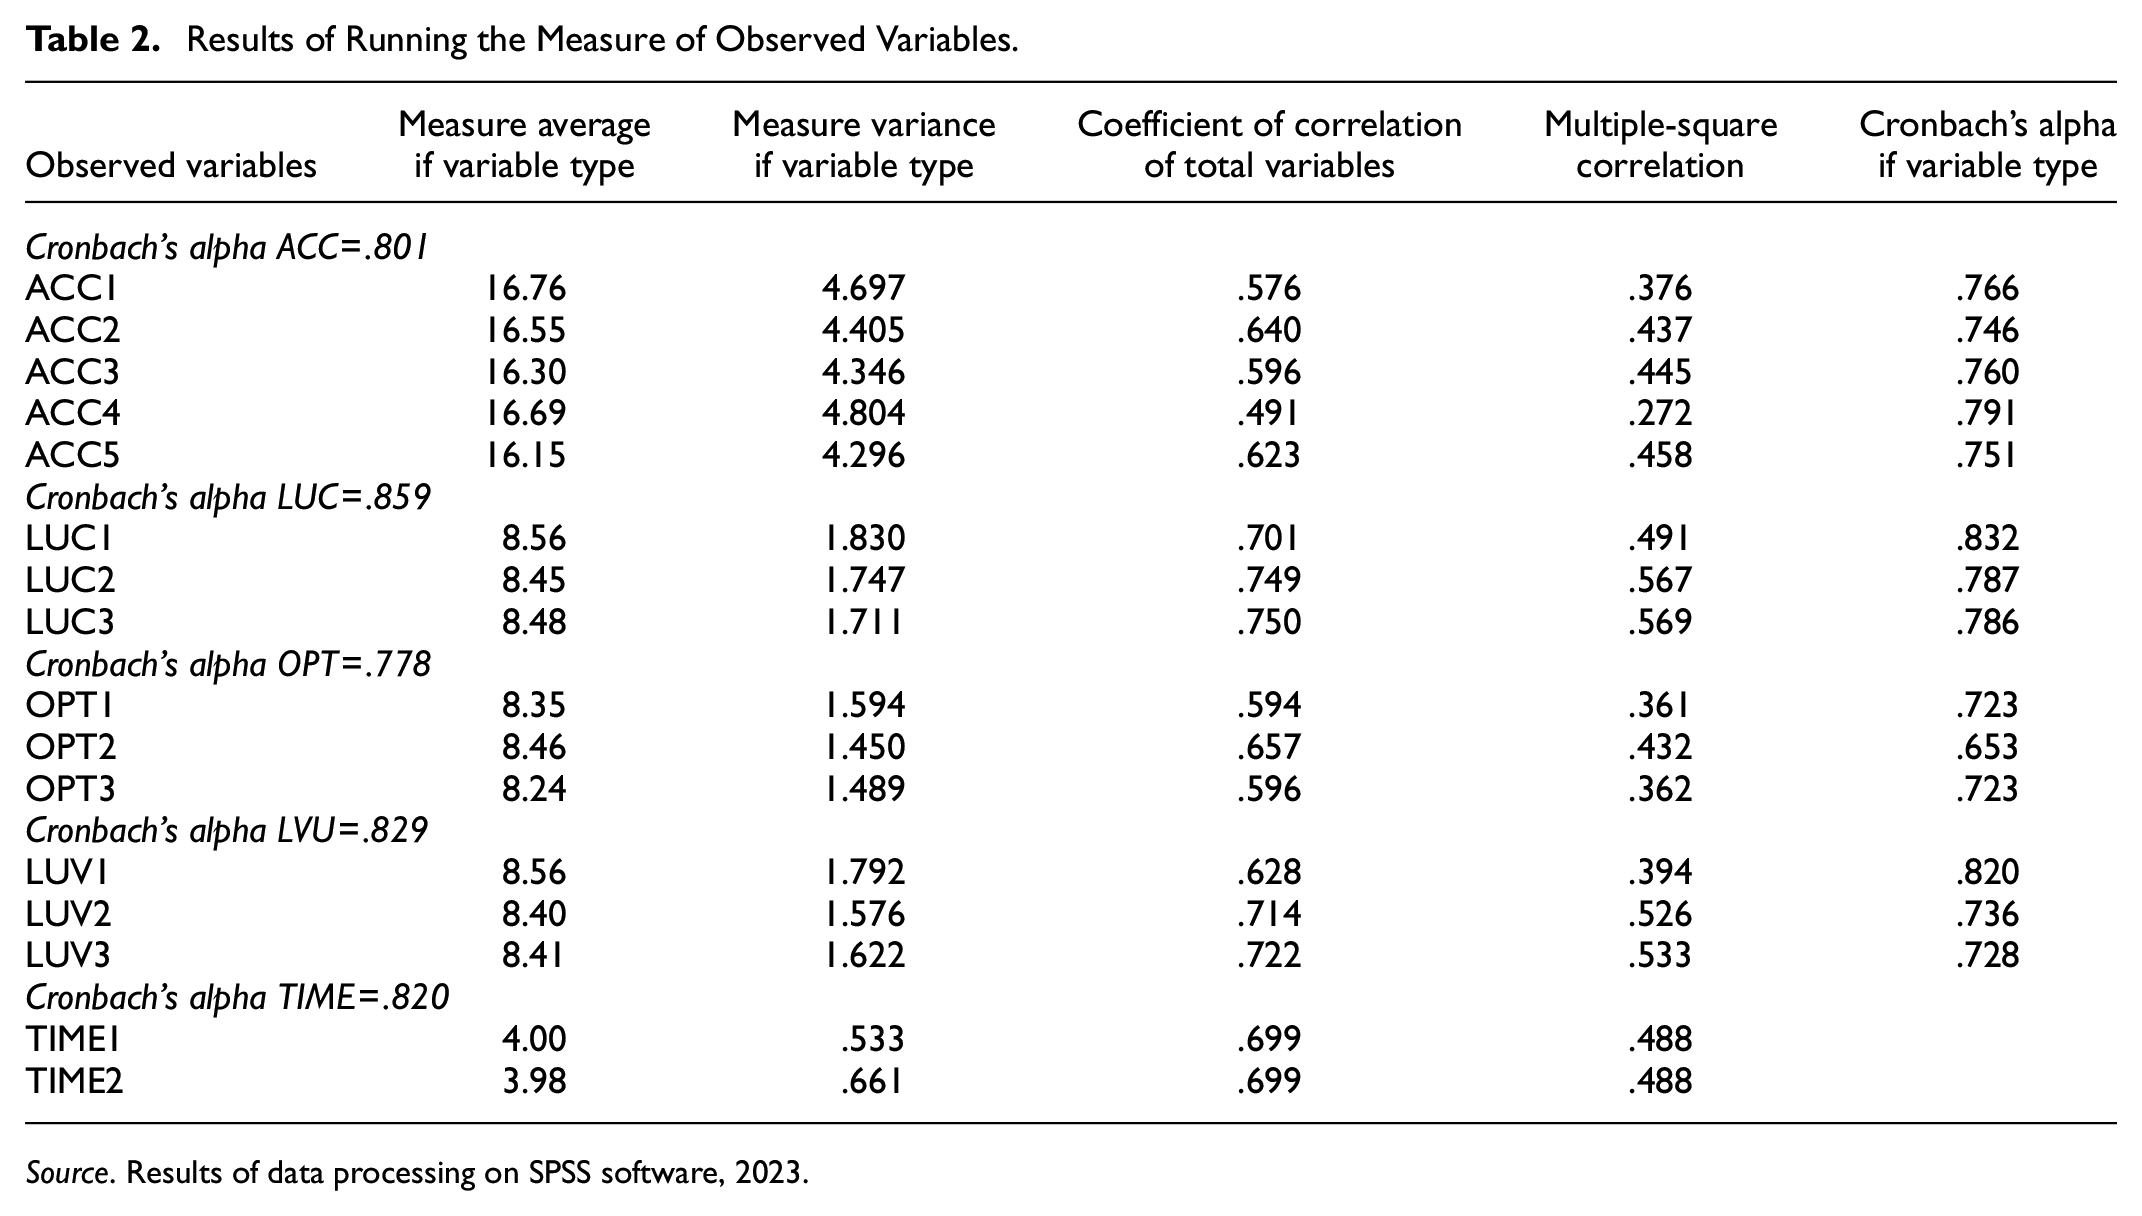
Source. Results of data processing on SPSS software, 2023.
However, when considering the composite reliability (CR) in Smart PLS, the ACC4 indicator does not guarantee the condition because of the outer loadings coefficient <0.7 in the convergent analysis (Table 3). Accordingly, the authors excluded this indicator for further analysis. The convergent validity test findings reveal that all external factor loadings were more than 0.708 after the ACC4 indication was removed. This means that the latent variable in the study explained more than 50% of the variation in the observed variable, and the observed variable was of good quality. The Average Variance Extracted (AVE) indexes (Table 4) are all 0.5, which is satisfactory.
The Results of Outer Loading-Matrix.

Source. Results of data processing on SmartPLS software, 2023.
Reliability Assessment Results of CR.

Source. Results of data processing on SmartPLS software, 2023.
The results of the scale reliability assessment were evaluated through three indexes: CR, AVE, and Cronbach’s alpha coefficient (Table 4). Hair et al. (2021) state that the scale is considered reliable if the Cronbach’s alpha coefficient >0.6, the AVE is significant when the value is above 0.5, and the CR is significant when the value is larger than 0.5. Also, the Cronbach’s alpha test coefficient >0.6 and the values of CR and AVE are greater than 0.5. This suggests that the scale is trustworthy.
The authors assessed the discriminant validity using the test findings for discriminant validity and took the observed variables’ cross-loading coefficients into account. Specifically, the measurement variable’s factor loading coefficient must exceed all cross-loading coefficients of the other study concepts. Following the results of the cross-loading coefficient analysis (Appendix 3), the factor of the measured variable is more prominent than all cross-loading coefficients of other research concepts. In addition, the coefficients used in the Fornell and Larcker criteria are satisfactory (Table 5).
Results According to Fornell and Larcker Standards.
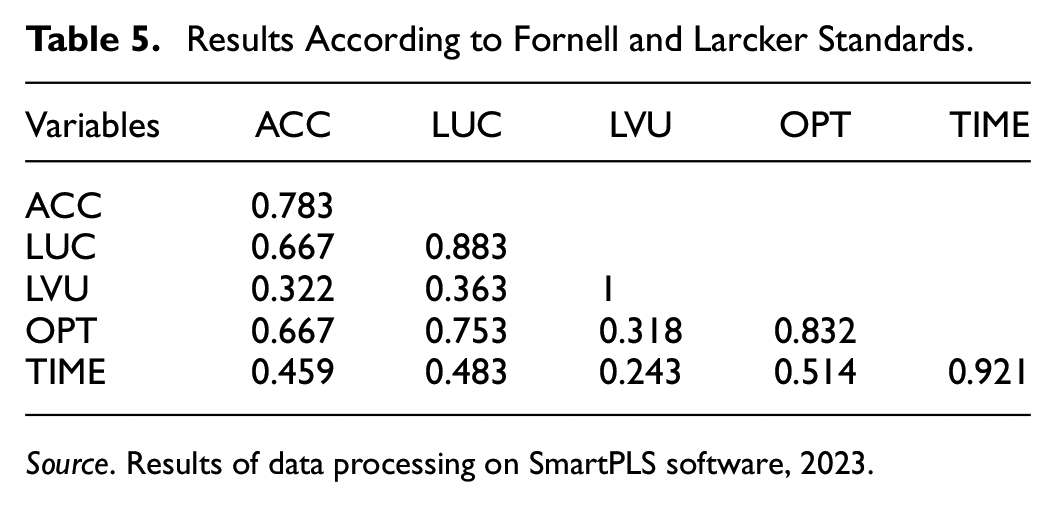
Source. Results of data processing on SmartPLS software, 2023.
The Results of Structural Equation Modeling (SEM)
The project implements non-parametric Bootstrap analysis techniques to test the hypotheses and specifically estimate the relationship between variables in the model. The model can be practically tested by resampling. The strategy of resampling using an alternate approach is called bootstrap. In PLS-SEM, bootstrap is used to generate confidence ranges for each parameter estimate, laying the groundwork for subsequent statistical inference. Every Bootstrap template’s model path is estimated using PLS-SEM. One way to think of the Bootstrap distribution formed by the path model coefficients is as an approximation of the sampling distribution. For every bootstrap sample, the PLS-SEM results yield mean values and standard errors for every path model coefficient. The statistical significance of the path model’s link is indicated by the data from the t-test and p-value. Table 6 displays the test results. Conclusions concerning the hypotheses in the study model that follows (Table 7) can be made based on the p-value values in Table 6. Accordingly, 5 out of 7 proposed hypotheses are supported.
Results of Estimating Coefficients in the Model (Bootstrapping PLS-SEM).

Source. Results of data processing on SmartPLS software, 2023.
Conclusions of the Hypotheses in the Model to Evaluate Land Users’ Perceptions.

Source. Results of data processing on SmartPLS software, 2023.
The SEM model results are shown path values and p-value are shown in Figure 1.

The results of SEM.
Following the multicollinearity phenomenon’s examination, the model’s variables are determined to be assured (VIF < 2). Thus, the model does not have multicollinearity (Appendix 4). The authors consider R2 value. The closer the R2 value is to 1, the more accurate the prediction is. However, determining how much R2 is complex and depends on the research environment and model. In Table 8, the R2 values for LUC and LVU are 0.621 and 0.147, respectively. That is acceptable according to Chin’s (1998) recommendation. The f2 coefficient results table is used by the authors to assess the impact coefficients of the model’s variables. The results show that only the OPT variable strongly influences the LUC (intermediate variable) because f2 > 0.36. In contrast, the remaining variables affecting LUC are small (due to f2 < 0.36). Meanwhile, the independent and intermediate variables (LUC) affect the LVU (dependent variable) at an average and minor level.
Evaluation Results of R-squared and f-square.

Source. Results of data processing on SmartPLS software, 2023.
Discussion and Policy Implications
Transport infrastructure plays an important role in the economic and social development of each country. Socio-economic development has consistently accelerated urbanization in various localities. In urban areas, the process of investing in the development of transport infrastructure is a regular, continuous, and proactive task. In recent years, Vietnam’s urban areas have witnessed the implementation of numerous large-scale infrastructure development projects, encompassing both capital and land use scale (Lan et al., 2022). The study’s findings have highlighted a significant point from the perspective of land users.
In this study, an interesting point is that two hypotheses (H5 and H7) were not supported. These two hypotheses go against the authors’ expectations and arguments mentioned in several previous studies. Specifically, in the case study, travel time and development opportunities are not determined to affect urban land prices. An explanation of this point can be seen that, at the time of the survey, this area has developed the scale of real estate projects (high-rise buildings). This leads to an overpopulation, which puts pressure on the technical and social infrastructure of the whole region. Therefore, despite the development of road traffic infrastructure projects (at the time of the survey), travel time had remained the same. According to records, land users have evaluated and reported that the area always has traffic jams and takes much time to travel on this road. On the other hand, this area shows signs of overcrowding and development disrupting urban planning, so the business opportunity in real estate could be more appreciated. There is a phenomenon that real estate investors (individuals) tend to move their investments to other areas and locations.
In addition, land in urban areas constantly moves and shifts during socio-economic development. The need to use urban land for activities becomes more incredible during the campaign. This causes the value of urban land to increase. In addition, a variety of other factors, including the state’s influence, land users’ investments, and real estate development companies, also have an impact on the value of urban land. Policy implications stem from the need to adequately address the relationship between population increase and the infrastructure investment process in metropolitan areas, as indicated by the research’s findings. If this issue is resolved, it will help to enhance land accessibility and decrease travel time brought on by road construction projects. Newly invested in traffic infrastructure projects or upgraded old ones have led to a rapid increase in the urban population. This causes adverse effects and impacts land accessibility, travel time, and business opportunities in urban areas due to overcrowding and urban traffic congestion. Besides, the State should promote the investment process for urban infrastructure development. This investment should focus on upgrading infrastructure systems in existing urban areas and effectively developing new infrastructure in areas that will become urban areas. Therefore, to solve this relationship, it is necessary to implement solutions such as (1) calculating, forecasting, and determining the future urban population growth and (2) performing efficiency assessments based on cost-benefit analysis for urban infrastructure investment projects.
Although the study has shown some empirical results in Hanoi, it still has some issues that need to be resolved for future research. Measures for survey data are based on the recommendations and measures of previous studies. These metrics are calibrated and applied in the context of a specific project in the urban area of Hanoi. However, these measures need further confirmation in research contexts in urban areas other than Hanoi. Accordingly, this research model must be tested in other research contexts to learn more related content. In addition, future studies should have more comparisons and evaluations with other research units to provide evidence of the increase in urban land value when there are intervention factors. They can be surveys and impact assessments from the perspective of other groups, including development investors and land brokerage consultants. Future research should also analyze the increase in land value with other uses, such as commercial and industrial land.
Conclusions
In practice, the state budget often provides the majority of funding for the development of Vietnam’s transport infrastructure in urban areas. The implementation of traffic infrastructure projects had a significant impact on all facets of economic and social life. Notably, infrastructure development has a positive impact on land and real estate prices in the area through which the project passes. In recent years, land finance policies have changed to mobilize capital for infrastructure development investment or to compensate those affected by infrastructure development. However, the distribution of benefits among stakeholders is inefficient and unfair. This increases disputes and complaints in the land sector, causing social instability in Vietnam’s urbanization process. The study used 524 survey samples in three suburban districts of Hanoi’s capital city. The case study focusses on a road project that traverses three suburban districts of Hanoi. These are three districts receiving large investments from local authorities in infrastructure development. The research findings also answered the research questions.
Research results from a model measuring the impact of transport infrastructure development on urban land prices from the perception of land users have confirmed 5 out of 7 initially proposed hypotheses. Accordingly, there are three variables, “TIME,”“ACC,” and “OPT” that all positively impact the intermediate variable “LUC.” It can be affirmed that the appearance of road traffic infrastructure in urban fringe areas has changed the nature of land use. The intermediate variable, “LUC” has the most substantial impact on land price changes in the area. Next is the variable “ACC” which also impacts land prices. This is consistent and supported in theories of land and real estate economics.
Footnotes
Appendix
VIF Coefficient.

| Indicators | Coefficient VIF |
|---|---|
| ACC1 | 1.562 |
| ACC2 | 1.676 |
| ACC3 | 1.799 |
| ACC5 | 1.769 |
| LUC1 | 1.966 |
| LUC2 | 2.309 |
| LUC3 | 2.318 |
| OPT1 | 1.565 |
| OPT2 | 1.76 |
| OPT3 | 1.566 |
| TIME1 | 1.954 |
| TIME2 | 1.954 |
Source. Results of data processing on SmartPLS software, 2023.
Acknowledgements
To complete this study, the authors would like to thank the appraisers and students of National Economics University who supported the authors in collecting research data.
Declaration of Conflicting Interests
The author(s) declared no potential conflicts of interest with respect to the research, authorship, and/or publication of this article.
Funding
The author(s) disclosed receipt of the following financial support for the research, authorship, and/or publication of this article: This research is funded by National Economics University, Vietnam.
Ethical Approval
This study did not perform research on humans or animals.
Data Availability Statement
Due to privacy concerns and ethical restrictions, the data collected in this study cannot be made publicly available. We respect the privacy rights of individuals involved and have taken measures to ensure that the data are protected. Access to the data may be considered on a case-by-case basis, under strict confidentiality agreements, and with the approval of the relevant institutional review board.