
Abstract
This paper conducts a comprehensive cost-benefit analysis of nuclear energy’s contribution to climate change mitigation, with a focus on its potential to reduce the social cost of carbon (SCC). For 31 countries, we employ a four-step methodology to estimate SCC, comparing it against the lifetime costs associated with nuclear power generation. The Upstate New York case study in 2019 reveals that its three nuclear power plants could save approximately $675 million of the social cost of carbon (SCC) annually. Our SCC analyses suggest that the currently operating nuclear power plants worldwide can save the SCC, corresponding to 2.6% of the United States’ annual GDP. According to our cost-benefit analysis, among several countries that operate nuclear reactors, the US and China exhibit high environmental benefits from nuclear power, whereas other countries earn net environmental losses from it. Our study’s robust data analysis methods ensure the reliability and validity of our conclusions, enhancing the relevance of our findings for informing policy decisions. Despite variations in net benefits influenced by societal SCCs and levelized costs of energy (LCOE), nuclear energy emerges as a crucial component in transitioning to a zero-carbon grid. Our study advocates for the use of SCC analysis to incentivize the adoption of low-carbon energy sources.
Plain Language Summary
This study examines the environmental effects of nuclear power in a straightforward manner. Nuclear power is a significant source of low-carbon energy globally, but its safety concerns have led some countries to avoid it. By analyzing the costs and benefits of nuclear power, the study sheds light on its role in energy transitions. Focusing on a case study in Upstate New York, the research finds that nuclear power plants could save millions annually in the social cost of carbon. The analysis suggests that globally, nuclear power plants can save a substantial portion of the social cost of carbon, equivalent to a notable percentage of the United States’ annual GDP. However, the study reveals that the environmental benefits of nuclear power vary among countries, with some experiencing net losses. Factors such as social costs of carbon and energy costs influence the overall environmental impact of nuclear energy.
Keywords
Introduction
Nuclear energy plays a significant role in the energy transition. Because nuclear power plants emit the least amount of greenhouse gases, such as carbon dioxide, during electricity generation, it can be a tool for mitigating climate change and reducing the social cost of carbon. To minimize the society’s burden of carbon emissions across the European Union, the European Parliament has made a historic resolution to categorize nuclear energy projects as green investments beginning in 2022. The recent expansion of nuclear power generation follows attempts to shift from fossil fuel-based power generation, resulting in several side effects, such as skyrocketing electricity costs and an unstable electricity supply. French President Emmanuel Macron has announced a plan to build up to 14 new nuclear reactors by 2050 to reduce carbon emissions and achieve net-zero carbon by 2050. The move is regarded as a significant shift from France’s previous plans to reduce reliance on nuclear power. Nuclear energies can produce substantial energy while minimizing carbon emissions, serving as an alternative to renewable energies that are still in their infancy or susceptible to instability due to climate and other factors (World Nuclear Association, 2024).
Efforts to reduce nuclear power generation have resulted in a sharp increase in carbon emissions in a short time. For instance, after the Indian Point nuclear reactor shut down in 2020 and 2021 wholesale electrical energy costs increases in New York, whereas carbon emissions increased due to an increased reliance on fossil fuels. Germany has experienced similar tendencies due to starting to retire nuclear services following the Fukushima disaster in Japan in 2011 (Grimes, 2022). Despite global efforts to reduce dependency on fossil fuels, the development has been restricted to a 20% increase in the proportion of renewable energy within the power sector (R. Nordhaus & Lloyd, 2022). Conversely, France, which has continuously expanded nuclear power, emits only approximately 45% of the greenhouse gases emitted by Germany, the largest energy consumer in Europe. Germany’s per capita greenhouse gas emissions were 8.0 tons in 2021, whereas France’s were only 4.5 tons.
We conduct a nuclear energy cost-benefit analysis by comparing the social cost of carbon (saved by nuclear power) to the lifetime cost of nuclear power generation. According to Ricke et al. (2018), the social cost of carbon (SCC) is the economic cost of climate damage caused by an extra ton of carbon dioxide released into the air (tCO2). It represents the monetary value of the negative externalities associated with climate change, including impacts on human health, agriculture, infrastructure, and ecosystems. SCC is estimated through four-step methods: (i) projecting the trajectory of future global greenhouse gas (GHG) emissions; (ii) converting this trajectory into alternate climate change scenarios, including one that adds 1 ton; (iii) calculating the physical impacts of these climate changes on people and ecosystems; and (iv) monetizing these impacts and discounting future monetary damages back to the current period. Policymakers are increasingly using the SCC as a tool for policy benchmarking (Pearce, 2003; Pizer et al., 2014). An important part of a cost-benefit analysis is determining how much the whole economy and major players is damaged by GHG emissions. Translating environmental impacts into standardized monetary terms facilitates cost-benefit analyses that are useful for assessing energy-related policies.
The high SCC motivates the use of low-carbon energy because the estimated benefits of reducing GHGs increase with the SCC, and countries with a higher SCC would find nuclear energy more beneficial. To help policymakers determine the net value of nuclear energy, our study demonstrates how to perform cost-benefit analysis on nuclear energy plant using the SCC framework. Our article mainly provides practical tools that can be used to determine (i) whether a nuclear reactor increases or decreases the total gas emissions, (ii) whether extending the lifespan of nuclear plants is environmentally prudent, and (iii) whether a nuclear plant provides better environmental outcomes than other clean energy sources.
To perform a nuclear energy cost-benefit analysis, we first examine a case of nuclear plants in New York. Our New York case study indicates that nuclear plants can significantly reduce carbon and pollutant emissions, saving approximately $700 million annually. Then, for each country that currently operates nuclear power plants, we calculate the annual avoidable social cost of carbon. According to country-level SCC analysis, India, China, Saudi Arabia, and the United States are consistently among the nations that bear a significant portion of the SCC. Major oil-producing countries, such as the United Arab Emirates, Qatar, and Kuwait, are severely affected by the short-term environmental costs. Conversely, the long-term effects are more significant for big economies such as Japan, France, Germany, and South Korea. It means that the long-term social costs of carbon increases as the economy experiences greater economic productivity.
The upstate New York case study reveals that four nuclear reactors in the region save the public $736 million in environmental costs. The state prevented $675 million of CO2 emissions costs, $23 million of SO2, and $25 million of NOX through the operation of nuclear plants. The plants also saved $13 million in particulate matter emissions costs. The $736 million in social costs represent expenses that society incurs, in addition to the costs borne by the economy for nuclear energy. Environmental costs are distinguished from the direct and indirect economic effects and are even more profound. The monetized environmental benefits of nuclear energy are then analyzed by country. Using 92 nuclear reactors, we find that the United States saves $499 million in SCCs annually. China saves $44 billion SCCs annually by operating 54 reactors. The world saves $581 million annually in SCCs by using 419 reactors. Because the saved SCCs represent only the benefits of nuclear energy, we also analyze its operating costs. The levelized cost of energy (LCOE) is the total cost of building and operating a power plant over its lifetime, measured in a cost per megawatt hour. Japan and China have the highest LCOEs, incurring $61.2/MWh and $49.9/MWh (assuming a 3% discount rate), respectively.
We calculate the net benefit from nuclear energy, defined as saved SCCs minus LCOE. The US earns the highest net benefits from nuclear energy ($639.5/MWh). Positive benefits are also observed in China and India, recording $67.4/MWh and $5.3/MWh, respectively. Conversely, other countries experience net losses rather than net benefits from nuclear energy. For instance, South Korea has the largest environmental losses (e.g., −20.7 dollars/MWh) of nuclear energy, which is presumably due to the low SCCs ($18.7/MWh). Additionally, Japan reports net environmental losses (e.g., −12.7 dollars/MWh), possibly due to relatively high LCOE ($61.2/MWh). The environmental costs and benefits of nuclear energy may range significantly between locations, according to our analyses. The net benefit of nuclear energy varies greatly by nation and is determined by various factors, including societal costs of carbon and levelized energy costs.
Our estimation of avoidable SCC is expected to provide valuable policy benchmarks. To the best of our knowledge, this is the first cross-country study that simulates the monetized benefits of nuclear energy. There are raging debates within climate circles over the role of nuclear power in transitioning to a zero-carbon grid. Nuclear power, according to some researchers, is a reliable source of clean energy that can be used along with wind and solar power. “If the goal is to transition to 100% zero-carbon electricity,” said Melissa Lott, director of research at Columbia University’s Center on Global Energy Policy, “closing zero-carbon resources does not make much sense.” (Storrow, 2022). Others, conversely, consider nuclear energy as, at best, a short-term climate solution. The Fukushima Daiichi accident and public acceptance in certain countries continue to cast a shadow over nuclear power’s prospects (International Atomic Energy Agency, 2021).
By considering both the benefits and costs of energy, our study contributes to the extant literature on how the policy makers can make more informed decisions regarding cleaner energy based on cost analysis. The importance of energy costs in decision-making is underscored by multiple studies (Boccard, 2014; Hansen, 2019). According to them, the LCOE method has assisted the European Union in determining how to pay for subsidies for renewable technologies and how much to charge for CO2 emissions based on the difference between renewable and fossil resources. Our approach that incorporates both the benefits (i.e., saved social costs of carbon) and costs (i.e., LCOE) of energy would help policy-making bodies. By comparing the social costs of carbon emissions with the LCOE of energy from different sources, policymakers can determine the appropriate level of taxes or subsidies needed to incentivize the use of lower-carbon energy sources. For example, if the LCOE of nuclear energy is higher than that of fossil fuels, but the social costs of carbon emissions from fossil fuels are higher, then policymakers can implement a tax on carbon emissions to level the playing field and incentivize the use of nuclear energy.
In addition, we offer potential solutions to the debate over nuclear energy. Recent studies focus on nuclear power’s role in achieving sustainable energy systems (Bandyopadhyay et al., 2022; Y. Li et al., 2022; Naimoğlu, 2022). They all highlight the potential of nuclear energy to provide low-carbon electricity, which can help reduce GHG emissions and mitigate the impacts of climate change. Conversely, other studies are still concerned about public resistance to nuclear risks (de Groot et al., 2013). Our study provides quantitative analyses that can help bridge the gap between supporters and opponents of nuclear energy. By providing a comprehensive and objective evaluation of its advantages and disadvantages, quantitative analyses of its environmental benefits and costs can help find a middle ground between conflicts on nuclear energy. We provide a monetized assessment of the GHG emissions associated with nuclear energy production compared to other energy sources, such as fossil fuels, by using the concept of the social costs of carbon. In addition, we evaluate the economic costs and benefits of nuclear energy. This includes the costs of construction, maintenance, and decommissioning, as well as the economic benefits of reduced GHG emissions and increased energy security. This can help provide a comprehensive picture of the costs and benefits of nuclear energy and inform policy decisions.
Literature Review Related to the SCC
Environmental pollution and socio-economics are interconnected, each influencing and being influenced by the other. Environmental conditions are influenced by socio-economic factors. Wealthier countries and communities frequently have the resources to invest in cleaner technologies and enforce stricter environmental regulations, whereas poorer countries may prioritize economic growth over environmental protection. Conversely, environmental pollution impacts socio-economic conditions. Poor environmental conditions can result in health problems, affecting labor productivity and increasing healthcare costs. Additionally, environmental pollution can negatively impact sectors like agriculture and fishing, altering the economic livelihoods of communities.
Studies on the relationship between environmental pollution and socio-economic factors encompass two main research areas. One area suggests that socio-economic factors cause environmental pollution, while the other analyzes the socio-economic impacts of environmental pollution. Researchers explore how socio-economic factors, such as industrial activities, population growth, and consumer behavior contribute to environmental pollution. For instance, Esmaeili et al. (2023) explore factors impacting environmental degradation in energy-intensive countries. The finding that economic policy uncertainty and trade openness affect ecological footprint negatively in the short run but positively in the long run. Balsalobre-Lorente et al. (2024a) suggest an inverted U-shaped relationship between economic complexity and pollution factors in G-20 countries, with economic policy uncertainty positively affecting pollution. Balsalobre-Lorente et al. (2024b) highlight the importance of improving renewable energy sources and innovation processes to accelerate sustainable development in G-7 countries.
Another research stream focuses on analyzing the socio-economic impacts of environmental pollution (Adler et al., 2020; Alpino et al., 2023; J. Li & Ho, 2022). This involves studying how pollution affects economic factors, such as productivity, healthcare costs, and the viability of sectors like agriculture and fishing. Furthermore, they consider the role of governmental policies and regulations in mitigating these impacts and promoting sustainable practices. In economic analysis of climate policies, the SCC is a crucial metric. The financial amount of reduced climate change damages brought on by a reduction of one metric ton of GHG emissions is computed by the SCC. SCC estimations enable policymakers to comprehend the social advantages of lowering emissions of each GHG and the social costs of increasing such emissions. In this study, these figures are called the SCC. The financial cost to society of releasing a modest quantity of that GHG into the atmosphere annually is measured by the SCC (Interagency Working Group, 2021).
Estimating the SCC entails four steps: (i) Projecting the trajectory of future global GHG emissions; this step involves forecasting future GHG emissions based on various factors, including current emission levels, anticipated technological advances, population growth, economic development, and energy consumption patterns. (ii) Converting this trajectory into alternate climate change scenarios, including one that adds 1 ton; once future GHG emissions have been projected, these figures are used to develop different climate change scenarios. These scenarios typically include a “business-as-usual” scenario that assumes no significant changes in current practices and alternative scenarios that reflect possible changes in policy or behavior. (iii) Calculating the physical impacts of these climate changes on people and ecosystems; this step involves converting the climate change scenarios into potential physical impacts, such as changes in temperature, precipitation, sea level rise, and the frequency and severity of extreme weather events. These physical changes are then utilized to estimate the likely impacts on human societies and natural ecosystems, such as impacts on agricultural productivity, human health, and biodiversity. (iv) Monetizing these impacts and discounting future monetary damages back to the current period. The final step involves assigning a monetary value to the physical impacts of climate change. This can be a challenging process because it requires placing a dollar value on things that are not typically bought and sold in markets, such as human health or biodiversity. After monetizing these impacts, they are discounted to the present using a discount rate, reflecting the idea that individuals typically place a higher value on money today than in the future. All four steps are performed by integrated assessment models (IAMs; see, e.g., DICE (4), FUND (5), and PAGE (6)).
One of the earliest and most influential models using this four-step approach is the DICE model (Dynamic Integrated Climate-Economy), developed by William Nordhaus in the 1990s (W. D. Nordhaus, 1992, 1994). 1 However, the evolution and refinement of this approach have been influenced by numerous other researchers, organizations, and governmental bodies, such as the Interagency Working Group on Social Cost of Carbon in the United States. Numerous governmental and international institutions, including the United States Federal Government, the Government of Canada, the International Monetary Fund, and others, have adopted the four-step process for policy-making purposes (Government of Canada, 2024; Greenstone et al., 2011; Griffiths et al., 2012).
SCC estimation is based on key assumptions. Assumptions regarding future climate change policies, their impacts on GHG emissions, and projections for population growth, GDP growth, and technological advancements underlie step (i). In step (ii), a condensed model of the climate system converts emissions into indicators of climate change, such as changes in the global mean temperature. A damage function that connects climate change measures to climate impacts and valuations is necessary for steps (iii) and (iv). The level of human and economic activity exposed to these impacts in the future is frequently projected using demographic and economic assumptions from step (i) and detailed climate impact studies that have been aggregated and extrapolated (Pizer et al., 2014).
While useful in an optimal policy context, a world-level approach to SCC obscures the heterogeneous geography of climate damage and vast differences in country-level contributions to the global SCC, as well as climate and socio-economic uncertainties, which are larger at the regional level. Ricke et al. (2018) calculate country-level contributions to the SCC using socio-economic predictions, actual climate-driven economic damage estimates, and the latest climate model projections. Central specifications exhibit high SCC values on a global scale (median, US$417 per ton of CO2 (tCO2); 66% confidence intervals, US$175–805 per tCO2), along with an unevenly distributed SCC at the country level. The country-level social cost of carbon is illustrated in Figure 1. 2 The figure illustrates that the relative ranking of nations is resilient to several criteria; however, India, China, Saudi Arabia, and the United States are among those that consistently bear a significant portion of the worldwide cost.

Social cost of carbon by country.
Monetizing the Environmental Impact of Nuclear Power
Nuclear Power as a Low-Carbon Energy Source
Approximately 10% of the world’s electricity is produced by nuclear power facilities. Approximately 450 reactors generate nuclear power on a global scale, contributing to the generation of approximately 10% of the world’s electricity or approximately 4% of the total energy supply. More than 91% of the world’s nuclear power generation is attributed to fifteen nations, with the United States contributing approximately 31%. Nuclear power may once again play a significant role in the world’s energy mix due to the demand for carbon-free energy sources, despite the progressive reduction in usage observed in countries such as Germany. More than 50 more nuclear reactors were being built in 2020, with hundred more scheduled, mainly in Asia. Despite the phase-outs scheduled in many nations worldwide, nuclear energy may experience a rebound as nations transition away from fossil fuels and adopt carbon-free energy sources (World Economic Forum, 2022).
Presently, nuclear power is the main low-carbon energy source utilized for electricity generation, succeeding hydropower. Nuclear power stations operate with almost zero emissions of GHGs. Nuclear electricity produces an average of 65 to 66 g CO2 equivalent per kWh of electricity (Lenzen, 2008; Sovacool, 2008). When comparing the two, coal, which continues to be the most significant source of electricity globally, generates 14 to 15 times more CO2 equivalent per kWh of electricity (i.e., 915–1,001 g CO2eq/kWh; de Gouw et al., 2014; Whitaker et al., 2012). Nuclear power has decreased carbon dioxide emissions by over 60 gigatons, or approximately 2 years’ worth of global energy-related emissions, over the last half-century (International Energy Agency, 2019).
Nuclear power plants generated 2,657 TWh of electricity in 2019, 10% of global usage (World Nuclear Association, 2022a). Coal contributed the most (9,914 TWh), followed by gas (6,346 TWh) and oil (6,346 TWh). Fossil fuels supplied 63% (747 TWh). A substitution of 10% of nuclear power’s output with gas, the purest fossil fuel, would have resulted in the emission of 1,300 million tons of CO2 into the atmosphere, which is equivalent to 250 million cars on the road. The CO2 emissions that can be avoided by using nuclear power are detailed in Table 1.
CO2 Emissions Avoided Through the Use of Nuclear Power.

Lifecycle emissions estimates from the Intergovernmental Panel on Climate Change (2014). Estimate of average emissions per vehicle from the EPA.
Monetizing Environmental Benefits of Nuclear Power: Case of Upstate New York’s Nuclear Plants
To assess the economic benefits of nuclear energy in monetary terms, we analyze the case of Upstate New York’s Nuclear Plants. Upstate New York is home to three nuclear plants with four nuclear reactors: Fitzpatrick, Ginna, and Nine Mile Point. These facilities have a combined capacity of approximately 3,300 megawatts (MW) and generate approximately 26 million megawatt hours (MWh) of power annually. Nuclear energy accounts for 15% of the state’s power production and 7% of the total capacity of New York. Upstate New York’s nuclear plants account for 61% of carbon-free generation and 42% of carbon-free capacity in the region west of the North-South Transmission Line in the state’s Load Zone E.
Brattle Group, a company that provides consulting services and expert testimony in economics, finance, and regulation to corporations and public agencies, estimated the economic and environmental impacts of the upstate New York’s nuclear power plants. It was found that in addition to contributing more than $3 billion to the state’s GDP economically, three nuclear power plants also generate significant environmental benefits. It was determined that the three plants avoided almost 16 million tons of carbon dioxide (CO2) emissions annually, which is equal to a societal value of almost $700 million (The Brattle Group, 2016).
Compared to natural gas and coal-fired energy alternatives, the Upstate nuclear power stations significantly reduce CO2, SO2, and NOX emissions. Without power from the Upstate nuclear facilities, average annual CO2 emissions would increase by almost 16 million tons. This is a significant increase of approximately 27% compared to the current emissions from the electricity sector in NYISO. In the power sector, SO2 emissions would increase by more 3,000 tons, while NOX emissions would increase by more than 13,000 tons. Similarly, NYISO would increase by 4% and 21%, respectively. The particulate matter emissions (PM-2.5 and PM-10) would be 18% and 16% higher in NYISO, respectively. The results are summarized in Table 2. Remember that the beneficiaries of these avoided emissions do not all reside in New York. For instance, CO2 is a worldwide pollutant, and because of New York’s increased fossil output and related criterion pollutant emissions, these pollutants can travel to neighboring states upon leaving their source state.
Emissions Prevented by Upstate New York’s Nuclear Plants (Average Annual, 2015–2024).

The National Academy of Science’s externality estimates for SO2, NOX, PM-2.5, and PM-10, as well as the federal government’s social cost of CO2 emissions ($43.31/ton), were used to calculate the social cost of these emissions. When calculated at these rates, the saved societal cost of CO2 is $675 million, and the avoided costs of SO2 and NOX are $23 million and $25 million, respectively. Particulate matter emissions save about $13 million in costs annually. These costs, which reflect environmental and human health damage, are distinct from and supplement the direct and indirect economic effects. The environmental benefits of upstate New York’s nuclear power plants in terms of carbon and pollutant emissions, are detailed in Table 3.
Value of Emissions Prevented by Upstate New York Nuclear Power Plants (Average Annual, 2015–2024).
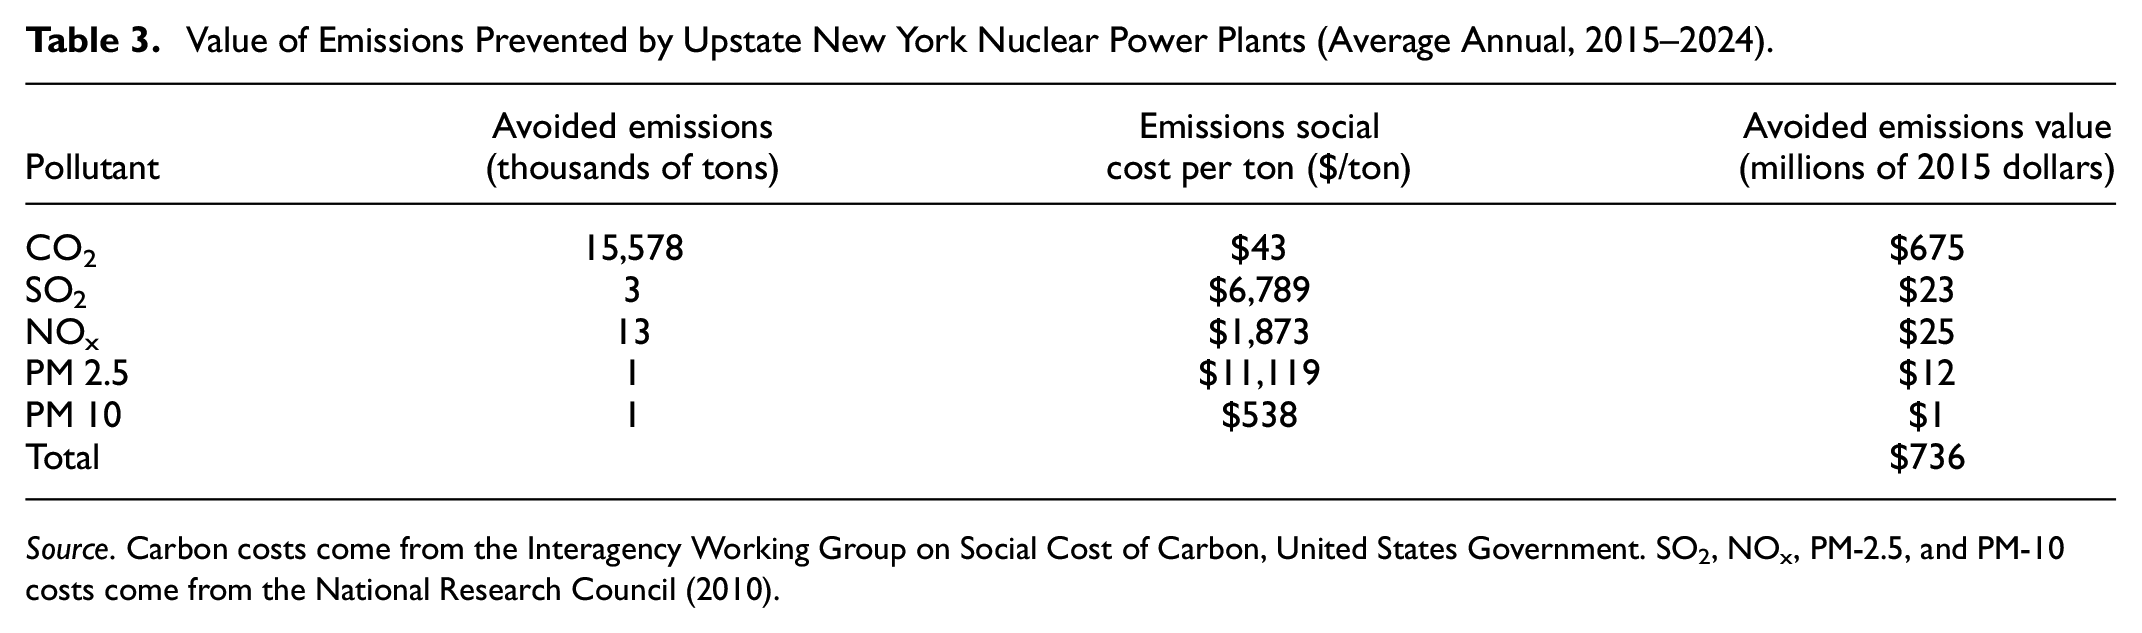
Source. Carbon costs come from the Interagency Working Group on Social Cost of Carbon, United States Government. SO2, NOx, PM-2.5, and PM-10 costs come from the National Research Council (2010).
The four nuclear reactors in upstate New York save $736 million in social costs of GHGs every year. The avoided social cost of CO2, SO2, NOX are as follows: $675 million, $23 million, and $25 million, respectively, as shown in Table 3. The costs of not releasing particulate matter are approximately $13 million. These costs include environmental and human health harm. These are distinct from and complementary to the direct and indirect economic effects associated with nuclear energy. The $736 million in social costs represent expenses borne by the society rather than directly incurred by the economy.
By-Country Analysis of Environmental Benefit of Nuclear Power
Country-Level Social Cost of Carbon
Policymakers are increasingly using the SCC as a benchmarking tool for policy (Pearce, 2003; Pizer et al., 2014). There are numerous policies that may be able to reduce carbon dioxide emissions and slow down global warming. Policymakers use the social cost of carbon to determine whether the costs and benefits of a proposed policy to stop climate change are worth it. In most cases, a higher SCC indicates that the benefits of a specific climate policy to reduce CO2 emissions outweigh its costs, whereas a low SCC suggests that a policy appears to be more costly than the benefits it yields. In theory, the SCC should go up over time because as climate change’s effects increase, physical and economic systems will become more stressed.
Regional governments’ willingness, capability, and actions must continually be emphasized to create the best possible global policy. Member countries are the most important participants in the energy outlook shift because they are the ones who implement changes to operational procedures and accomplish practical implementation. Although global SCCs help determine the best policy options, they can hide the fact that climate damage occurs in different places and to different degrees in different countries. Additionally, global SCCs can hide the fact that climate and socio-economic uncertainties are greatest on a local and regional scale, where most people live.
Our study provides monetized country-level benefits to facilitate regional plans and policy-making. The avoidable SCCs of each country are computed utilizing the per-tCO2 SCCs developed by Ricke et al. (2018). Ricke et al. (2018) quantify country-level contributions to the SCC using the most recent and scientific projections derived from climate models, empirical climate-driven economic damage estimates, and socio-economic projections. Their analyses indicate a high global SCC (median, US$417 per tCO2; 66% confidence intervals, US$177–805 per tCO2) and an unequally distributed country-level SCC.
Building upon Ricke et al.’s (2018) country-level SCCs, this section aims to calculate the environmental benefits of nuclear energy. These benefits are defined as avoidable SCCs resulting from the use of nuclear energy instead of fossil fuels. Although the Brattle Group’s analysis of New York’s nuclear plants covers GHGs other than CO2 such as SO2, NOx, PM 2.5, and PM 10, this section focuses on CO2. This is due to the absence of country-level social costs estimates for those emissions. However, as demonstrated in the New York case study, 92% (=$675÷$736) of the total environmental costs associated with GHGs incurred by CO2, thereby supporting the external validity of CO2 analysis. The relative ranking of countries in their SCCs per tCO2 both in the short and long run are presented in Table 4 (Ricke et al., 2018).
Top 20 Countries With the Highest Levels of SCCs per tCO2.

Note. This table reports the estimated median per-tCO2 SCCs by country using Burke–Hsiang–Miguel (BHM) damage function and assuming SSP5-8.5 scenario. Data is sourced from Ricke et al. (2018; https://country-level-scc.github.io/explorer/).
Gaps in SCC levels among countries can be attributed to objective factors including differences in economic development, energy sources, industrial activities, and emissions intensity. Government policies, regulations, and investments in clean energy technologies and climate mitigation measures are examples of subjective factors. The US tops both the short-run and long-run SCC rankings due to its large economy and high carbon emissions. Its reliance on fossil fuels and industrial activity contributes significantly to its elevated SCC levels. China, being the leading global emitter of GHGs, accomplishes well in terms of both short-run and long-run SCC levels. Its rapid industrialization and heavy reliance on coal for energy production drive its substantial carbon footprint. India’s burgeoning economy and rapidly growing population result in significant carbon emissions, mainly from industries and transportation. The country’s dependence on coal for energy generation also contributes to its high SCC levels. The oil-rich Gulf countries (Saudi Arabia, United Arab Emirates, Qatar, Kuwait) have high short-run SCC levels due to their extensive reliance on fossil fuels for both energy production and industrial activities. In conjunction with deforestation and land-use, Brazil’s substantial agricultural sector contributes to its elevated SCC levels. Particularly since the Fukushima nuclear catastrophe, Japan’s industrialized economy and reliance on fossil fuels, contribute to its high SCC levels in the short and long run. Canada’s energy-intensive industries, such as oil sand extraction, produce substantial carbon emissions, leading to high SCC levels in the long run. European countries (France, Germany, Spain, Italy, the United Kingdom) have relatively high SCC levels in the long run because of their industrialized economies and energy consumption patterns. Australia’s reliance on coal for electricity generation and its significant emissions from agriculture and land-use change contribute to its high SCC levels in the short and long run. Russia’s reliance on fossil fuels for energy production and industrial activities, coupled with its vast landmass and associated emissions from land-use changes, contribute to its elevated SCC levels.
Overall, the data reveals that countries with larger economies, advanced industrialization, and greater reliance on fossil fuels generally exhibit higher SCC levels. Additionally, elevated levels of SCC are also a consequence of significant agricultural activities, deforestation, and land-use changes in certain regions. Developed countries, specifically those in North America, Europe, and certain regions of Asia, consistently rank high in both short-run and long-run SCC levels due to their energy-intensive industries and carbon-intensive economies. Developing countries with rapidly growing economies, such as India and China, similarly exhibit high SCC levels as they undergo industrialization and urbanization. These patterns highlight the interconnectedness between economic development, energy consumption, and environmental impact, underscoring the importance of international cooperation and concerted efforts to mitigate climate change.
Avoided Carbon Emissions From Nuclear Energy
We estimated the monetized environmental benefits of nuclear reactors at the country level using the country-level SCCs data from Ricke et al. (2018) and the nuclear plants data from the Power Reactor Information System of the International Atomic Energy Agency (IAEA). As of January 2023, there are 422 operational power reactors worldwide, collectively providing a total electrical capacity of 378.3 GW. Furthermore, 57 reactors are under construction, and 103 reactors are planned, with a total capacity of 66 and 105 GW, respectively. Additionally, 325 more reactors are proposed.
The nuclear energy capacity of each country is represented by the total electricity that a country’s nuclear reactors can produce annually. We proxy the capacity with the actual electricity generated in 2021. The second column of Table 5 indicates that the United States has the largest capacity for nuclear power: 731 TW (=730,657 GW). In relation to electricity generation capacity, China follows the United States by generating 383 terawatts a year, which accounts for 5% of the nation’s total electricity consumption (World Nuclear Association, 2022b). France (363 TW), Russia (203 TW), and South Korea (132 TW), alongside the United States and China are ranked top five countries in nuclear capacity. Nuclear power plants have provided 249 TW for the world during 2021, which accounts for 10% of total energy consumption (World Nuclear Association, 2022b).
Importantly, are the carbon emissions avoidable by running the marked capacity of nuclear plants, as detailed in the second column of Table 5. Avoidable CO2 emissions are estimated as Equation 1.

Nuclear Plants Operating in the World.

Following prior studies, we assume that nuclear energy discharges 65 g of CO2 to produce 1 kWh of electricity (Lenzen, 2008; Sovacool, 2008), whereas coal generates 915 g of CO2 (de Gouw et al., 2014; Whitaker et al., 2012). Hence, the avoidable CO2 emissions of 1 kWh of nuclear energy are calculated as 850 g (=915 g–65 g) multiplied by each country’s annual nuclear energy capacity. For instance, the United States could avoid 621,058 tCO2 with nuclear power plants. Similarly, China could avoid 325,724 tCO2 by running nuclear power plants instead of coal.
The annual trends of carbon emissions from nations with large nuclear power capacities are presented in Figure 2. As shown in Table 5, Panel A of Figure 2 illustrates the emission trends of the top 10 countries with the largest nuclear power capacities. The rise in China’s emissions is significant, having risen from less than 1,000 MtCO2 in 1960 to more than 11,000 MtCO2 by 2022. In contrast, the United States witnessed a doubling from 3,000 MtCO2 in the 1960s to 6,000 MtCO2 in 2008, before declining to 5,000 MtCO2 in 2022. The remaining eight countries are not demonstrating a sharp increase; instead, they are maintaining relatively stable levels.

Carbon emissions by country. Panel A. Carbon emissions of nuclear-intensive countries. Panel B. Comparison of nuclear-intensive countries’ emissions with global emissions.
Panel B compares the emission trends of the countries in Panel A with the overall global emission trends. Although global emissions consistently increase, Panel A countries (excluding China) display a relatively stable emission trend. This suggests that countries with larger nuclear power capacities have contributed less to the overall increase in global emissions. It implies that nuclear power generation can contribute to a relative decrease in carbon emissions.
Cost-Benefit Analysis of Nuclear Energy
Country-Level Monetized Benefits of Nuclear Energy
Finally, we present the monetized environmental benefits of nuclear energy in Table 6, defined as avoidable SCCs using nuclear energy instead of fossil fuels. Avoidable SCCs, a proxy of nuclear energy’s environment benefits, are estimated using Equation 2.
Country-Level Monetized Benefits of Nuclear Energy.


Avoidable CO2 emissions are estimated in Table 5 above. Ricke et al. (2018) provide the country-level SCCs, derived using the BHM long-run effects model. The avoidable SSCs are presented by countries in the fourth column. The United States saves 499 million dollars annually using nuclear energy instead of fossil fuels.
By generating 383 TW of nuclear energy, China saves $ 44 million in SCCs. France, which generates 363 TW of power from nuclear plants, saves only $15 million in SCCs annually. Although the total electricity generated by nuclear plants in China and France is comparable, China’s total saved SCCs is much greater than France’s. This is because China has higher SCCs per ton of CO2 (i.e., $136/tCO2) than France (i.e., $48/tCO2). In other words, China has stronger incentives than France to build more nuclear power plants (rather than fossil fuels). Additionally, it suggests that Chinese policymakers will see greater environmental benefits from nuclear energy than French policymakers.
Additionally, a comparison between Canada and South Korea is valuable. Canada produces less electricity from nuclear plants (87 TW) than Korea (i.e., 132 TW). However, Canada’s total saved SCCs are greater (i.e., $4.4 million) than Korea’s (i.e., $2.4 million). This is because Canada has significantly higher per-tCO2 SCCs than Korea (i.e., 60 tCO2 for Canada; 22 tCO2 for Korea). Nuclear energy mitigates the social costs of carbon on a global scale amounting to $580.69 billion, which amounts to approximately 2.56% of the United States’ GDP. 3
Monetized Costs of Nuclear Energy
Nuclear power is cost-competitive compared to other sources of electricity generation. Although, nuclear plant fuel costs are a modest fraction of total generating costs, capital costs are higher than coal-fired facilities and significantly more than gas-fired plants. The LCOE is the fundamental economic metric for every power plant. It is calculated by dividing the total cost of building and operating a power plant over its lifetime by the total amount of electricity dispatched from the facility, measured in a cost per megawatt hour. It considers the capital component’s financing expenses rather than the “overnight” cost.
In addition to investment expenditures, plant operating costs, nuclear power incurs system costs and nuclear-specific taxes. Investment expenditures include investments in site preparation, building, manufacturing, commissioning, and financing of a nuclear power station. Thousands of personnel, tons of steel and concrete, thousands of components, and multiple systems are required to supply energy, cooling, ventilation, information, control, and communication to a central nuclear reactor. Nuclear capital costs alter significantly with plant construction duration, interest rate, and financing method.
Plant operating costs include fuel, operation and maintenance, and expenses for processing and disposing of old fuel and waste. Fixed expenses are incurred irrespective of whether the plant generates power, whereas variable costs fluctuate with production. These prices are usually given as cents per kilowatt hour to compare energy systems. The LCOE represents the average revenue per unit of electricity generated that may be required to recover the costs of building and operating a generating plant during an assumed financial life and duty cycle. It is calculated by dividing all discounted costs over the lifetime of an electricity-generating plant by a discounted sum of the actual energy amounts delivered.

where It = investment expenditures in the year t
Mt = operations and maintenance expenditures in the year t
Ft = fuel expenditures in the year t
Et = electrical energy generated in the year t
r = discount rate
n = expected lifetime of system or power station
The 2020 edition of the OECD study on Projected Costs of Generating Electricity exhibited that, due to the capital-intensive nature of the nuclear power, the variation in the range for the LCOE is significantly greater than that of coal or CCGT when discount rates are considered. Although nuclear energy is cheaper than all alternatives at 3%, 7%, and 10% discount rates. The projected nuclear LCOE costs for plants built in 2020 to 2025 in seven representative countries are detailed in Table 7. 4
Projected Nuclear LCOE Costs for Plants Built 2020 to 2025, $/MWh.

Source. OECD IEA & NEA, Projected Costs of Generating Electricity, 2020 Edition, Table 3.13a, assuming 85% capacity factor.
According to Table 7, the US costs $43.9 to generate 1 MWh from a nuclear reactor (assuming a 3% discount rate). This cost encompasses capital expenditures to build the nuclear plant, to operate and maintain its operation, and other expenses. Japan costs the most in terms of LCOE, incurring $61.2 per MWh of nuclear energy (assuming 3%). This could be due to increased safety and security cost measures following the 2011 Fukushima disaster. Due to comparatively low plant construction costs, Russia and South Korea operate their nuclear facilities at a lower cost than other countries, incurring $27.4 and $39.4 per MWh of nuclear power (assuming 3%), respectively.
Economic Cost-Benefit Analysis of Nuclear Energy
Based on the analyses in subsection 3.4., we perform a cost-benefit analysis of nuclear energy in an environmental perspective. Table X presents the monetized benefits of nuclear energy in the form of dollar values representing the saved SCCs (per tCO2). Conversely, the costs of nuclear energy include various expenses and are summarized as LCOE (per MWh) reported in Table 7. To facilitate the one-to-one comparisons, we convert the unit of the saved SCCs into a per-MWh basis. Table 8 shows the saved SCCs per MWh of electricity. The third column shows the saved SCCs per MWh, the total saved SCCs (from Table 6) divided by electricity generated annually (from Table 5). The fourth column is the LCOE per MWh, assuming a 3% discount rate. 5
Saved Social Cost of Carbon per MWh of Nuclear Energy.

The fifth column of Table 8 is the net benefit (i.e., benefits – expenses) of nuclear energy per MWh. The US has the highest environmental benefits of nuclear energy, recording $639.5 of saved social costs of carbon after excluding the costs to run nuclear plants. Positive net benefits are also observed in China and India, recording $67.4 and $5.3 per MWh, respectively. However, nuclear energy has resulted in losses for other nations. For instance, South Korea has the largest environmental losses associated with nuclear energy (e.g., −20.7 dollars per MWh), presumably due to the low SCCs. Japan also reports net environmental losses (e.g., −12.7 dollars per MWh), possibly due to relatively high LCOE.
The fact that the US has the highest net benefit of nuclear energy, whereas South Korea and Japan have net losses, suggests that the environmental costs and benefits of nuclear energy may vary considerably between regions. The net benefit of nuclear energy can vary significantly by country and depends on several factors, including social costs of carbon and levelized costs of energy.
Discussion and Conclusion
Theoretical Implications
By conducting a comprehensive cost-benefit analysis of nuclear energy, we address a critical gap in the literature regarding nuclear power generation’s economic and environmental impacts. Although numerous governments and international organizations have employed the SCC as a tool for policy development, academic papers employing it for cost-benefit analysis of specific power sources have typically been confined to individual country levels (Adler et al., 2020; Alpino et al., 2023; J. Li & Ho, 2022). Therefore, this study makes an academic contribution by elevating the SCC perspective to a cross-country level. Additionally, research on the social impact of nuclear power has been limited to qualitative surveys on public perception, aside from Adler et al. (2020) in the US (Huhtala & Remes, 2017). Hence, this study makes a significant academic contribution as a cross-country study that proposes a method for quantitatively conducting a social cost-benefit analysis using the individual countries’ SCCs.
As proposed in this study, it would be possible to compare the benefits of renewable energy across different countries by utilizing country-specific SCC data. Rather than simply expanding wind and solar power based on the low share of renewable energy generation, considering the prioritized expansion of energy sources (such as nuclear power) that most effectively reduce SCC in relation to generation costs can be a more informed approach.
Managerial Implications
Our study emphasizes the significance of nuclear energy in the energy transition context and the need for policymakers to recognize its potential role in reducing carbon emissions. In achieving climate change goals, policymakers should consider the effectiveness of categorizing nuclear energy projects as green investments, as done by the European Parliament. Additionally, our study underscores the importance of conducting cost-benefit analyses on nuclear energy to determine its net value, considering both environmental benefits and economic costs. Policymakers should leverage such analyses to make informed decisions concerning energy policies, including incentivizing the use of lower-carbon energy sources and implementing appropriate regulatory frameworks. Furthermore, by bridging the gap between supporters and opponents using quantitative assessments of nuclear energy’s environmental benefits and costs, policymakers should address public perception and concerns about nuclear risks. Overall, policymakers should consider nuclear energy as part of a broader strategy to achieve sustainable energy systems and mitigate the impacts of climate change.
Concrete suggestions for relevant departments include developing policies aligned with the European Parliament’s resolution that categorizes nuclear energy projects as green investments, allocates funding for the construction and maintenance of nuclear power plants, establishes robust regulatory frameworks, implements educational programs to increase public awareness, invests in research and development, conducts comprehensive cost-benefit analyses, fosters international collaboration, and engages with local communities. These measures aim to harness the potential of nuclear energy to reduce carbon emissions, ensure a stable energy supply, and promote sustainable development while addressing safety, economic, and environmental considerations.
Ideas for Future Research
Future research in nuclear energy should focus on conducting comparative analyses of nuclear energy policies across different countries with the aim of understanding the factors influencing policy decisions. These factors include public perception, economic considerations, and environmental priorities, as well as their effectiveness in promoting nuclear energy adoption while addressing climate change goals. Long-term environmental impact assessments are crucial for evaluating the sustainability of nuclear energy deployment, considering its implications for carbon emissions, air quality, and ecosystem health in the long run. Integration studies that examine the synergies between nuclear energy and renewable technologies can provide insights into optimizing energy generation portfolios and enhancing grid stability. Additionally, to understand the broader socio-economic benefits and challenges associated with nuclear energy projects, research on the economic and social impacts of nuclear energy deployment on local communities is necessary. Finally, analyzing the effectiveness of policy instruments, such as carbon pricing mechanisms and investment incentives, in promoting nuclear energy development can inform policy best practices and regulatory frameworks that conducive to nuclear energy investment and innovation.
Limitations
Our study has several caveats. Although the study conducts a cost-benefit analysis of nuclear energy, it may not comprehensively account for all relevant costs and benefits. For instance, it mentions the social cost of carbon and the LCOE; however, it may overlook other economic, environmental, and social factors influencing nuclear energy projects’ overall viability and sustainability. Secondly, the study relies on assumptions and simplifications in its SCC analysis, such as discount rates for estimating costs and benefits over the lifetime of nuclear power plants. These assumptions may not accurately reflect the complex and dynamic nature of energy systems and may affect the reliability and robustness of the study’s findings.
In addition, the potential harm of nuclear energy primarily revolves around three main issues. First, uranium is the primary fuel for nuclear power, which is non-renewable and is found in limited quantities in the earth’s crust. This makes the mining and processing of uranium costlier over time. Second, nuclear power plants produce radioactive waste, which is hazardous to both the environment and human health. The safe packaging and disposal of this spent nuclear material are costly and require careful handling and advanced technology. Lastly, hot radioactive vapors can escape during a nuclear meltdown, potentially causing the nuclear plant to melt down and catch fire fully. This could release harmful radioactive materials into the environment, posing significant health and environmental risks. Although such a scenario is improbable due to the numerous safety features in place at nuclear plants, the potential consequences are severe.
Footnotes
Declaration of Conflicting Interests
The author(s) declared no potential conflicts of interest with respect to the research, authorship, and/or publication of this article.
Funding
The author(s) disclosed receipt of the following financial support for the research, authorship, and/or publication of this article: This work was supported by the 2024 Hongik University Research Fund.
Ethics Statement
This study did not involve any animal or human subjects. Therefore, no ethical approval was required, and there is no committee approval number to provide.
Data Availability Statement
The data used in this study will be provided upon request to the corresponding author.