
Abstract
This study addresses the pivotal challenge of transitioning from nuclear to renewable energy sources, considering the distinctive energy landscape of South Korea characterized by high land costs and high dependence on nuclear energy. Amidst global momentum toward sustainable and carbon-neutral energy, South Korea’s Renewable Energy 3020 Implementation Plan aims to achieve 20% of power generation from renewables by 2030. Shifting away from nuclear energy, however, may lead to rising energy costs, supply disruptions, and environmental ramifications. Furthermore, achieving grid parity between renewable energy and nuclear power by the late 2030s is unlikely, in contrast to earlier projections. This is primarily due to the comparatively lower production cost of nuclear energy. To expedite the shift toward renewable energy, our study suggests transitioning from the Renewable Energy Portfolio Standard (RPS) to a Feed-in-Tariff (FiT) system. This change would offer voluntary incentives for investment in renewable energy. Additionally, we compute Feed-in-Tariff subsidies required to achieve grid parity by 2030, concluding that the amount of subsidies required to reach grid parity by 2030 is 54% of retail electricity price. This research offers valuable insights for policy formulation and energy transition planning.
Plain Language Summary
This study focuses on the challenge of moving from nuclear to renewable energy sources in South Korea. South Korea has high land costs and heavily relies on nuclear energy. While there is a global push for sustainable and low-carbon energy, South Korea’s plan aims for 20% of power to come from renewables by 2030. However, switching from nuclear energy may lead to higher costs, potential supply issues, and environmental impacts. Achieving cost parity between renewable and nuclear energy by the late 2030s seems unlikely, unlike previous predictions, because nuclear energy is currently cheaper to produce. To speed up the shift to renewable energy, the study suggests changing from the Renewable Energy Portfolio Standard (RPS) to a Feed-in-Tariff (FiT) system. This would provide voluntary incentives for investing in renewable energy. The study also calculates the subsidies needed for FiT to reach cost parity by 2030, finding it to be 54% of the retail electricity price. This research offers important insights for creating policies and planning the transition to renewable energy.
Introduction
In recent years, the global pursuit of a sustainable and carbon-neutral energy paradigm has gained substantial momentum. This transition has prompted a surge in interest surrounding renewable energy sources, including photovoltaic and wind turbines, lauded for their diminished carbon footprint and escalating cost competitiveness (Nugent & Sovacool, 2014). Korean government implemented the Renewable Energy 3020 Implementation Plan in 2017 which aims to meet 20% of the power generation through renewable energy by 2030 (Ministry of Trade, Industry and Energy, 2017). In line with the plan, the Korean government suspended the ongoing construction of nuclear power plants and cancelled the plans to build new nuclear reactors, as well as prohibited the extension of aging nuclear power plants. It is because nuclear energy has long been considered a reliable source of low-carbon electricity, but its high upfront costs and concerns over safety and waste management have led to some questioning of its role in the future energy mix (Prăvălie & Bandoc, 2018; Zhou & Zhang, 2010).
However, as Korea navigates this transition toward carbon neutrality, pertinent concerns have emerged, grounded in the nation’s unique energy landscape characterized by high dependence on imports and an isolated power grid. This shift away from nuclear energy is not without its consequences, as it engenders a host of challenges including potential brain drain, rising energy costs, supply disruptions, and environmental ramifications (Neidell et al., 2021). Criticism has been voiced, questioning the economic viability of both nuclear and renewable energy sources (Korea Economic Research Institute, 2021). The importance of tailoring solutions to local contexts in pursuing development project (Metaxas et al., 2023) underscores the need for precise cost estimates in Korean setting, essential for reconciling the divergent narratives surrounding these pivotal energy sources on the path to carbon neutrality.
This study, therefore, seeks to offer accurate cost assessments for both Renewable Energy (RE) and nuclear energy, addressing the conflicts and trade-offs between these two vital sources of power. Such estimates are crucial, given that similar dilemmas between nuclear and renewable energy are encountered by many nations globally (Kim et al., 2014). Some countries opt to emphasize nuclear energy as a low-carbon solution, while others are inclined toward phasing out or limiting nuclear power in favor of renewable alternatives such as solar and wind. Germany, for instance, champions a nuclear phase-out policy concurrent with a thrust toward renewable energy expansion, while France relies heavily on nuclear power while concurrently amplifying investments in renewables (Ferguson-Cradler, 2022; World Nuclear Association, 2023).
In many countries, renewable energy development on a global scale is hampered primarily by its high cost. Energy costs are critical considerations for choosing acceptable RE solutions. LCOE (Levelized costs of energy) include all costs associated with a power plant, such as investment, operation, maintenance, and repair (Li et al., 2022). The LCOE methodology, employed for evaluating the cost of energy generated across the lifespan, serves as a benchmarking mechanism for evaluating the cost-efficiency of various energy generation systems (OECD, NEA/IEA, 2010). The LCOE methodology has been extensively employed for the evaluation of power generation expenses in many countries (NREL, 2013; Singh & Singh, 2010; Wiser et al., 2009). For instance, IRENA (2012a, 2012b) conducted estimations on power generating costs for various technologies across global regions in the year 2010. A detailed research was conducted by the OECD, NEA/IEA (2010), utilizing data from 190 power plants situated in 21 countries. Countries with similar condition with Korea, such as Japan with high land costs, also adopts the LCOE method to evaluate RE (Jahangiri et al., 2020).
According to the Energy and Climate Policy Institute (2017), the Korean government has stated that they expect to achieve “grid parity” by 2030. This refers to a situation where the cost of renewable energy becomes lower than that of nuclear power generation. However, the forecast made by the Korean government did not take into account land costs in their analysis. This assumption is not realistic when calculating the levelized cost of electricity (LCOE) and determining grid parity. According to our comprehensive review of the recent studies for Korea’s various energy sources, the estimates of LCOE (levelized cost of energy) from 1 mW solar power plant is 142 KRW/kWh (equivalent to 0.11 USD) as of 2022 (Korean Energy Economics Institute, 2023). On the other hand, LCOE of coal was 79.47 KRW (0.06 USD) as of 2022 (Cho, 2022), LNG was 119.93 KRW (0.09 USD) as of 2018 (Cho et al., 2018), and nuclear power reached 72.22 KRW (0.05 USD) as of 2018 (Cho et al., 2018). According to international comparisons by the IEA (International Energy Agency), the cost-effectiveness of renewable energy is significantly low in Japan and Korea which have limited land availability (Korea Economic Research Institute, 2021).
This study endeavors to scrutinize these narratives and provide a clear projection of grid parity in the presence of less costly energy sources like nuclear energy. Our analyses indicate that grid parity is difficult to achieve by 2030, unlike the earlier expectation by Korean Government (in 2017). The levelized cost of nuclear energy (based on 80% utilization) increases from 64.51 KRW/kWh in 2018 to 72.66 KRW in 2030. The levelized cost of solar power (from 1 mW plant) is expected to decrease from 142 to 87.18 KRW during the same period. The levelized cost of energy shows the narrowing gap between nuclear and solar power, but nuclear power is still estimated to be cheaper for a while. The grid parity between nuclear and renewable energy (RE) is expected to be achieved only after 2035. If we extend the lifespan of aging nuclear plants, the grid parity will be eventually achieved in 2047.
More significantly, we propose strategies for a more effective expansion of renewable energy. While the use of renewable energy dramatically reduces carbon emissions, high costs hinder the development of these projects (Dınçer et al., 2022). To facilitate the investment on renewable energy, 34 countries including South Korea have adopted Renewable Energy Portfolio Standard (RPS) that requires electricity providers to produce or purchase a certain percentage of their power from renewable sources such as wind, solar, biomass, or geothermal energy, as of 2019 (Kong et al., 2022; Kwon, 2018). On the other hand, 89 countries have adopted Feed-in-Tariff (FiT) or Feed-in-Premium (FiP) that provide providing stable and predictable revenue for renewable energy producers. 1 While countries that provide RPS are stagnating, the countries that choose FiT or FiP as a policy tool are increasing (Jenner et al., 2013; Korea Economic Research Institute, 2021).
South Korea initiated energy transition plan in the “2030 National Greenhouse Gas Reduction Target (NDC) Upside Proposal” in October 2021 to increase the share of renewable energy to 30.2% by 2030, indicating that solar and wind power will soon emerge as the main power sources and play an important role in power supply. However, the current RPS system does not provide enough incentives for energy producers to respond to the electricity market price. RPS can be difficult to enforce and monitor compliance, as well as can lead to an over-reliance on certain types of renewable energy, such as wind or solar, which may not be the most efficient or cost-effective. Usually, support for renewable energy is provided through 20-year fixed-price contracts or REC (Renewable Energy Certificate) policies, and it is not easy to change the existing benefits and support. The current spread of renewable energy capacity under the system is a situation that may not be helpful and may even hinder the integration of the electricity market in the future.
The implication of these results is that transitioning from nuclear energy to renewable energy sources such as solar and wind power will require strong monetary incentives for energy producers. By advocating for a transition from Renewable Energy Portfolio Standard (RPS) to a Feed-in-Tariff (FiT) system, voluntary incentives for renewable energy investment can be provided, potentially streamlining the integration of renewable sources into the electricity market. 2 However, if the government transit to Feed-in-Tariff subsidies schemes for renewable energy, it could encourage more investment in these industries and help Korea transition to a more sustainable and environmentally friendly energy system. It is also important to note that the cost of renewable energy is expected to decrease in the future as technology improves and economies of scale are realized, which could reduce the amount of subsidies required over time.
There are two contributions of this paper. First, we add to the line of studies that assess the levelized cost of energy for policy making purposes (Ouyang & Lin, 2014). We show the grid parity analysis of renewable energy (e.g., photovoltaic and wind turbines) in comparison with nuclear energy, providing clearer projection about grid parity in the presence of less costly energy sources such as nuclear energy. While previous studies have primarily focused on analyzing past archival data to assess the impact of the adopted FiT system (e.g., Dong et al., 2021; Wang et al., 2016), there has been a limited amount of research on projecting the required amount of subsidies in a specific country’s context. It is recommended that we take into account the specific circumstances of each country when simulating the FiT system (Adeyemi-Kayode et al., 2023; Ayoub & Yuji, 2012). Building upon this, our study contributes to simulating the necessary government subsidies in the specific context of Korea, which is characterized by high land costs and a heavy reliance on inexpensive nuclear energy.
More importantly, we propose the policy strategies to expand renewable energy in more effective way. We suggest that Korean government transit from RPS to FiT system, in order to provide voluntary incentives to invest in renewable energy even without the mandatory regulation. To help policymakers to determine the required amount of subsidies, we compute the FiT subsidies to achieve grid parity by 2030 as intended by the Korean government. Our study will aid the policymakers to opt in or out subsidies program for different energy alternatives.
The remainder of our study proceeds as follows: Section “Energy Transitions Policy of South Korea” describes the energy transition policy of South Korea. Section “Levelized Cost of Energy and Grid Parity” explains the levelized cost of energy and grid parity by power generation sources. Section “Required Amount of Subsidies for Renewable Energy” computes the required subsidies to achieve grid parity by 2030 and suggests the direction for energy transition policy. Section “Conclusion and Discussions” concludes the paper.
Energy Transitions Policy of South Korea
Energy Policy Goals to Achieve Carbon Neutrality
The Korean government has put into effect the Renewable Energy 3020 Implementation Plan since 2017, which has the goal of meeting 20% of the country’s power generation needs through renewable energy by the year 2030 (Ministry of Trade, Industry and Energy, 2017). In October 2020, President Moon Jae-in declared that South Korea would achieve net-zero carbon emissions by 2050, aligning the country with dozens of others that have made similar pledges and recognizing the urgency of addressing climate change. As a result, in October 2021, the government announced an even more ambitious plan to increase the share of renewable energy to 30.2% by 2030, through the “2030 Nationally Determined Contribution (NDC) Enhancement Plan” and the “2050 Carbon Neutrality Scenario.”
In accordance with the plan, the Korean government stopped the building of nuclear power facilities that were already in the process of being built, canceled plans to build new nuclear reactors, and made it illegal to extend the lifespan of nuclear power plants that were already in operation. Figure 1 shows that the Korean government aimed to significantly reduce the nuclear power by the transition from the 7th Basic Plan to the 8th Basic Plan. However, growing concerns are being raised about the South Korean government’s fast pursuit of its nuclear phase-out program without taking into account the country’s distinctive characteristics, such as its tiny area, heavy reliance on energy imports, and isolated power infrastructure. There may likely be unintended consequences as a result of the elimination of nuclear power, including a loss of intellectual capital, increased electricity bills, interruptions in the power supply, loss of forest cover, and increased pollution (Neidell et al., 2021).

Current status and future prospects of nuclear power plants planned for phase-out.
The government has been criticized for artificially lowering the grid parity target around 2030 by underestimating the economic feasibility of nuclear power and overestimating that of renewable energy (Choi, 2021; Korea Economic Research Institute, 2021). When reflecting the International Energy Agency’s international comparison of levelized cost of electricity (LCOE), the grid parity point where renewable energy surpasses the economic feasibility of nuclear power is expected to be impossible before 2040, contrary to the government’s expectations. This study defines the South Korean government’s nuclear phase-out policy as a transition from the 7th Basic Plan for Long-term Electricity Supply and Demand to the 8th plan, constructs scenarios for the most uncertain LCOE by power source, and analyzes the economic impact of the nuclear phase-out policy.
The Energy and Climate Policy Institute, which has been commissioned by the current government to conduct research, estimated that the solar energy generation cost would reverse the nuclear energy generation cost, ranging from 86.35 to 82.03 won/kWh between 2025 and 2030, when applying various factors such as accident risk costs for each energy source, trends in energy taxation reform, and cost declines in renewable energy generation in the UK (Energy and Climate Policy Institute, 2017).
However, this estimate is based on unrealistic assumptions and has recently sparked controversy. For example, the Energy and Climate Policy Institute’s research is based on a mega-scale facility of 30 mW for solar power and excluded land costs, resulting in excessive estimates of accident risk costs for nuclear power plants. The Korea Academic Society of Industrial Organization analyzed that grid parity would occur only for solar power facilities of over 30 mW by 2025, but the problem is that it is not easy to build solar facilities of this size. Typically, it takes 13,200 m2 of land to install a 1 mW solar facility, so to install a 30 mW facility, 396,000 m2 are required. However, the Energy and Climate Policy Institute’s research does not account for the acquisition cost of land (Korea Academic Society of Industrial Organization, 2017).
Thus, the criticism is that the Moon Jae-in government has shortened the time frame for achieving grid parity by making excessively unrealistic assumptions to gain policy momentum. Expanding economically unfeasible renewable energy and hastily reducing nuclear power, which possesses environmentally friendly and world-class technology, will result in higher social and economic costs than expected. While expanding renewable energy in the long term is undoubtedly the way to go, a strategic approach that considers the country’s unique characteristics is necessary.
Renewable Energy Support Scheme
The utilization of renewable energy sources has been shown to significantly mitigate carbon emissions (Dınçer et al., 2022), government support schemes can have a significant impact on the market participants’ behaviors. Renewable Energy Portfolio Standard (RPS), Feed-in Tariff (FIT), and Feed-in Premium (FIP) are three common types of renewable energy support schemes. RPS stands for Renewable Portfolio Standard, which is a policy mechanism that requires electricity providers to produce or purchase a certain percentage of their power from renewable sources such as wind, solar, biomass, or geothermal energy. The goal of RPS is to increase the use of renewable energy and reduce reliance on fossil fuels, thereby reducing greenhouse gas emissions and mitigating the impacts of climate change (Cai et al., 2019; Kong et al., 2022; Kwon, 2018). FiT is a policy mechanism that provides financial incentives to renewable energy producers by guaranteeing a fixed price for every unit of electricity they feed into the grid (Jenner et al., 2013; Mu et al., 2021).
There are 34 nations (including South Korea) that have embraced some form of and Renewable Energy Portfolio Standard (RPS), while 69 countries have adopted Feed-in Tariff (FiT) as of 2018 (Kong et al., 2022; OECD, 2023). When looking at the patterns in the two typical policies, we can see that nations that supply RPS are not making any progress, whereas countries who use FiT or FiP as a policy tool are making progress.
The existing RPS system in South Korea does not provide any incentives for participants to react to changes in the price of electricity on the market. In most cases, support for renewable energy is supplied in the form of 20-year fixed-price contracts or REC plans. It is not simple to alter the advantages and support that are now in place for renewable energy. The existing dispersion of renewable energy capacity across the system is a condition that might not be beneficial and might potentially be a hindrance to the future integration of the market for electricity (Korea Economic Research Institute, 2021).
The RPS system has the advantage of easy supply prediction and no financial burden due to the minimum supply requirement. However, there is a concern that the preference for low-cost energy may lead to a bias toward some types of renewable energy, and introducing a competitive system without a technological foundation may result in foreign technology and products dominating the market. In fact, many domestic wind power generators imported the components from overseas, preventing the domestic component manufacturers from growing. In addition, most of the RPS allocations are fulfilled by using waste and wood pellets rather than investing in renewable energy (Song, 2021).
On the other hand, FiT provides a guaranteed price for renewable energy producers, which can encourage investment and stimulate market growth. In addition, FiT can be adapted to different technologies and locations, allowing for a more diverse energy mix. China has successfully expanded its renewable energy capacity using the FiT (Feed-in Tariff) scheme. China installed a record 136 GW of new renewable energy capacity in 2020, accounting for more than half of global additions, with wind accounting for 72 GW and solar accounting for 49 GW (International Renewable Energy Agency [IRENA], 2021). This was largely due to the implementation of the FiT scheme, which provided financial incentives for the development of renewable energy projects and encouraged investment in the sector (Mu et al., 2021).
The biggest concern on Korean FiT system is the increase in financial burden due to subsidies. Korean government introduced the FiT system in 2018 in line with the 3020 renewable energy plan, but only to the limited expected. The Korean FIT system is a fixed-price contract for small-scale solar power, and it will be introduced for a period of 5 years (Korean Energy Agency, 2018). Despite the concerns on the cost, our subsidies analyses in Section “Required Amount of Subsidies for Renewable Energy” suggest that required subsidies account for 54% of retail electricity price at most. The required subsidies for larger scale PV stations (with more than 3,000 kW) are only 39% of retail electricity price. See more details of subsidies calculation in Section “Required Amount of Subsidies for Renewable Energy.”
Levelized Cost of Energy and Grid Parity
Energy pricing and costing should take into account the unique characteristics of each region or country. Several countries have adopted Renewable Energy Frameworks to promote both local and regional incentives for energy transition (Adeyemi-Kayode et al., 2023). For instance, Austria has implemented the Federal Green Electricity Act in 2003, leading to a substantial increase in PV installed capacity (Mondol & Hillenbrand, 2014). China initially dominated PV module manufacturing, and the adoption of Feed-In-Tariffs (FiTs) in 2011 significantly boosted installations (Hopkins & Li, 2016). China reduced PV FiT from USD 0.18/kWh to USD 0.15/kWh after 2012 and surpassed Germany in cumulative PV capacity by 2015 (Kamran et al., 2019). Despite progress, the government plans to phase out PV generation subsidies, prompting evaluation of its impact on grid parity. European countries including Denmark, Germany, Spain, Italy, Cyprus, Malta, Portugal initially relied on Feed-In-Tariff (FiT) policies for renewable energy production and investments, while they achieved grid parity even without FiT subsidies before 2012 due to high electricity prices (Campisi et al., 2015). Among European countries, debate on the necessity of FiT schemes arises, with suggestions for alternative approaches like VAT exemption for small PV plant transactions (Pacudan, 2018). Southeast Asian countries including Indonesia, Malaysia, Philippines, Singapore, and Thailand developed policies to encourage investments in Solar PV rooftop systems. Some discontinued FiT schemes to reduce financial implications, opting for net metering or self-consumption policies instead (Pacudan, 2018). Malaysia was stuck with long-term solar energy implementation plans despite policy revisions and poised to attain grid parity (Husain et al., 2021). Brazil compared the cost of generating on-grid solar power with the national grid, finding significant grid parity in research study sites (Buiatti et al., 2018).
Challenges also exist in prompting achievement of grid parity. While many African countries attained grid parity in the early 2010s due to high electricity prices compared to Solar PV costs (Breyer & Gerlach, 2013), Russia, China, India, and Saudi Arabia faced challenges in attaining grid parity due to significantly lower grid electricity costs compared to solar power (Adeyemi-Kayode et al., 2023). In Middle East and North Africa (MENA) regions, about 20% of electricity demand beyond grid parity in the 2010s, with regions of high solar irradiation and high electricity prices leading the way (Breyer et al., 2010). Majority of EU countries achieved grid parity, except for specific countries, which may require incentive programs focused on Building Integrated Photovoltaics (BIPV) (Gholami & Nils Røstvik, 2021). United Kingdom (UK) introduced FiT incentive program in 2010 to accelerate PV investment, later revised in 2011 with reduced FiT rates (Mondol & Hillenbrand, 2014). United States nearing grid parity typically have good solar irradiance and high electricity prices, or utilize government incentives (Denholm et al., 2009). Larger markets like South Africa and Egypt heavily subsidized their energy markets, leading to delayed attainment of grid parity (Breyer & Gerlach, 2013).
Given the unique energy landscape and policies of each country, a specialized study on Levelized Cost of Electricity (LCOE) and grid parity is essential for Korea. This tailored research will provide crucial insights into the feasibility and economic viability of renewable energy projects within the Korean context. By considering Korea’s specific market dynamics, regulatory framework, and technological capabilities, the study will serve as a valuable resource for policymakers, industry stakeholders, and investors. It will inform strategic decision-making, enabling the development of effective energy policies and targeted investment strategies to facilitate a sustainable and economically viable transition toward renewable energy in Korea.
Levelized Cost of Energy
To deal with recent climate change, countries around the world are making it more important for them to reduce their greenhouse gas emissions. This means that thermal power plants that release a lot of greenhouse gases will have to pay more outside costs. In addition, more people are worried about nuclear accidents, and the costs of accidents have gone up as the scope, target, and the length of accident compensation have grown since the Fukushima nuclear accident. In Korea, public concerns on the safety issues of the nuclear power have increased due to the Gyeongju earthquake in 2016, raising social demand for a nuclear and coal phase-out.
Power generation from nuclear and coal accounts for about 64.5% of the total electricity as of 2022 (Korea Electronic Power Corporation, 2023), whereas public acceptance for the two energy sources has been decreasing so far (Kim et al., 2014). Now it is necessary to consider the social cost of externality when estimating the levelized cost of electricity (LCOE) for traditional power sources such as nuclear and coal. A techno-economic assessment (TEA) is a critical phase in every engineering project that requires an economic return. In the case of electricity generation, TEA typically employs the levelized cost of energy (LCOE) as the primary indicator for benchmarking and assessment because it is understood by both developers and investors. The levelized cost of energy expresses the true cost of energy production technology throughout the course of a project, taking into account the value of time (via the discount rate). However, for those countries without sufficient data to compute LCOE, proxy measures are employed in the early stages of technology development (Adeyemi-Kayode et al., 2023; DTOcean, 2020).
Levelized cost of electricity (LCOE) refers to the average unit cost of electricity generated over the entire life cycle of a specific power generator, requiring assumptions such as discount rate, capacity factor, and operating period (Li et al., 2022). The scope of levelized cost of energy can be expanded to a power plant unit, a power system unit, and a society. The LCOE at the society level includes external costs such as accident risk costs and environmental costs. Such social costs include recovery costs in case of a nuclear accident, insurance, environmental costs (e.g., climate impact), and public health costs, in addition to fixed costs (e.g., capital recovery costs, corporate tax and tax, operation and maintenance costs) and variable costs (e.g., fuel costs) (Branker et al., 2011). Based on the aforementioned concept of LCOE, our study’s LCOE includes external costs such as the social cost of greenhouse gases, pollutions other than greenhouse gases, damages to landscapes, noise pollutions, harms to biodiversity, as well as external costs related to radioactivity (Mu et al., 2022).
As mentioned, the LCOE encompass all expenses related to a power plant, including investments, operations, maintenance, and repairs (Li et al., 2022). The LCOE methodology, which is used to evaluate the cost of energy generated over its lifespan, serves as a benchmarking mechanism for assessing the cost-efficiency of different energy generation systems (OECD, NEA/IEA, 2010). The LCOE methodology has been widely used to assess power generation costs in numerous countries (NREL, 2013; Singh & Singh, 2010; Wiser et al., 2009). For instance, IRENA (2012a, 2012b) conducted estimates on the costs of power generation for different technologies in various global regions in the year 2010. The OECD, NEA/IEA (2010) conducted a comprehensive research study using data from 190 power plants located in 21 countries. Countries with similar conditions to Korea, such as Japan, which faces high land costs, also adopt the LCOE method to evaluate renewable energy (Jahangiri et al., 2020).
LCOE is often used to figure out how much it costs to make electricity. It is a common way to figure out how cost-effective different ways of making energy are (Ouyang & Lin, 2014). It is also a common way to figure out how well new technologies work with the grid (Hernández-Moro & Martínez-Duart, 2013). LCOE is a critical price when the total present value of income is equal to the total present value of costs over the whole life cycle of PV power generation (Tu et al., 2020). This is written as follows:
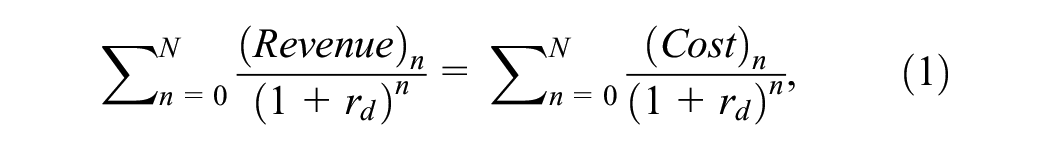

where n is the year n during the operation of PV power stations, N is the life cycle of PV power stations, rd is the discount rate, and Gn is the solar power generation in the year n. Generally, the basic LCOE of PV projects is calculated as shown in equation (3).
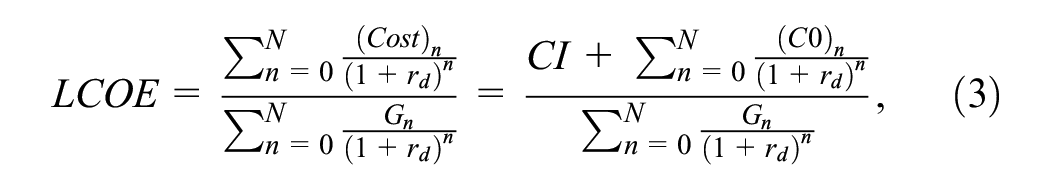
where CI is the initial investment cost and (CO) n is the operational cost in the year n. It should be noted that the power generation in the equations seems to be discounted. In fact, it is obtained by rearranging the equations (Hernández-Moro & Martínez-Duart, 2013).
Korea Energy Economics Institute’s analysis, LCOE of different energy sources are as shown in Table 1. As of 2018, nuclear energy was the least costly energy source, followed by coal, LNG, solar, and wind power in order. For instance, assuming the 85% nuclear plant capacity factor, it costs only 69.58 KRW to produce 1 kWh with nuclear power. On the other hand, solar energy’s LCOE is more than double of nuclear energy (i.e., 133.28 KRW/1 kWh for the capacity with more than 3,000 kW), being the most expensive power generation source.
Levelized Cost of Energy: Nuclear, Coal, LNG, Solar, and Wind Power in Korea (Unit: KRW/kWh).

Note.*This is the result based on a discount rate of 4.5%, and the result of Scenario 1, which estimates module prices based on international prices, according to industrial organization theory. The information is sourced from KEEI’s research report “Study on the Calculation of Equilibrium Generation Cost by Power Source,” submitted to Korea Power Exchange in 2018.
Solar energy’s LCOE is as of 2022 (Korean Energy Economics Institute, 2023). LCOE of wind power (from 20 mW onshore wind turbine) is as of 2022 (Korean Energy Economics Institute, 2023). LCOE of nuclear power plant (at capacity factor of 85%), LNG power plant, and coal power plant are as of 2018 (Cho et al., 2018).
In 2030, solar energy’s LCOE is expected to significantly decrease, being the second cheapest energy source. Particularly, it costs 80.67 KRW for the capacity more than 3,000 kW, decreasing by 39% from 2017 to 2030. On the other hand, coal and LNG become the most expensive power source in 2030, costing 100.06 and 98.71 KRW, respectively. Wind power’s LCEO also significantly decrease by 24% from 2017. A notable is that nuclear energy is still the cheapest power source even in 2030. It costs only 68.84 KRW to produce 1 kWh from nuclear power plant with 85% capacity factor. Nuclear energy still provides much cheaper electricity than any other power sources.
Three Scenarios to Compute Levelized Cost of Energy
To perform grid parity analysis, three scenarios for LCOE are proposed. In the case of Scenario 1, the LCOE (Levelized Cost of Electricity) for nuclear power plants, coal, and LNG (liquefied natural gas) was estimated using KEEI’s (Korea Energy Economics Institute) estimation values, while the LCOE for renewable energy was supplemented using KEEI’s estimation values, the share of renewable energy, and IEA’s (International Energy Agency) outlook. According to the 8th Basic Plan for Energy, the share of solar energy in total renewable energy (including solar, wind, and self-consumption) is expected to increase from 56% in 2017 to 60% in 2030, while onshore wind power is expected to increase from 13% to 31% during the same period, and self-consumption solar energy is expected to decrease from 31% to 9%. According to KEEI’s estimation, the LCOE for solar energy (based on 100–300 kW capacity) is expected to decrease from 141.7 KRW/kWh in 2017 to 87.18 KRW/kWh in 2030, and the LCOE for onshore wind power is expected to decrease from 124 to 93.24 KRW/kWh. As KEEI did not estimate the LCOE for self-consumption solar energy, the difference in LCOE between solar energy and household solar energy projected by IEA, which is 1.53 times, was applied to KEEI’s solar energy LCOE projection. The LCOE for renewable energy was assumed to be the weighted average of the LCOE for each renewable energy source, multiplied by its share, and was assumed to increase or decrease at the same rate as the 2017 to 2030 period beyond 2030.
In Scenario 2, the LCOEs of coal, LNG, and renewable energy are assumed to be the same as in Scenario 1, but for nuclear energy, the LCOE gap between new and aging power plants is reflected. The LCOE for new nuclear power plants is assumed to be 61.17 KRW/kWh, estimated by KEEI, while for the life extension of aging nuclear power plants, the value of 1/2 of the LCOE for new nuclear power plants, 30.59 KRW/kWh, is assumed according to the IEA’s forecast. The LCOE for nuclear power plants is assumed to be a weighted average of 41.3% for new plants and 58.7% for aging plants.
In Scenario 3, the LCOE for nuclear power plants is set by considering only the life extension of aging power plants, reflecting the current government’s nuclear phase-out policy. The LCOEs for coal, LNG, and renewable energy are assumed to be the same as in Scenario 1. In all scenarios, the LCOE for oil-fired power generation is assumed to be the same as that for coal. Table 2 summarizes the assumptions under each scenario.
Scenarios for LCOE and Their Assumptions.

Grid Parity of Renewable Energy in Presence of Nuclear Power
Figure 2 shows the grid parity of renewable energy in each scenario, where it becomes equal to the LCOE of conventional power generation. In all scenarios, the LCOE of renewable energy starts to become lower than that of thermal power generation from 2029, and the point at which the LCOE of LNG generation becomes lower than that of coal is also 2029. The point at which renewable energy becomes more economically viable than nuclear power is estimated to be 2035 in Scenario 1, 2041 in Scenario 2, and 2047 in Scenario 3. As the proportion of extending the lifespan of old nuclear power plants increases, the grid parity of renewable energy for nuclear power will be delayed, and the pressure for electricity price increases due to nuclear phase-out is expected to increase.

Levelized cost of energy by scenario: (a) Scenario 1, (b), Scenario 2, and (c) Scenario 3.
In Scenario 1 based on the Korea Energy Economics Institute’s LCOE outlook, the grid parity point is estimated to be 2035, and electricity rates are expected to increase by 5.6% in 2030 compared to 2017 and decrease by 6.4% in 2040, but its feasibility is considered low. In Scenario 2, which estimates LCOE by including the construction of new nuclear power plants and the extension of their lifespan, the grid parity point is estimated to be 2041, and electricity rates are expected to increase by 15.5% in 2030 and 14.1% in 2040 compared to 2017. In Scenario 3, which considers only the extension of old nuclear power plants without building new ones, the grid parity point is estimated to be 2047, and electricity rates are expected to increase by 25.8% in 2030 and 33% in 2040. Compared to the benchmark scenario, the average annual GDP is expected to decrease by 0.16% in Scenario 1, 0.6% in Scenario 2, and 1.26% in Scenario 3.
The debate over when grid parity between renewable energy and conventional energy will be achieved is intensifying as the cost of renewable energy continues to decrease rapidly. The possibility of achieving grid parity early is a strong basis for supporting the current government’s policy of phasing out nuclear power, making it important to accurately predict the timing of grid parity for establishing the correct direction of national policy. In particular, when calculating the generation cost used to predict grid parity, the levelized cost of electricity (LCOE), which reflects various social and environmental costs, should be used as a basis rather than simple fuel costs and other generation costs. The LCOE is sensitive to factors such as discount rates, investment costs compared to total costs, construction period, plant life, fuel cost outlook, environmental cost utilization rate, and regional conditions, so there is a problem of large variations in estimated values depending on the study. The definition and specific values of LCOE of different energy sources will be discussed in the following section.
Required Amount of Subsidies for Renewable Energy
Simulating required subsidies for renewable energy is crucial for efficient budget allocation, setting realistic targets, avoiding over or underfunding, stabilizing markets, and promoting technological innovation. It ensures informed policy decisions that balance economic and environmental goals. However, prior research has predominantly concentrated on examining historical archival data to evaluate the effects of the implemented Feed-in Tariff (FiT) system (e.g., Dong et al., 2021; Wang et al., 2016). However, there is a scarcity of studies that have investigated the estimation of the necessary level of subsidies within the unique circumstances of a particular country. Ayoub and Yuji (2012) and Adeyemi-Kayode et al. (2023) suggest that it is advisable to consider the unique circumstances of individual countries when conducting simulations of the Feed-in Tariff (FiT) system. Our research makes a valuable contribution by examining the simulation of government subsidies in the unique setting of Korea.
To compute the required subsidies amount to achieve grid parity of solar energy by 2030, we need to know the difference between the LCOE of solar energy and the retail electricity price in Korea in 2030. The required subsidies per kWh to renewable energy are equal to the difference between the LCOE and the retail electricity price, as shown in equation (4) (Ouyang & Lin, 2014).

The retail electricity prices in Korea are as in Table 3. During the time with minimum electricity load, the industrial electricity price is 84.8 KRW/kWh in spring and autumn. General electricity price is 73.4 KRW/kWh for the same period. Electricity prices are more expensive during the time with middle or maximum electricity load and during summer and winter seasons.
Retail Electricity Price in Korea (Unit: KRW/kWh).

Note. *For customers that require high-voltage electricity demand more than 300 kW.
According to the analysis in Table 1, the LCOE of solar energy for the capacity more than 3,000 kW is expected to be 133.28 KRW/kWh in 2017. Assuming this LCOE, the required subsidies for solar energy is 0.22 KRW/kWh for industrial electricity, and 10.62 KRW/kWh for general electricity. Table 4 shows the required subsidies for solar and wind energy depending on the generation capacity. In the computation, we use the retail price for general electricity at the middle load in spring and autumn (i.e., 95.9 KRW/kWh).
Required Subsidies for Solar and Wind Energy (Unit: KRW/kWh).

In Table 4, the required subsidies for solar energy ranges between 37.38 KRW/kWh (capacity more than 3,000 kW) and 51.7 KRW/kWh (capacity less than 100 kW). On the other hand, the required subsidies are 28.25 KRW/kWh for wind power (onshore). The subsidies account for up to 54% of electricity price. For instance, PV stations with less than 100 kW capacity receives 54% of electricity price (=51.7 KWR/95.9 KRW) as the RE subsidies. PV stations with 100 to 3,000 kW receive 48%, while the stations with more than 3,000 kW receive 39% of electricity price as the subsidies. Wind power plants receive 30% on the other hand.
Conclusion and Discussions
In conclusion, our study provides valuable insights into the challenges and prospects of transitioning toward renewable energy in Korea. While achieving grid parity within a decade seems unlikely given the competitive edge of low-cost nuclear power, the decision to phase out nuclear energy warrants careful consideration. Policymakers must weigh their country’s unique energy landscape, including reliance on imports and grid stability, when making such pivotal decisions.
As technological advancements continue and costs decrease, renewables like solar and wind are gaining competitiveness against fossil fuels. To bridge the gap, it’s imperative to enhance renewable energy subsidies and incentives. Our findings underscore the need for long-term, predictable support programs to provide a stable market for renewables. We advocate for the expansion of the Feed-in Tariff (FiT) system alongside the existing Renewable Portfolio Standard (RPS), ensuring equitable distribution of incentives and reducing entry barriers for utility producers.
Furthermore, our subsidy analyses suggest that the government should consider subsidizing up to 54% of the electricity price under FiT programs, with varying percentages for different renewable sources. This nuanced approach to energy policy, considering both costs and benefits, is crucial. While nuclear power may see a gradual phase-out, extending their operational lifespan can help meet rising demand. Ultimately, incentive-based support systems like FiT play a pivotal role in driving greater investment in domestic renewable energy industries.
Policy Implications
Policymakers should consider implementing long-term, predictable incentives that provide a stable market for renewable energy sources to improve the effectiveness of renewable energy support programs. For example, we advocate for the expansion of the FiT system in conjunction with the existing RPS system. The FiT system will ensure that subsidies and incentives are distributed equitably and targeted at areas where renewable energy development is most needed by lowering entry barriers for utility producers into renewable energy industries. According to our analyses of required subsidies, the government should provide up to 54% of the price of electricity as subsidies under FiT programs. The required subsidies for large-scale PV stations are only 39% of the electricity price. Only 30% of the electricity price should be compensated by the government as a subsidy for onshore wind turbines.
Overall, the policy implications of this paper suggest that governments should take a nuanced approach to energy policy, carefully weighing the costs and benefits of various power generation sources and taking into account their country’s unique characteristics when making decisions about nuclear and renewable energy. Nuclear power plants may be gradually phased out, but they can be kept operational for a while longer to meet rising electricity demand. Furthermore, in order to achieve grid parity, we need incentive-based support schemes, such as FiT systems that encourage greater investment in domestic renewable energy industries.
Footnotes
Declaration of Conflicting Interests
The author(s) declared no potential conflicts of interest with respect to the research, author publication of/or publication of this article.
Funding
The author(s) disclosed receipt of the following financial support for the research, authorship, and/or publication of this article: This work was supported by 2023 Hongik University Research Fund.
Ethical Approval
This study did not involve any animal or human subjects. Therefore, no ethical approval was required, and there is no committee approval number to provide.
Data Availability Statement
All data generated or analyzed during this study are included in this published article.