
Abstract
Given international interest in evidence-informed early education policy, we sought to interpret what is often a confusing literature on the performance of early childhood education programs. We explore whether they represent a good return on investment and the factors affecting their transferability. A systematic review was conducted to identify all cost–benefit (C-B) studies of center-based programs enrolling disadvantaged children prior to age 5 compared with a matched group. From a search across all pertinent databases in 2013, 13 economic evaluations relating to six distinct programs were identified that met the inclusion criteria. Of the six programs, half were reported as producing a substantial net benefit (benefits considerably greater than cost) representing a good investment, while for the other half, costs were greater than benefits. We explore possible reasons for the considerable divergence in economic outcomes. The primary driver was the divergent effectiveness of the programs reported in the original outcome studies, and to a lesser extent the scope of benefits included in the economic evaluation and period of follow-up. The context in which programs were delivered and program intensity differed markedly. The two oldest (1960s and 1970s) small randomized control trials of high intensity produced far better outcomes and return on investment than more recent large-scale service delivery. This collection of C-B studies challenges the expectation of good returns on investment from the rollout of early childhood programs. A checklist is provided to assist policy makers with the interpretation of C-B studies.
Keywords
Introduction
Early childhood education programs have been delivered since the early 20th century. Formal evaluations of these programs have been conducted at least since the 1960s (Howard & Plant, 1968). Programs such as Head Start in the United States were introduced with the aim of providing a preschool program for low-income children to meet their health, social, and psychological needs (Zigler & Styfco, 1993). There have been numerous studies of the effectiveness of early childhood development programs (Burger, 2010; Currie, 2001; Karoly & Bigelow, 2005; Reynolds, Wang, & Walberg, 2003). These studies provide evidence that early childhood education programs can have a positive impact on cognitive skills, school achievement, social and emotional development, educational achievement, employment, and crime (Reynolds & Temple, 2008), especially for children from disadvantaged backgrounds.
The early years in a child’s life are known to be important determinants of subsequent development and provide a crucial foundation for health, education, and general well-being (Mustard, 2010). Recent research is pointing to the importance of brain development, particularly in the initial years of a child’s life (Shonkoff, 2003; Shonkoff, Richter, van der Gaag, & Bhutta, 2012). Early childhood programs aim to support all aspects of a child’s development and have been identified as particularly beneficial for children with known disadvantages such as low income, ethnic minority, risk of maltreatment; (Heckman, 2006, 2012; Melhuish, 2011; Melhuish, Belsky, Leyland, Barnes, & The National Evaluation of Sure Start Research Team, 2008).
Findings have been disseminated to policy makers who have increased investment in preschool and kindergarten services through direct provision and/or subsidies to families. Of particular interest to policy makers and governments are arguments that early investments in children produce the largest returns on investment, compared with investments made at later ages (Heckman, 2006). That investment in early childhood education will generate high returns for society is widely accepted. But does the evidence consistently support this view?
Proposed major expansions in access to early childhood education services are costly; an important consideration given ongoing pressures on government budgets. Our updated cost estimates (2011 US$) of six of the most widely cited early childhood programs identified a cost per child of between US$6,000 and US$45,000, depending on program intensity (see Tables 1 and 3). This is high compared with other government-funded programs. For example, in 2011-2012, Australia’s mean annual health cost per person was AUD6,230 (AUD4,345 government spending), while in the United States, just under US$5,5000 per head was spent by governments on health care in 2011.
Description of Program Participants and Components.
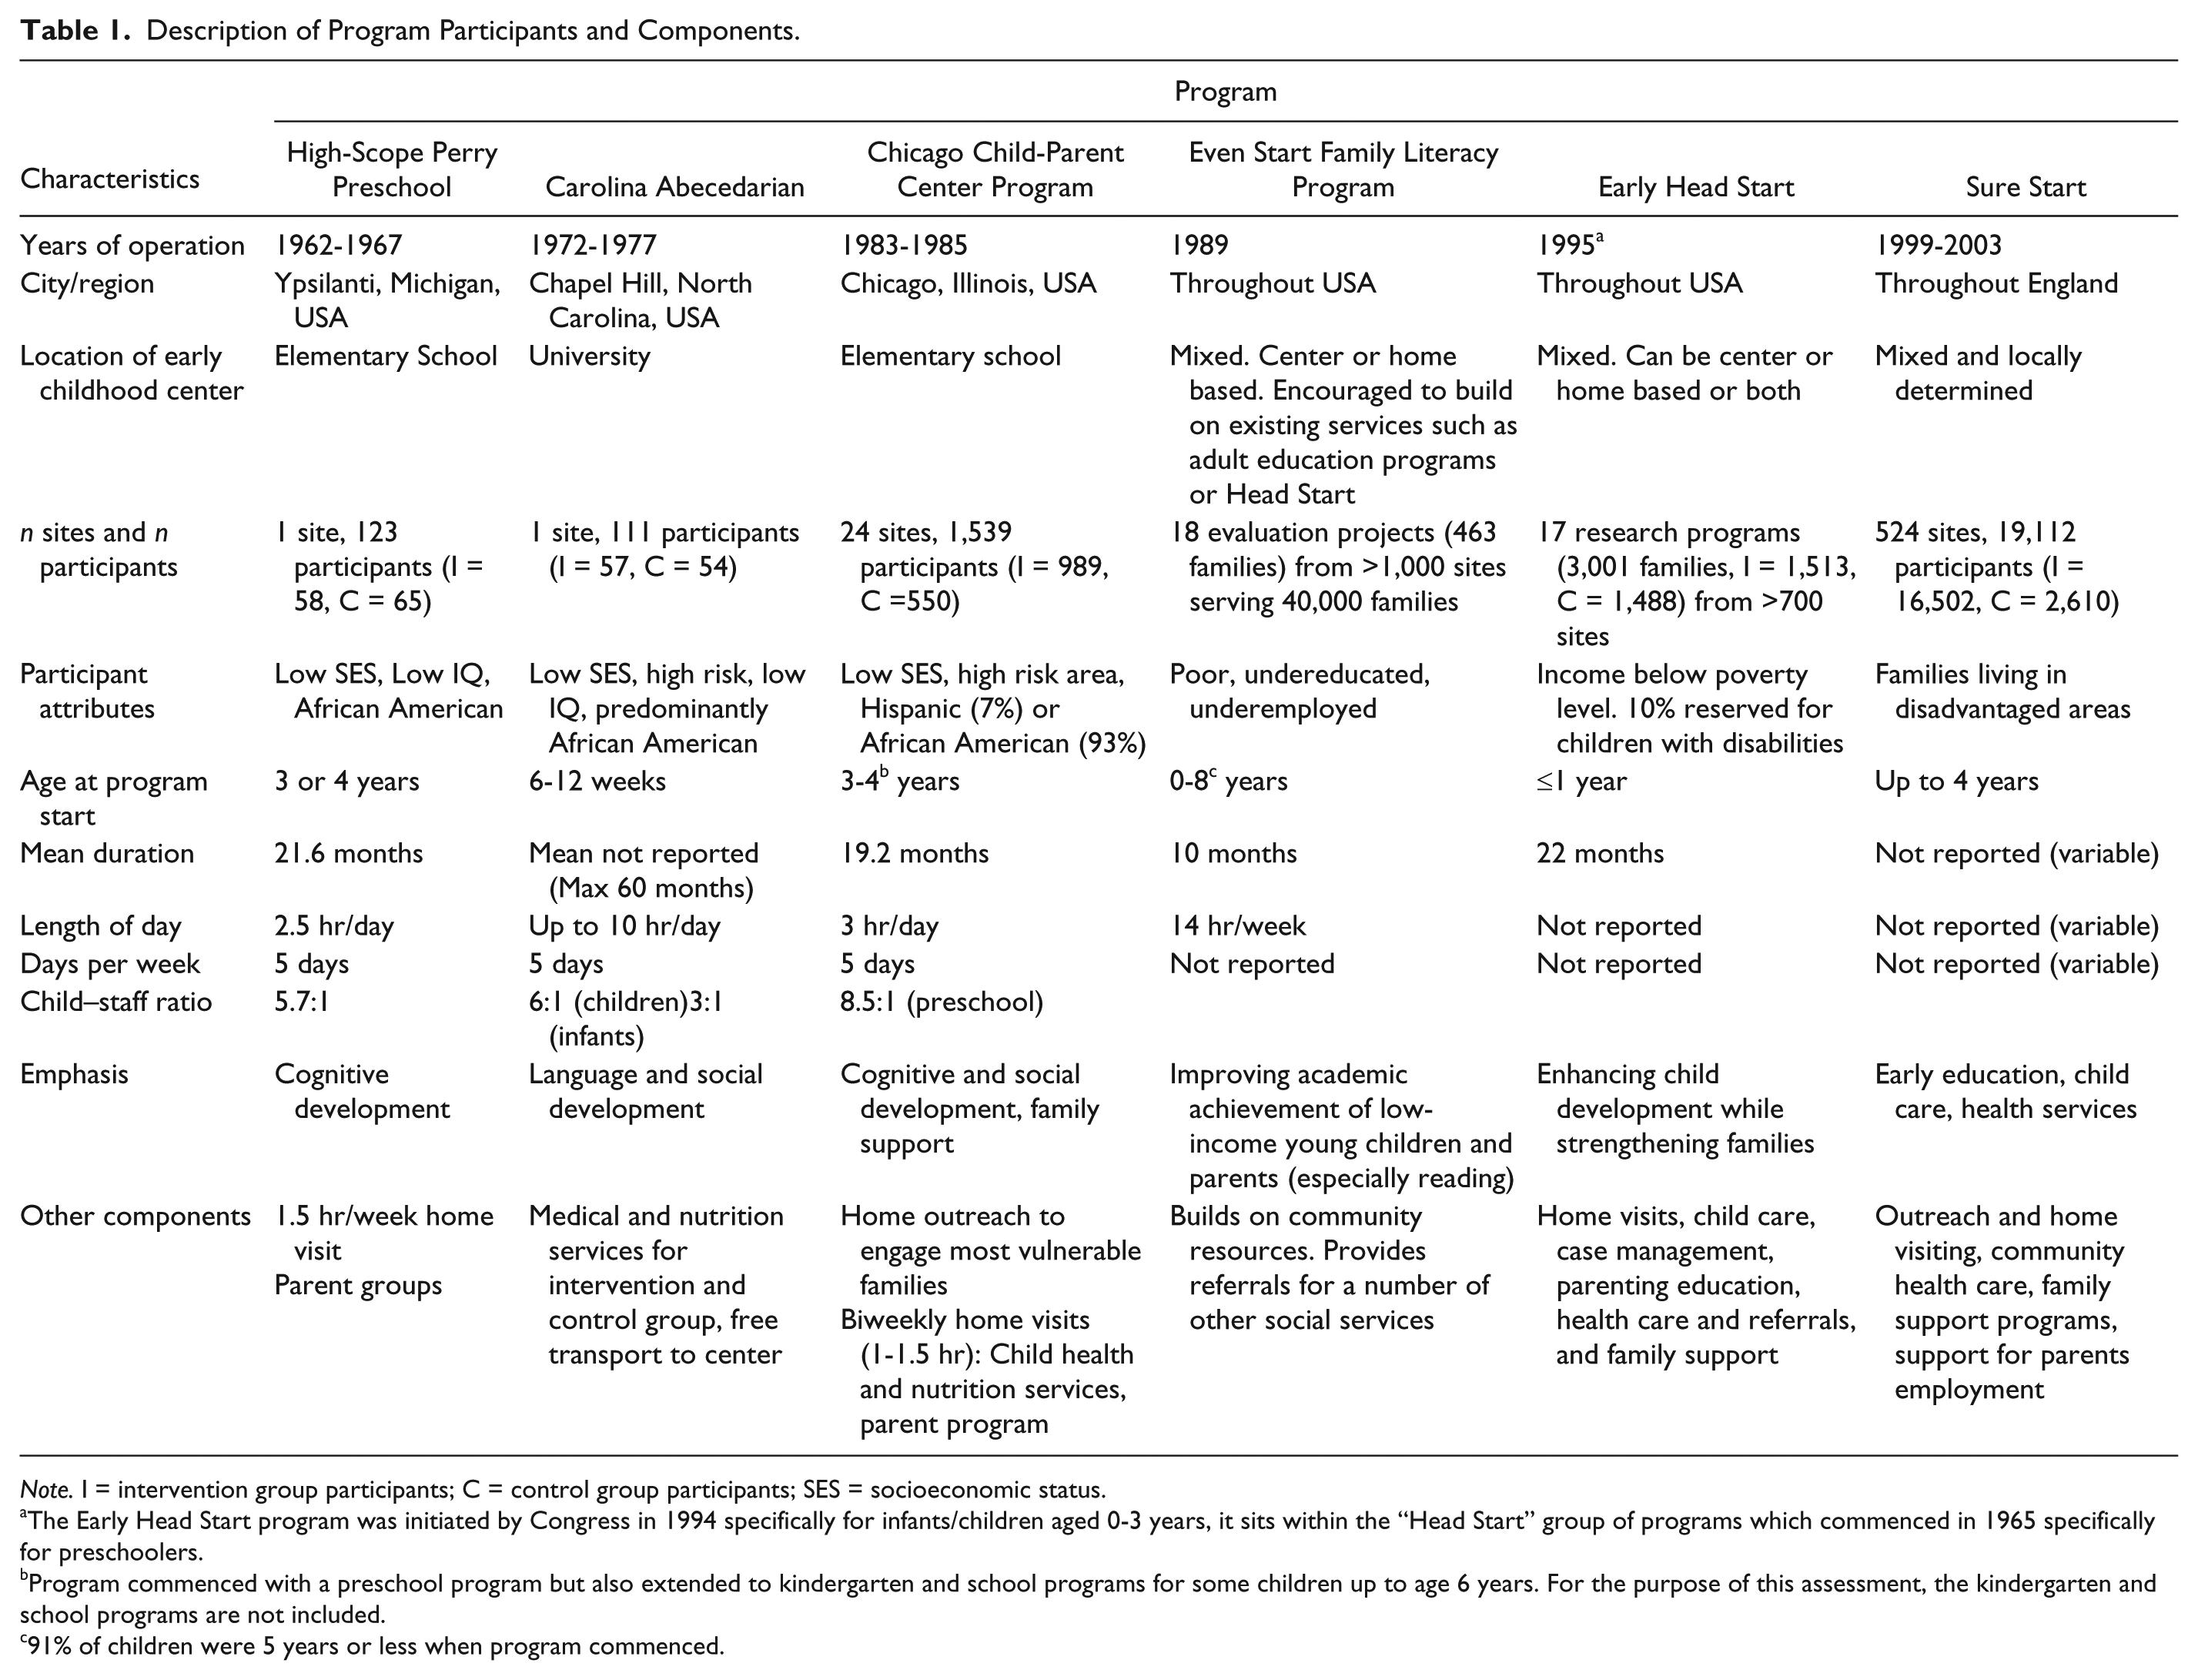
Note. I = intervention group participants; C = control group participants; SES = socioeconomic status.
The Early Head Start program was initiated by Congress in 1994 specifically for infants/children aged 0-3 years, it sits within the “Head Start” group of programs which commenced in 1965 specifically for preschoolers.
Program commenced with a preschool program but also extended to kindergarten and school programs for some children up to age 6 years. For the purpose of this assessment, the kindergarten and school programs are not included.
91% of children were 5 years or less when program commenced.
Because a population-wide rollout of early childhood programs would be very costly even if targeted to disadvantaged communities, it is imperative that governments determine whether these programs represent a good return on investment. Policy decisions require information on both outcomes and costs. Benefit–cost analyses compare benefits with costs and assess the return on investment, reported either as a benefit–cost ratio (which can also be expressed as $x return for each $ invested), net present value benefit (see Figure 1), or internal rate of return. Break-even is reached where either the present value of benefits is equal to the present value of costs of the initial investment (incorporating the mean expected rate of return), the benefit–cost ratio is one, or where the internal rate of return is equal to the expected rate. Benefit–cost analyses can also report on other aspects of program performance such as the time to recoup the initial expenditure and program types and subpopulations that offer the best (and poorest) returns. An advantage of benefit–cost analysis is its ability to capture a wide range of impacts such as health, welfare dependency, crime, or education in a single monetary metric. This means, benefits can be summed across various types of impacts (and impacts occurring at differing time points) and compared directly with costs. This is particularly valuable in assessing the potentially wide-ranging impacts of early childhood education. The commonly reported outcome metric of “effect size,” while providing some insight into program effect on selected outcome measures, is highly challenging for policy makers to interpret in the context of competing demands for funds. Benefit–cost analysis is ideal for informing cross-portfolio or “whole of government” decision making, and is increasingly accepted as necessary for positive social change and lasting improvements for children at disadvantage.
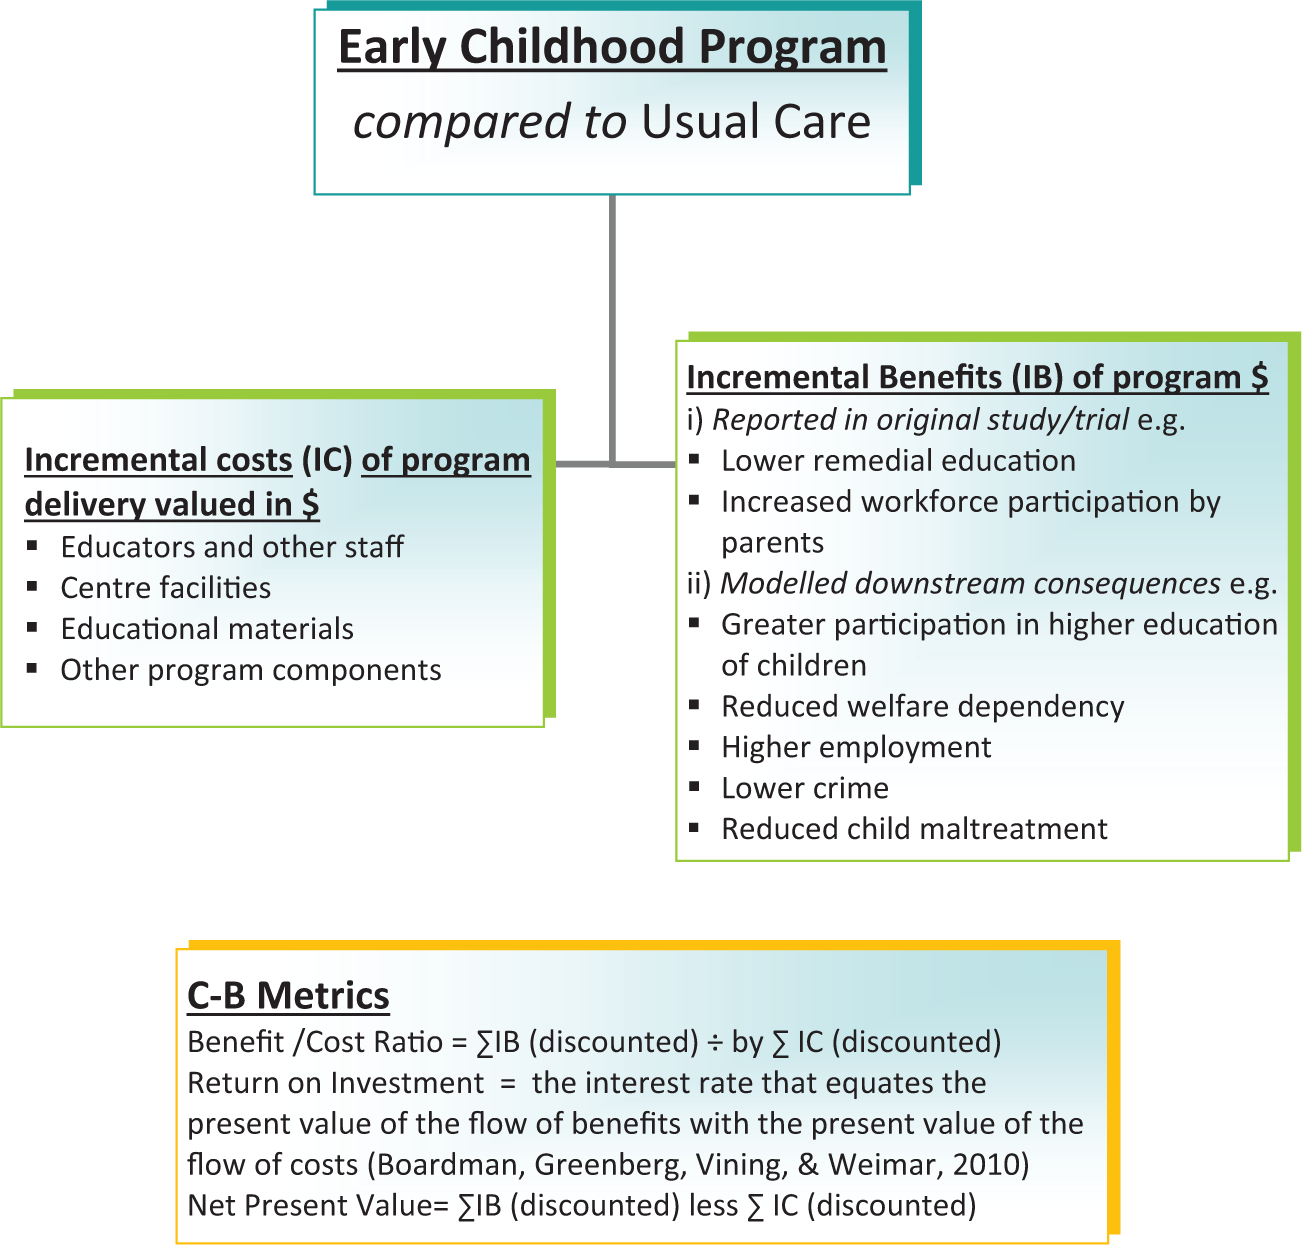
Schematic representation of cost–benefit analysis for early childhood programs.
While a small number of reviews have been published of the benefit–cost literature, these have covered only three early childhood education programs (Barnett & Escobar, 1989; Currie, 2001; Karoly, Kilburn, Bigelow, Caulkins, & Cannon, 2001; Reynolds & Temple, 2008). Two of the programs, Perry Preschool and Abecedarian were small (<60 children in the experimental group), single site, randomized control trials (RCTs), and delivered decades ago (in 1962-1967 and 1972-1977, respectively). The Chicago Child-Parent Centers (CCPC; delivered in 1983-1985) has been operational at some 24 sites, and is continuing to be rolled out across the United States.
A number of more recent benefit–cost studies are now available of early childhood education programs that have been “taken to scale” and delivered in the community, rather than the research trial setting. A review incorporating these more recent cost–benefit (C-B) studies is critical to an understanding of the performance of early childhood education programs in the current context and the community setting.
The aim of this review was to fill this gap, through a systematic literature review of benefit–cost studies of center-based early childhood education programs for disadvantaged children. We aimed to assess their economic performance, and to determine if the economic benefits from the early trials were realized in the larger nation-wide rollouts. We also sought to provide guidance for the interpretation of C-B studies to assist policy makers.
Method
Identification and Selection of Benefit–Cost studies
The databases Medline, Embase, A+Education, Family Databases, Proquest Education journals, Proquest Psychology journals, Education Research Complete, ERIC, EconLit, PsychINFO, and PsychArticles were searched on April 5, 2013, using key words for child care, day care, kindergarten, preschool, and nursery combined with subject headings and key words for early intervention education and benefit–cost. In addition, Internet searching of key websites (including the Washington State Institute for Public Policy [WSIPP] and the RAND Corporation) was performed, along with key author searches and bibliographic searching.
The full text articles were independently assessed for inclusion by two reviewers (K.M.D. and D.H.) and discrepancies were resolved through discussion. The inclusion criteria were as follows:
An original economic evaluation including both costs and benefits
The primary effectiveness study included a control group
A center-based educational intervention
Children prior to school age (i.e., less than 5 years)
Disadvantaged children (e.g., area of low socioeconomic status, low income, racial minority, teenage parents)
Not a specific focus on children with learning or intellectual disability
Not a duplicate publication
English language
Quality Assessment
The quality of the economic evaluations was assessed using standard economic evaluation appraisal criteria from Drummond, Schulpher, Torrance, O’Brien & Stoddard (2005). The categories assessed covered the design of the benefit–cost study and of the study from which evidence of impact was drawn, the rigor of cost identification and measurement, reporting of costs and benefits for the early childhood program relative to the control group (i.e., as incremental costs and benefits), validity of the modeling techniques, and the conduct of sensitivity analysis.
Data Extraction
Data extraction was performed by one researcher (D.H.) into predetermined forms and checked independently by a second researcher (K.M.D.). Details such as study design, characteristics of participants, details of each intervention, items included in cost measurement, and length of follow-up were all recorded. The measures of performance were net present value benefit and benefit–cost ratio (see Figure 1 for definitions). Synthesis via meta-analysis was deemed inappropriate as a stated aim was to examine the content of each benefit–cost analysis, to contrast styles of analysis, and to draw conclusions regarding their relative usefulness for policy and understand why results might differ. All costs and benefits were translated into 2011 US$ using published exchange rates.
Results
The search strategy (see the appendix) yielded 7,590 hits, many of which were duplicates or obviously irrelevant. A total of 147 full text articles were examined of which 13 met the inclusion criteria and were included in the systematic review (see Figure 2).

Trial flow.
Study Characteristics
The 13 benefit–cost studies meeting the inclusion criteria related to six distinct early childhood programs (Table 1). The programs covered in total just over 24,000 participants, with the vast majority drawn from the one study covering 524 Sure Start sites. Five of the six programs were based in the United States with one (Sure Start) based in the United Kingdom (see Table 1).
Program Description
Key characteristics of the included programs are described in Table 1. The intensity of programs has been described in terms of mean months/years of attendance, hours per day and days per week that the program was offered, and child-staff ratio. Programs were mostly offered to 3- and 4-year-old children, with mean duration of attendance between 1 and 2 years. In terms of hours, Perry Preschool (Barnett, 1985b) and CCPC (Reynolds, Temple, Robertson, & Mann, 2002) offered 2.5 hr a day 5 days per week. The Carolina Abecedarian child care program (Masse & Barnett, 2002) was the most intensive, functioning for 10 hr a day, 5 days per week, and available to children from 6 weeks to 5 years of age.
Many of the programs included components in addition to the center-based learning such as home visiting (Perry Preschool, CCPC, Early Head Start, and Sure Start programs), parenting groups or programs (Perry Preschool, CCPC, Early Head Start, and Sure Start), health and nutrition services (Abecedarian, Early Head Start, CCPC, and Sure Start programs), and referrals for social services (Even Start, Early Head Start programs).
While Sure Start had a common goal of promoting physical, intellectual, and social development, each Sure Start program could include a unique mix of services (across education, child care, health and family support) and delivery methods, based on an assessment of local needs and consultation with parents. Sure Start could involve additional services and also greater co-ordination of existing services. The program was targeted geographically at disadvantaged areas only and operates in a system where early childhood education for 3- and 4-year-olds is already free and available. The service mix and delivery differed across the 524 Sure Start locations (Meadows, 2011). Program emphasis was predominantly cognitive, educational, and social development. The Perry Preschool and Abecedarian programs were administered as small randomized trials (n = 121 and 105, respectively). In contrast, the CCPC, Early Head Start, Even Start, and Sure Start benefit–cost analyses were of larger scale community-wide programs within disadvantaged communities. The benefit–cost analysis of Sure Start sought to assess the effect at the population level, covering all children within “Sure Start” and “comparison” regions, not just children enrolled in the program.
Participants
Core characteristics of the program participants are described in Table 2. All participants in the programs included in this review were under school age (although Even Start had an extension program through to age 8 for some families). All programs were targeted at low socioeconomic groups/families living in poverty/in disadvantaged areas. The five U.S. programs had large enrollment of African American families (up to 93% in the CCPC). Low parental education was specifically reported to be common among the participants in the Perry Preschool, Abecedarian, and Even Start programs. The populations appear to be significantly more vulnerable than the general population, with 10% Early Head Start places reserved for children with disabilities. The relative level of disadvantage across programs is difficult to establish.
Difference Between Intervention and Control Groups Core Education Outcome.

Notes. I = intervention group participants; C = control group participants; C-B = cost–benefit; RCT = randomised control trial; M = change in Foundation Profile Score
Cost–Benefit (C-B) Analyses
Method
All C-B analyses used standard methodology, whereby incremental benefits and costs are identified and valued in dollars. Actual trial/study data to the final point of follow-up (which ranged from 3 years to 40 years) informed the analysis. Most C-B analyses modeled to age 65 or full life expectancy, drawing on evidence of the relationship between observed outcomes and downstream end points. Analyses did vary in terms of range of impacts included, the model structure, parameter values used in modeling downstream consequences, and whether or how uncertainty in the primary evidence are incorporated.
The C-B analyses for two programs, Even Start and Early Head Start, have been taken from the work by Aos and colleagues (Aos et al., 2011; Aos, Lieb, Mayfield, Miller, & Pennuci, 2004) at the WSIPP which thus has employed a consistent approach. One feature of the WSIPP model is a downward adjustment to effectiveness to reflect the commonly observed reduction in effect from the trial setting to community rollout.
Quality assessment
The C-B analyses were found to be well conducted across most criteria, except that sensitivity analyses were not always conducted and where conducted mainly focused on the discount rate. This does not capture the major sources of uncertainty, which primarily arise from the effectiveness data and the assumptions underpinning the downstream modeling. The exceptions were the Reynolds, Temple, White, Ou, and Robertson (2011) analysis of the CCPC program and the Heckman, Moon, Pinto, Savelyeva, and Yavitza (2010) evaluation of Perry Preschool which both conducted extensive sensitivity analyses, including Monte Carlo simulations. Both these evaluations also include an assessment of “deadweight losses” the cost of financing these programs through public taxation, which involves additional welfare costs to society. The lack of sensitivity analysis is a weakness of the other studies, given concerns with the underlying effectiveness data (see also Table 2).
Program costs
The costs of delivering the early childhood program per family or per enrolled child (translated into 2011 US$) varied considerably, reflecting the diversity in program composition and program intensity. The less expensive programs were Even Start US$5,980 per family, Sure Start US$7,870 per family, and the CCPC program US$9,280 per family. The most expensive program was the Abecedarian program at US$45,190 per family, reflecting high intensity in terms of hours per day and years of possible attendance. The Perry Preschool program was also high cost at US$29,836 per family, which included a home visiting component and the Early Head Start program at US$25,796 per family, which included case management, specific parenting programs, and home visiting. Program costs are reported in Table 3.
Key Cost–Benefit Results.

Note. Green shade indicates best quality estimate for each type of program where multiple evaluations are provided (based on longest follow-up and most rigorous identification and assessment of cost saving. AD = actual data; M = modeled data.
Inflated to 2011 US$ using the CPI http://www.bls.gov/data/inflation_calculator.htm
High comparative cost of program as deadweight cost (50%) included in calculations.
Two sets of program costs are reported in original article, one with program administered through school and another with program administered through a child development center, we have chosen to use the latter figure.
Represents total cost of intervention not incremental cost relative to program received by control group.
This analysis is based on the Reynolds, Temple, Robertson, and Mann’s (2002) results with the addition of intangible crime victim benefits.
Meta-analysis (at 3 years from start of intervention recruitment) based on 1 evaluation (of 18 Even Start Programs).
Meta-analysis at (at 3 years from start of intervention recruitment) based on 1 evaluation (of 17 Early Head Start Programs).
Downstream impacts beyond program
All benefits were measured post program completion. The value of these downstream impacts was dependent on (a) scope of impacts (reflecting primarily length of follow-up and program objectives) and (b) measurement methods (reflecting data collection instruments used, model structure, age to which modeling taken, source of evidence to inform parameter values).
The scope of impacts included in each C-B analysis is reported in Table 4, categorized into education-related, health-related, employment and earnings, and crime and social welfare. For five of the six programs, education outcomes are reported, covering typically additional costs such as remedial education and grade repetition and impact on educational attainment. The exception is the Sure Start evaluation (Meadows, 2011). Three programs considered impact on crime. Perry Preschool (Barnett, 1985a, 1985b, 1993; Heckman, Moon, Pinto, Savelyeva, & Yavitza, 2009, 2010; Nores, Belfield, Barnett, & Schweinhart, 2005) and CCPC (Lee, Aos, & Miller, 2008; Reynolds et al., 2002; Reynolds et al., 2011; Temple & Reynolds, 2007) identify reduction in crime as a significant contributor to estimated benefits, while no impact was identified for Abecedarian. The Abecedarian analysis was the only C-B analysis to include impact on smoking (Barnett & Masse, 2007; Masse & Barnett, 2002). Reynolds and colleagues’ (2011) C-B analysis of the CCPC study incorporated the largest number of impacts, including a number of educational outcomes, criminal justice and child protection outcomes, and effect on mental health and substance abuse (based on follow-up at age 21). The Sure Start (Meadows, 2011) and Abecedarian (Masse & Barnett, 2002) C-B analyses included the impact on parental earnings, which reflect the child care aspects of the programs. In the case of Abecedarian, increased parental earning accounted for the majority of benefits (Masse & Barnett, 2002). The C-B studies that included the least number of potential benefit categories were Even Start (St. Pierre, Ricciuti, & Rimdzius, 2005), which only included education and increased earnings, and Sure Start. For Sure Start, outcome data were collected on a number of attributes. However, a statistically significant effect was found only for parental earnings, which is thus the only contributor to the benefit stream (Meadows, 2011).
Most common classes of impacts included as potential benefits by program and C-B analysis.

Program Performance
The costs and benefits and C-B result for each program are reported in Table 3. The Perry Preschool and CCPC programs have multiple C-B results reported in several studies, based on observations of participants at different ages and lengths of follow-up.
Programs show mixed C-B results. The three earliest programs, two of which were small single site trials, report high positive returns on investment as follows: Perry Preschool, up to US$16.1 per US$1 invested; Abecedarian, up to US$3.8 per US$1; and the CCPC program, up to US$10.8 per US$1 invested.
The three more recent programs that involved wider national rollout—Even Start, Early Head Start, and Sure Start programs—report C-B ratios of less than 1; that is, the value of measured benefits was less than program cost.
Discussion
Overview
The C-B results of the six center-based early childhood education programs targeted at disadvantaged groups included in this review would suggest investment in early childhood educational programs is equivocal in terms of potential for return to society. These studies suggest that while the theory behind early childhood programs for disadvantaged populations looks sound, the economic success of the early trials has not often been replicated. Only the CCPC program combined quality evidence, an intervention of large scale, and a program cost that might be considered affordable with a high return. The poor returns for Even Start (St. Pierre et al., 2005) and Early Head Start (Love et al., 2005) and Sure Start (Meadows, 2011) reflect the failure to achieve large changes in educational outcomes (with relatively small, or no, change in short-term educational outcomes), not high cost.
There has been considerable discussion concerning the lack of success of Sure Start. Explanations generally focus on implementation failure, suggesting that the community-driven model, while maximizing local community engagement, has failed to ensure fidelity with core model components. It also may reflect access to preschool by control children which was little different to that offered under the study programs. These are not always well defined. Furthermore, the Sure Start C-B analysis was based on outcome data for children at 5 years of age, when the large impacts from other studies such as effect on crime, employment, or educational attainment are not yet observable.
Limitations
This analysis was limited to programs for which C-B studies have been completed. And the programs included had differing years of follow-up and measured different sets of impacts, which will have affected reported C-B ratios. A number of important early childhood programs, such as Head Start, KidsMatter PATHS, and Incredible Years, are not included in this work. It will be important to include these as economic analyses become available. The existing evidence base is predominantly for the United States, and generalizability to other settings is unknown.
Policy Implications and Interpretation of C-B Studies
These C-B studies highlight the challenge for policy makers in interpreting the results of complex social policy initiatives.
As the ultimate purpose of economic evaluation is to inform policy, we provide guidance on the interpretation of C-B results. Economic evaluation by its nature adds uncertainty, particularly when modeling to longer term outcomes. It is essential to have a thorough understanding of the effectiveness results and quality of the original study to understand what is driving the C-B results.
We note the design of the initial Trial is important in considering likely generalizability of study results. For example, the Abecedarian program used a matched pair randomization method and the recruitment method is not well defined, leaving some uncertainly around possibility for selection bias and representativeness of the wider eligible population. Although F. Campbell and colleagues (2014) using new statistical techniques to re-analyze the Abecedarian study (taking into account issues with randomization, sample size and retention), still find positive results. Baseline equivalence between groups for studies is not always clear. The Even Start program evaluation had study groups with some baseline differences, unclear blinding, significant dropout, and a failure to perform intention to treat analysis.
The Perry Preschool program used an “alternate” randomization process with some parents reassigned following group allocation. However, a reanalysis by Heckman and colleagues concluded that the allocation process did not affect the results. Other adjustments to the analysis by Heckman (e.g., in estimating the costs of crime) did however result in a reduction in the estimated internal rate of return from 16%-17% to 6%-10% (Heckman et al., 2010). We also note strong retention at follow-up for the Perry Preschool, Abecedarian, and CCPC programs.
The Sure Start evaluation is the only C-B analysis to measure the community-level effects of the program rather than the effects just for program participants, which will always show a smaller impact (but also lower costs). While all children in the “Sure Start” regions were eligible for the program, with no Sure Start Program available in comparison regions, not all children will have attended, and rates of participation and attendance will have affected the result. But this is reflective of “real world rollout” of an early childhood education program. While study populations were not randomized and participants in the control regions were significantly more disadvantaged, this has been controlled for in the analysis. As noted, because Sure Start was evaluated when children were only 5 years of age, the ability to express outcomes was limited. The team lead by Meadows (2011) note a number of small effects which may (or may not) translate into measurable downstream benefits.
Core effectiveness results from the primary intervention studies are reported in Table 2, with a focus on high school completion rates where reported (limited by years of follow-up) or school test scores. Perry Preschool, Abecedarian, and CCPC report high school completion rates that were respectively, 17%, 3%, and 7% higher than control populations. Early Head Start had a statistically significant effect on the Peabody Picture Vocabulary Test scores and the Even Start program showed no effect. The Sure Start evaluation reported on the Foundation Profile Score as their key education measure (part of the U.K. government statutory framework standards for early years providers) but did not find a statistically significant difference between intervention and control sites.
A broader scope of included benefits and longer follow-up would generally result in a more favorable C-B ratio if the programs were successful, with additional benefits being accrued but not costs (see Figure 3). This is best observed for the Perry Preschool C-B studies, with successive studies incorporating longer follow-up (up to age 40), reporting successful higher C-B ratios (Barnett, 1993; Barnett & Escobar, 1990; Belfield, Nores, Barnett, & Schweinhart, 2008).
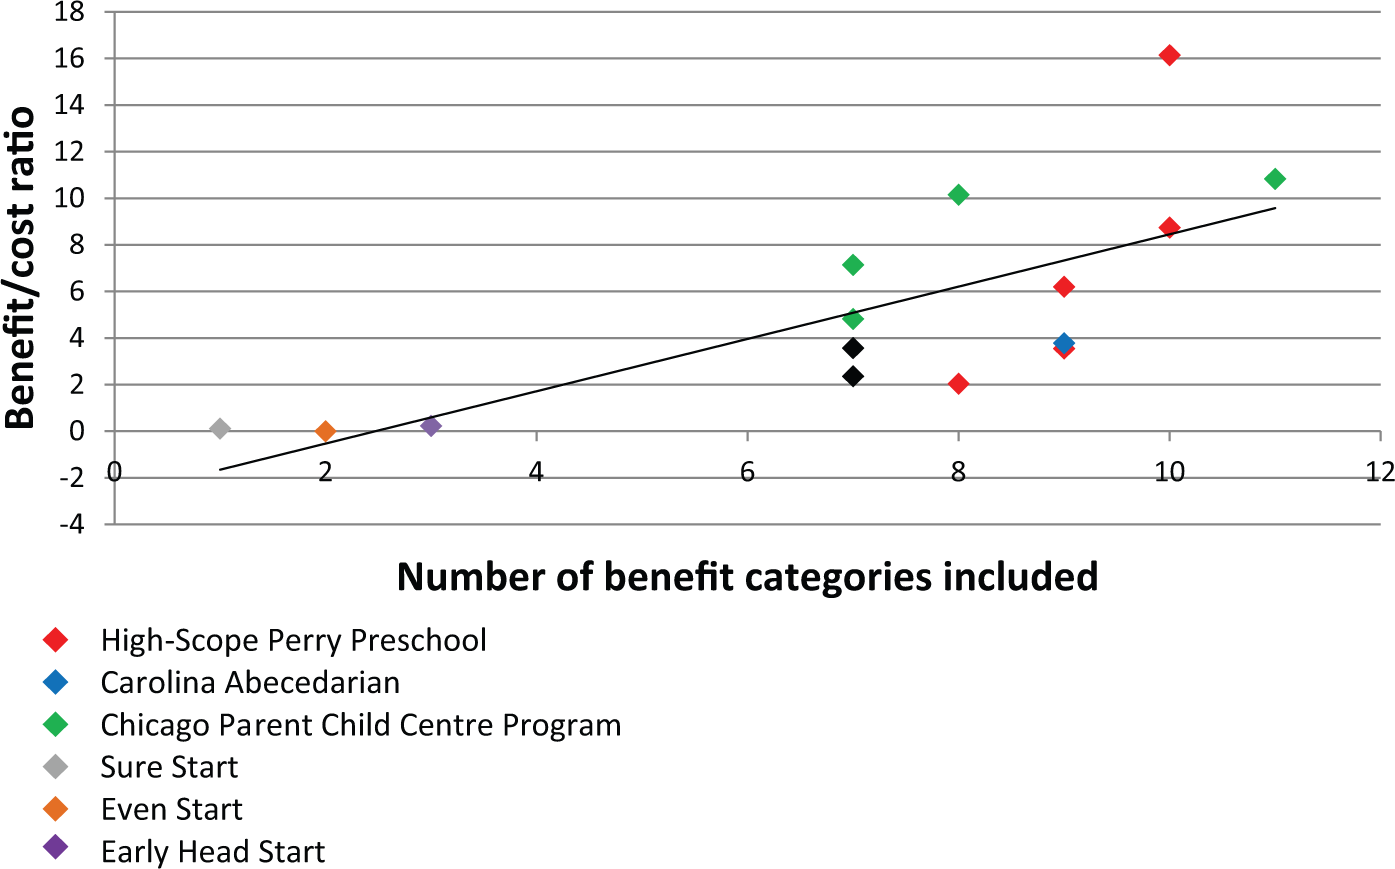
Benefit–cost ratios for the different early childhood education programs by number of benefits included in the analysis.
The services accessed by the comparison group also affect the results, and is important in considering transferability of results if the service system and population characteristics where a program is to be implemented differ from the trial site. This is also the case when considering outcomes such as criminal justice or child protection—where background rates vary hugely across time and space. Randomized control trials while offering high internal validity tend to have poor external validity, which means results are unlikely to be replicated in population rollout. This is a critical issue for policy. On the contrary, community evaluations (such as Sure Start) provide an accurate picture of what a scaled up program would look like, but they often suffer from internal validity constraints in demonstrating effectiveness.
We are now at a point in the evaluation of early childhood education programs that longer term follow-up of older studies is less useful, given their small size and concerns with transferability. What is more useful is research that explores in depth recent results and issues related to translation. Particularly of interest is research on wider community rollout of programs. The evidence of generalizability of beneficial long-term effect is still uncertain, especially for programs delivered at the population level, and it is critical that high-quality evaluations accompany new program delivery. Issues to be considered in interpreting C-B studies are summarized in Table 5.
Framework to Guide Interpreting Early Childhood Education Cost–Benefit (C-B) Evaluations.

Conclusion
This is the most comprehensive review to date of C-B studies of early childhood education. It not only offers a more complete insight into the likely return on investment but also highlights challenges in interpreting these studies and provides guidance to policy makers in this regard.
A consideration of all the published C-B studies of early childhood education programs challenges the view widely held by policy makers, that investing in early childhood education will always represent an excellent return on investment for society. The early promise of two small RCTs of questionable generalizability is yet to be realized in large population-wide program delivery. As a body of evidence, the existing C-B studies do not yet provide an ideal guide to investment decisions relating to early childhood education. Greater attention to the underlying program effectiveness and the context in which programs have been delivered, their fidelity, and the benefits for specific subpopulations will assist policy makers with decisions regarding investment in early childhood programs. The same guidance would help those conducting such analyses to provide results that are transparent, comparable, and able to inform policy.
Footnotes
Appendix
Declaration of Conflicting Interests
The author(s) declared no potential conflicts of interest with respect to the research, authorship, and/or publication of this article.
Funding
The author(s) received no financial support for the research and/or authorship of this article.