
Abstract
The Beijing Hangzhou Grand Canal has become an important component of China’s national cultural park construction. In order to improve the tourism efficiency of cities along the Beijing Hangzhou Grand Canal, this paper constructs an evaluation index system for tourism efficiency of cities along the Beijing Hangzhou Grand Canal based on spatial production theory. The three-stage DEA model are used to evaluate the tourism efficiency of 22 cities along the Beijing Hangzhou Grand Canal in 2015, 2017, and 2019, and analyze the spatiotemporal differences in tourism efficiency. Research has found that firstly, the development of tourism in Beijing, Tianjin, Tai’an, Zhenjiang, Huzhou, and Hangzhou is efficient. The comprehensive tourism efficiency of Xingtai, Zaozhuang, Suqian, and Huai’an is greatly affected by scale efficiency, while the comprehensive tourism efficiency of Xuzhou and Changzhou is more affected by pure technical efficiency. The tourism efficiency of other cities is influenced by the alternating effects of two decomposition efficiencies. Secondly, “tourism dependence” and “actual utilization of foreign investment” have a positive effect on promoting the overall efficiency and scale efficiency of tourism, but are not conducive to the improvement of pure technological efficiency. Thirdly, the global spatial autocorrelation characteristics of tourism efficiency in cities along the Beijing Hangzhou Grand Canal are not significant. Locally developed tourism areas exhibit “H-H” characteristics, while underdeveloped tourism areas exhibit “H-L” and “L-L” distribution characteristics. The findings of this study can provide reference for the development of tourism resources in cities along the Beijing Hangzhou Grand Cana.
Keywords
Introduction
As the crystallization of human social wisdom, World Cultural Heritage has become one of the most popular types of tourism resources, and cultural heritage tourism has also become an important component of the tourism industry (Weng et al., 2019). Meanwhile, many scholars are keen to study the close relationship between tourism and heritage, and show that tourism and heritage are inseparable (Cho, 2022). Cultural heritage is an important embodiment of the cultural value and spiritual sustenance of the destination (Ghermandi et al., 2020), it can transform cities into tourism destinations and gain economic benefits as exhibits of cities (Esfehani & Albrecht, 2019). The rise and development of heritage tourism can have a lot of impacts on heritage protection, urban construction, brand marketing, and residents’ lives, with huge social and economic benefits (Wei et al., 2021). On the contrary, the construction of tourist cities provides necessary conditions such as land, funds, and labor for the prosperous development of heritage tourism. However, there is currently a lack of research on the tourism efficiency of cities where cultural heritage is located. Due to the above-mentioned input-output logical relationship between tourist cities and cultural heritage, clarifying the tourism efficiency of the cities where the heritage is located is of great significance for promoting the high-quality development of the tourism industry in the region.
This article takes 22 cities along the Beijing Hangzhou Grand Canal as examples to explore the tourism efficiency of cities where cultural heritage is located. The Beijing Hangzhou Grand Canal, as a super large linear cultural heritage, carries the important spirit and genes of Chinese culture, and is the source of cultural confidence and self-awareness (X. Huang & Zou, 2023). In December 2019, the issuance of the “Construction Plan for the Great Wall, Grand Canal, and Long March National Cultural Park” put the construction of the Grand Canal National Cultural Park on the agenda, prompting 22 cities along the Beijing Hangzhou Grand Canal to increase investment in funds, land, and talent, and begin to layout the tourism industry around the Grand Canal. At the same time, the booming development of the tourism industry has also brought considerable tourism revenue to these cities. In this context, how to achieve the highest benefits with the lowest investment and improve the level of tourism efficiency has become an urgent problem to be solved in 22 cities.
Therefore, this article takes 22 cities along the Beijing Hangzhou Grand Canal as examples, applies a three-stage DEA model, and introduces spatial production theory to explain the theoretical logic of improving tourism efficiency in cities along the line, evaluates the level of tourism efficiency in cities along the line, and finally uses exploratory spatial data analysis methods to describe the spatiotemporal differences in tourism efficiency in cities along the line. Compared to existing literature, this study takes spatial production theory as the theoretical basis for evaluating urban tourism efficiency, which has innovative theoretical significance. At the same time, with the prosperous development of cultural heritage tourism, research on the efficiency of tourism in regions or cities where cultural heritage is located has been enriched. In addition, this study also provides theoretical guidance for the construction of cultural heritage tourism in other cities.
The research contribution of this article is as follows: (1) It elaborates on the theoretical basis of this article and proposes research hypotheses, providing a theoretical basis for the study of regional heritage tourism efficiency. (2) The three-stage DEA model was used to evaluate and analyze the tourism efficiency of cities along the route. And the robustness of the evaluation results was tested using the super efficiency SBM model, which can provide reference for improving the tourism efficiency of cities along the Beijing Hangzhou Grand Canal. (3) Based on the tourism efficiency value, the exploratory spatial data analysis method was applied to describe its spatiotemporal differences. In order to achieve balanced development of the tourism industry along the entire Beijing Hangzhou Grand Canal region.
Literature Review
Research on Tourism Development of the Beijing Hangzhou Grand Canal
The Beijing Hangzhou Canal is the main body of the Grand Canal of China, and has been listed in the The World Heritage List (D. H. Sun, 2023). It is crucial to develop linear cultural tourism resources and evaluate their tourism value. Therefore, S. Zhang et al. (2023) constructed an RNI tourism value evaluation index system and measured it using both qualitative and quantitative methods, taking cities along the Beijing Hangzhou Grand Canal as an example. In addition, there is an interactive relationship between the canal as a linear cultural heritage and the city it is located in (S. H. Li et al., 2023). The impact of canal tourism development on urban development is reflected in promoting the improvement of infrastructure and increasing resident income, bringing benefits to cities along the route (S. H.Li et al., 2023). However, with the development of social economy and urbanization along the Grand Canal, its ecological environment is being adversely affected (Yue et al., 2023). In the process of restoration and improvement, it is necessary to treat the ecological environment according to local conditions (Y. Li et al., 2021). Therefore, achieving sustainable development of cultural heritage has become crucial (Battilani et al., 2018). To this end, the Chinese government has implemented the construction of the Grand Canal National Cultural Park and strengthened the systematic protection of cultural heritage along the route (Zhuo & Fang, 2023). As mentioned above, the tourism development of the Beijing Hangzhou Grand Canal requires necessary investment to achieve benefits. It is of great significance to evaluate the tourism efficiency and spatiotemporal differences of cities along the Beijing Hangzhou Grand Canal in order to improve this input-output efficiency.
Tourism Efficiency and Its Measurement Methods
“Tourism efficiency” is the sum of achievements achieved in the process of tourism development, highlighting the results of multiple objectives of tourism development (X. Xu, 2016). At present, studies on tourism efficiency mainly focus on tourism ecological efficiency (Yang et al., 2022), tourism industry efficiency (Z. B. Wang et al., 2021) and tourism poverty alleviation efficiency (Y. Liu et al., 2021), and analyze their spatio-temporal evolution and influencing factors (Y. Bai et al., 2022). Some scholars take tourism landscape as the research object and conduct comprehensive evaluation on environmental, social and economic efficiency from the perspective of sustainable development (Zhao et al., 2018). Ham et al. (2020) takes 141 countries as research objects and discusses how to allocate factors affecting the competitive advantage of smart tourism in countries with high tourism efficiency. Yadegaridehkordi et al. (2020) takes tourism enterprises in Malaysia as the research object and believes that technology is the most important factor affecting big data and efficiency of tourism enterprises. Data envelopment analysis (DEA) is an effective tool for efficiency evaluation. DEA has been expanded from the most basic form of CRS and VRS to two-stage DEA, three-stage DEA, EBM, SBM, SE-DEA, SE-SBM, and other models and DEA-Malmquist index. Fragoudaki et al. (2016) used data Envelopment analysis (DEA) and Human Productivity Index (MPI) to assess changes in operational efficiency and productivity of Greek airports during the severe economic crisis in Greece (2010–2014).
Three Stage DEA Model
The three-stage DEA model has advantages in avoiding the influence of non-operational factors on decision-making units, and has strong applicability to efficiency evaluation (Xia & Zhang, 2020). Many scholars have used this method to measure and analyze the efficiency of regional tourism. J. W. Zhang et al. (2022) combined AHP with the three-stage DEA method, so as to better evaluate tourism objects. Tian and Zhao (2022) used the three-stage DEA model to quantitatively evaluate and analyze the tourism eco-efficiency in Shandong Province and 16 prefectural cities during 2010 to 2019. Y. F. Chen et al. (2022) evaluated and decomposed the ecological efficiency of provincial tourism in China from 2008 to 2017 by using a three-stage non-expected SBM-DEA model. J. J. Li et al. (2022) respectively applied the location quotient index and three-stage data envelopment analysis method to measure the degree and efficiency of agglomeration, and explained the influence of agglomeration on tourism efficiency. Peng et al. (2017) analyzed the characteristics and evolution of eco-efficiency in a single tourist destination, taking Huangshan Park as an example. In addition, the three-stage DEA method is also applied to the efficiency of tourism poverty alleviation. In addition, the efficiency of tourism poverty alleviation (J. J. Li et al., 2022; A. L. Huang & Zhu, 2021; Yan et al., 2018), tourism efficiency in western China (M. Z. Song & Xie, 2022), rural tourism efficiency (B. B. Li et al., 2020), cultural tourism efficiency (Y. B. Wang et al., 2016) and other studies have extensively used three-stage DEA for evaluation.
Tourism Efficiency Evaluation Indicators
When selecting investment indicators, according to classical economic theory, land, labor, and capital factors are considered the most basic production factors (H. Wang et al., 2023), but for the tourism industry, its development is relatively less dependent on land (Fang et al., 2015). Therefore, most studies omit relevant indicators that reflect land investment. The labor input indicators involve the number of employees in the accommodation and catering industries (S. P. Wang et al., 2023; W. B. Zhang et al., 2022), the number of employees in tourism (R. L. Wu, 2023), and the number of employees in the tertiary industry (Ye, 2022). Capital input indicators involve the number and scale of star rated hotels, travel agencies and tourist attraction (Q. Xu et al., 2023; J. W.Zhang et al., 2022; Zou et al., 2022), fixed assets investment in tourism industry (R.Song et al., 2022), fixed capital stock in tourism industry (T.Yu & Zuo, 2022), tourism research expenditure (Ke et al., 2022), general government budget expenditure (W. Q. Wang, 2022) Per capita disposable income of urban residents (X. X. Wu et al., 2022), actually utilized amount of foreign capital (Fan et al., 2021), employment in the tertiary industry and fixed assets investment in the tertiary industry (W. Q. Wu & Yao, 2021), salaries of tourism practitioners (R. Y. Yu et al., 2021), total labor productivity (Xiang & Zhang, 2020), and service facility investment (Ke et al., 2022). When a certain indicator data in some cities is missing, scholars will reflect capital investment by searching for alternative variables (Wang et al., 2022) or transforming the original indicators (Hu et al., 2022). Output indicators are divided into two dimensions: expected output and unexpected output. The expected output indicators involve total tourism income and total number of tourists (Sheng et al., 2022; H. Wang et al., 2023). Unexpected output related to tourism carbon emissions (Wang et al., 2022).
The Application of Space Production Theory in Tourism Research
With the introduction of spatial concepts in tourism research, scholars have conducted research based on Lefebvre’s spatial production theory, covering various aspects of the social, cultural, and political aspects of tourism destinations. Scholars have conducted systematic research on the spatial production process, pattern, effects, and mechanisms of communities based on the tourism industry background, mainly focusing on tourism phenomena in various scenarios such as rural areas (Frisvoll, 2012; Ponting & McDonald, 2013; Vasiliki, 2013), small towns (W. Guo & Huang, 2013), traditional communities (J. X. Sun & Su, 2014), ethnic cultural tourism destinations (Gui & Lv, 2013), and cultural and creative blocks (parks; B. Huang et al., 2012; Peterson, 2002). And J. W. Zhang et al. (2022) constructed an inclusive green growth mechanism for high-quality development of the tourism industry based on spatial production theory.
On the basis of the aforementioned achievements, this study takes spatial production theory as the theoretical basis for studying regional tourism efficiency. People object resources from the original material environment In the stage of low tourism efficiency, they invest more costs to obtain less output benefits through production and reproduction Then, through human intervention, management capability, and resource utilization technology are improved to adjust the scale of the tourism industry To achieve pure technical efficiency and scale efficiency That, the state of less input cost and more output benefit are formed Achieve a high level of tourism efficiency The promotion process of tourism efficiency from low to high is consistent with the development sequence of “practice of space,”“representation of space,”“representation of space.”
In summary, research on linear cultural heritage represented by the Beijing Hangzhou Grand Canal has achieved fruitful results. However, there is still little research on the tourism efficiency of cities along the Beijing Hangzhou Grand Canal. Clarifying the logical relationship between input and output of cities along the region is of great significance in improving tourism efficiency. Therefore, this article estimates the tourism efficiency of cities along the Beijing Hangzhou Grand Canal in 2014, 2016, 2018, 2015, 2017, and 2019 using the ultra efficient SBM-DEA method and the three-stage DEA method, respectively. In order to ensure the consistency of the measurement data, the robustness of the tourism efficiency measurement results was tested. Secondly, using exploratory spatial data analysis methods, the measurement results of tourism efficiency were visualized, clarifying the spatiotemporal differentiation characteristics of tourism efficiency in the region.
Theoretical Exposition
Based on the “spatial production theory” proposed by French scholar Henri Lefebvre in 1974 and following the logical relationship of “input-output,” this paper expounds the operating mechanism of urban tourism efficiency along the Beijing-Hangzhou Grand Canal. In order to criticize urban development based on capitalist production and reproduction, Henri Lefebvre put forward the theory of spatial production in his book The production of space (L. Guo et al., 2016). It applies spatial thinking to explain the production and development of urban society (Ham et al., 2020), constructs the theoretical core of “society-space,” and becomes the premise for the spread and reference of spatial production theory from philosophy and sociology to geography and tourism. The theory of spatial production is the social production of space, and its essence means that (social) space is the product of (social; Harden, 2012). Space is a complex social relations of production based on ideology (Lefebvre, 1991), forming a means of production and a result of production as a whole. Regional tourism efficiency is generated by the artificial production and reproduction of the original material environment within the limited space, which is the tourism development of regional space itself, in line with the epistemology of dialectical unity of “society-space” (Bao, 2003). The three-dimensional dialectical architecture of “history-society-space” is an important contribution of the spatial production theory (Lu, 2008), which is embodied in spatial practice, representations of space and space of representation. spatial triples can be used to explain any social form and mode of production (Z. Zhang, 2007).
The theory of space production turns “production in space” to “production in space,” emphasizing the production of space as a whole. With the issuance of the Grand Canal National Cultural Park Construction and Protection Plan, the characteristics of spatial integration of urban tourism development along the Beijing-Hangzhou Grand Canal are becoming more and more obvious. A theoretical model of urban tourism efficiency along the Beijing-Hangzhou Grand Canal is constructed by introducing the concept of “tripartite integration” of spatial production theory and combining with classical economic theory (R. Song et al., 2022), as shown in Figure 1.

Theoretical model of tourism efficiency in cities along the Beijing Hangzhou Grand Canal.
The corresponding relationship between the theoretical model of urban tourism efficiency along the Beijing-Hangzhou Grand Canal and the “practice of space,”“representation of space” and “representation of space” in the concept of “trinity” is as follows: “space practice” is the production space perceived by human beings, and is determined by the social production capacity in a certain historical period. Its introduction into this paper represents the low level tourism efficiency space that has not been improved. In this space, the cost input of cities along the Beijing-Hangzhou Grand Canal is higher, but the benefit output is lower, so the tourism efficiency value is lower. “Representation of space” is conceptualized and symbolized space. It is the adjustment and modification of real space texture by people in space out of their own thinking consciousness and knowledge power. In this paper, it represents the human intervention and adjustment to improve the tourism efficiency based on people’s thinking and consciousness. “Representational space” is the space produced after artificial adjustment and intervention, which is the regression and sublimation of space practice. In this paper, the low level tourism efficiency space is improved to high level tourism efficiency space through artificial adjustment and modification.
This article establishes a theoretical framework for measuring the tourism efficiency of cities along the Beijing Hangzhou Grand Canal and describing their spatiotemporal differentiation characteristics. Therefore, the research results of this article are of great significance for promoting the coordinated development of tourism resources and cultural heritage protection of the Beijing Hangzhou Grand Canal. At the same time, it also provides reference for the development and management of other linear cultural tourism resources.
In addition, in order to enhance the logic of this article and the connection between the previous and subsequent texts, three research questions have been condensed, namely the research purpose of this article:
Question 1. What is the tourism efficiency of the cities along the Beijing Hangzhou Grand Canal? Is its main influencing factor pure technical efficiency or scale efficiency?
Question 2. Whether the environmental factors eliminated in the second stage have a positive or negative effect on the tourism efficiency of cities along the Beijing Hangzhou Grand Canal?
Question 3. How is the tourism efficiency of the cities along the Beijing Hangzhou Grand Canal distributed in this linear region? Is it clustered or discrete?
Method
Study Location
This article selects 22 cities along the Beijing Hangzhou Grand Canal (Beijing, Tianjin, Langfang, Cangzhou, Hengshui, Xingtai, Dezhou, Tai’an, Liaocheng, Jining, Zaozhuang, Xuzhou, Suqian, Huai’an, Yangzhou, Zhenjiang, Changzhou, Wuxi, Suzhou, Jiaxing, Huzhou, and Hangzhou) as research locations. 22 cities along the route have successively invested funds, land, and talents to layout the tourism industry around the Beijing Hangzhou Grand Canal. Meanwhile, the prosperous development of the tourism industry has brought considerable tourism benefits to cities along the Beijing Hangzhou Grand Canal. On the basis of this input-output relationship, it is necessary to improve the tourism efficiency of cities along the Beijing Hangzhou Grand Canal. Therefore, this article takes 22 cities along the Beijing Hangzhou Grand Canal as research locations, evaluates their tourism efficiency, analyzes their spatiotemporal differences, and proposes suggestions to improve tourism efficiency.
Research Design
This paper first uses the three-stage DEA method and super efficiency SBM-DEA model to evaluate the tourism efficiency of 22 cities along the Beijing Hangzhou Grand Canal in 2015, 2017 and 2019. Secondly, only the super efficient SBM-DEA model was used to evaluate the tourism efficiencys of 22 cities in 2014, 2016, and 2018. By comparing the efficiency scores calculated by different evaluation methods for different years, on the one hand, the continuity of statistical data is ensured, and on the other hand, cross validation is carried out on the calculation results to enhance reliability. Therefore, this article takes 22 cities along the Beijing Hangzhou Grand Canal as research locations, evaluates their tourism efficiency from 2014 to 2019, analyzes their temporal and spatial differences, and proposes some suggestions to improve their tourism efficiency. As the 38th World Heritage Conference in 2014 announced that China’s Grand Canal project was successfully included in the World Cultural Heritage List, and the COVID-19 broke out after 2020, the tourism data has undergone tremendous changes, which will lead to deviations in the development law and trend of tourism efficiency under normal circumstances. Therefore, the research period of this article is limited to 2014 to 2019. Thirdly, exploratory spatial data analysis (ESDA) is applied to analyze the spatial-temporal differentiation characteristics of urban tourism efficiency along the Beijing Hangzhou Grand Canal. Finally, according to the evaluation results of urban tourism efficiency along the Beijing Hangzhou Grand Canal and the characteristics of temporal and spatial differentiation, the corresponding countermeasures and suggestions are put forward.
Indicator Variable
Input indicators: Capital, labor and land are usually regarded as the three main factors of production in economic research. Based on this, this paper determines five indicators as input variables. Inv1: “Tertiary industry fixed asset investment” stands for capital input. Tourism is the pillar industry of the tertiary industry, and its development has a long-term and stable relationship with the growth of the tertiary industry (Su et al., 2011). Tourism fixed asset investment can reflect the asset input of the local tourism industry, but tourism data are not separately reflected in the statistical yearbook, so this paper chooses the tertiary industry fixed asset investment as the input indicator. Inv2: “New urban employment population” refers to labor input. A steady stream of new employment groups for the development of regional tourism provides sufficient labor force. Inv3: “GDP per square kilometer of land” reflects the efficiency of land use, and its specific meaning is reflected in the GDP created by the city per square kilometer of land. Inv4: “Richness of tourism resources” is obtained from the weighted summation of the number of 4A level and above scenic spots, the number of museums, the number of History of China and cultural towns, the number of History of China and cultural villages, the number of national Intangible cultural heritage and other indicators by entropy weight method. This index not only reflects the attractive facilities of the city to tourists, but also to some extent reflects the utilization of land elements (R. Song et al., 2022). The quality level of tourist attraction in China is divided into five levels, which are 5A, 4A, 3A, 2A, and 1A from high to low. The national A-level tourist attraction are authorized by the National tourist attraction Quality Rating Committee to the provincial cultural tourism management organization to review in accordance with the national standards of the tourist attraction Quality Rating Management Measures, and issue the “National A-level tourist attraction” signboard, which is an important sign to measure the quality of scenic spots. The “4A level and above scenic spots” mentioned in this paper refer to the scenic spots classified according to the quality level of China’s tourist attraction, with the quality level of 4A and 5A. They are the main force of tourist destinations to attract tourists.
Output indicator: Pro1: “Total tourism income” consists of international and domestic tourism income, which is the main manifestation of the economic benefits of tourism development. Pro2: “Total number of tourists” consists of international and domestic tourists, which is the main reflection of the social benefits of tourism development.
Environmental variables: “Tourism dependency” (Duan et al., 2016) and “Actual amount of foreign investment utilized” are external environmental factors that have a certain impact on the tourism development of the city, but are not controlled by the tourism industry. Removing them can help improve the accuracy of tourism efficiency values.
Data Sources
Considering the integrity, consistency and representativeness of the data, this paper selects the panel data of 22 cities along the Beijing Hangzhou Grand Canal from 2014 to 2019 as the research data. Among them, the panel data of 2015, 2017, and 2019 were brought into the three-stage DEA model to calculate, and the tourism efficiency value was obtained. At the same time, the panel data of 2014, 2016, and 2018 are brought into the super efficiency SBM model to calculate and obtain the tourism efficiency value. Then use the Kendall coefficient to compare the consistency of the two sets of tourism efficiency values and determine the stability of the calculation results.
The data on fixed asset investment, new employment, urban GDP, total tourism income, and total tourism population in the tertiary industry are sourced from the National Economic and Social Development Bulletin of each city. The data on urban land area is sourced from the city profile on the official website of each city government. The information entry data of government attention is sourced from the official websites of various city governments. The number of 4A level and above scenic spots is sourced from the official websites of tourism authorities in various cities. The number of museums comes from the official website of the National Cutural Heritage Administration of China. The number of national intangible cultural heritage comes from the China Intangible Heritage Network. The number of famous towns and villages is sourced from the official website of the Ministry of Housing and Urban-Rural Development of the People’s Republic of China. The number of scenic spots, museums, and intangible cultural heritage in some cities comes from the National Economic and Social Development Bulletin. The construction of tourism efficiency evaluation index system for cities along the Beijing Hangzhou Grand Canal, as shown in Table 1.
Construction of Tourism Efficiency Evaluation Index System of Cities Along the Beijing-Hangzhou Grand Canal.

Methods of Data Analysis
Three-stage DEA model, Phase I: BCC-DEA model

In Equation 1,
Phase II: SFA stochastic frontier regression model
SFA regression equation:

In Equation 2,
Modify the original input value according to the regression results:

In this paper, the method of Jondrow et al. (1982) is used to separate the random error term

Phase III: BCC-DEA and super-efficiency SBM-DEA model
In continuity, the input index after the removal of environmental variables and random interference items is taken as explanatory variable, and the original output index as explained variable is put into the BCC-DEA model and the super efficiency SBM-DEA model successively. The efficiency values before and after adjustment are compared, and the decision-making units are sorted according to the tourism efficiency values calculated by the super efficiency SBM-DEA model. Then the spatial autocorrelation method is applied to analyze the spatio-temporal differentiation of tourism efficiency.
When the DMU is invalid, the SBM model is used to evaluate the efficiency index. In 2001, Tone (2001) improved the CCR and BCC models and developed the SBM model. Its improvement lies in introducing the relaxation variable into the objective function of measuring the efficiency index to evaluate the production efficiency of multiple inputs and outputs of multiple DMUs. Suppose there are
See Equation 5 for the specific form of SBM model:
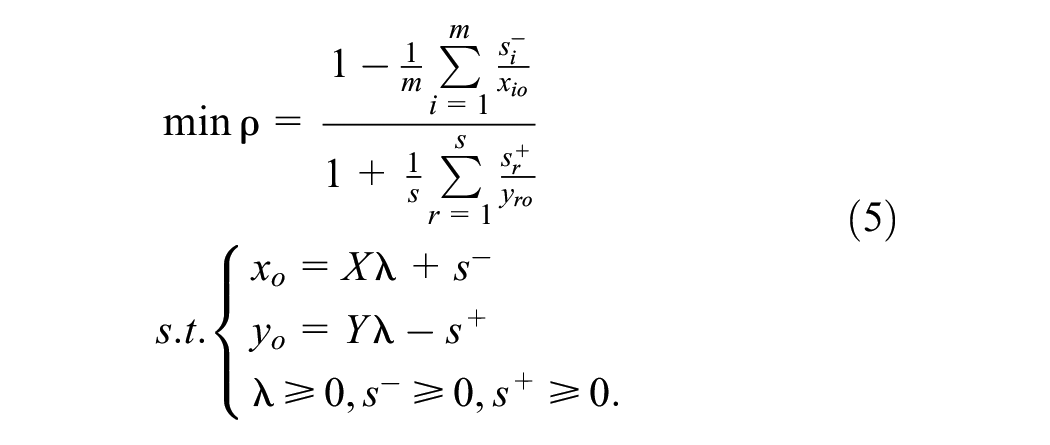
When
When the DMU is efficient, its efficiency index is evaluated using the non-guided Super-SBM model. Since the efficiency evaluation results show that when the production efficiency of several decision-making units is equal to 1, the CCR and BCC models and SBM models cannot be further distinguished. Tone (2002) extended the CCR and BCC models to build the Super-SBM model to achieve further evaluation. The formula of the unguided Super-SBM model is as follows:

Empirical Research
Phase I: BCC-DEA Model
The BCC-DEA model is used to measure the tourism efficiency of 22 urban tourism along the Beijing Hangzhou Grand Canal, and the comprehensive efficiency, pure technical efficiency, scale efficiency, and relaxation variables are obtained. The calculation results are shown in Table 2.
BCC-DEA Calculated Efficiency Value in the First Stage.

The tourism efficiency value calculated by the BCC-DEA model in the first stage includes external environmental factors and noise interference, but it can preliminarily determine the tourism efficiency of 22 cities along the Beijing Hangzhou Grand Canal and distinguish whether the main influencing factor is pure technical efficiency or scale efficiency. Answer question 1. As can be seen from the calculation results in Figure 2, the tourism efficiency of six urban tourism, namely Beijing, Tianjin, Tai’an, Zhenjiang, Huzhou, and Hangzhou, has always remained effective. Beijing, Tianjin, and Hangzhou are first tier cities with developed economies, abundant tourism resources, and high tourist flow, providing advantageous conditions for regional tourism development. Although there is a gap in urban level among Tai’an, Huzhou, and Zhenjiang, the region has high-quality tourism resources, high visibility, strong attraction to tourists, and achieved high output benefits with lower cost inputs, achieving effective tourism efficiencys.

(continued)
In addition, Jining achieved effective tourism efficiencys in 2015, while Suzhou achieved effective tourism efficiencys in 2015 and 2017. The main factors affecting the low level of tourism efficiency in Jining in 2017 and 2019 are scale efficiency and pure technical efficiency, respectively. The main influencing factors of Suzhou’s tourism efficiency in 2019 are pure technical efficiency, resource abundance index, Tertiary sector of the economy fixed assets investment and GDP per capita, while the total number of tourists is insufficient. Indicates that the high cost investment has not been fully utilized.
From the average tourism efficiency values of each year, it can be seen that the tourism comprehensive efficiency value in 2015 and 2017 were greatly influenced by scale efficiency, with pure technical efficiency being the main influencing factor in 2019. The provinces with low scale efficiency leading to ineffective tourism development in 2015, 2017, and 2019 include Xingtai, Zaozhuang, Suqian, and Huai’an. This indicates that there are problems with the development scale of the tourism industry in these four cities, and it is necessary to expand the development scale of the tourism industry and increase income. The difference in scale efficiency and pure technical efficiency between Suqian and Huai’an is relatively small. Therefore, while expanding the scale of industrial development, it is necessary to enhance management capabilities and technological levels, and improve resource utilization efficiency. The main influencing factor for the inefficiency of tourism development in Xuzhou and Changzhou in 2015, 2017, and 2019 was pure technological efficiency, indicating that the management capabilities and technological levels of the two cities need to be improved. The main factors that affect the development level of tourism efficiency in other cities during 2015, 2017, and 2019 will often change. The scale efficiency of Langfang and Yangzhou dominated in 2015, and was mainly affected by pure technological efficiency in 2017 and 2019. The tourism efficiency of Cangzhou, Dezhou, and Liaocheng was mainly affected by scale efficiency in 2015 and 2017, and after 2019, it was mainly due to low pure technological efficiency, resulting in inefficient tourism development. The richness of tourism resources in Cangzhou, Dezhou, and Liaocheng is relatively poor, and the tourism industry started relatively late with a short development period. Therefore, in 2015 and 2017, the low efficiency level was mainly due to the insufficient scale of the tourism industry. In 2019, the new employment in Cangzhou and the fixed asset income of the Tertiary sector of the economy in Dezhou and Liaocheng were more input, but they were not fully utilized and could not be effectively converted into more tourism benefits. The development efficiency of the tourism industry in Wuxi and Jiaxing has gradually shifted from pure technological efficiency to scale efficiency. After improving their management capabilities and resource utilization efficiency, the industrial scale of the two cities has approached saturation and needs to be further expanded.
Phase II : SFA Random Frontier Regression Model Analysis
The relaxation variables obtained in the first stage are used as dependent variables, and the two environmental variables of tourism dependence and actual amount of foreign investment are used as independent variables. They are inputted into the SFA stochastic frontier regression model and measured using Frontier 4.1 tool. The results are shown in Table 3.
Calculation Results of SFA Regression Model.
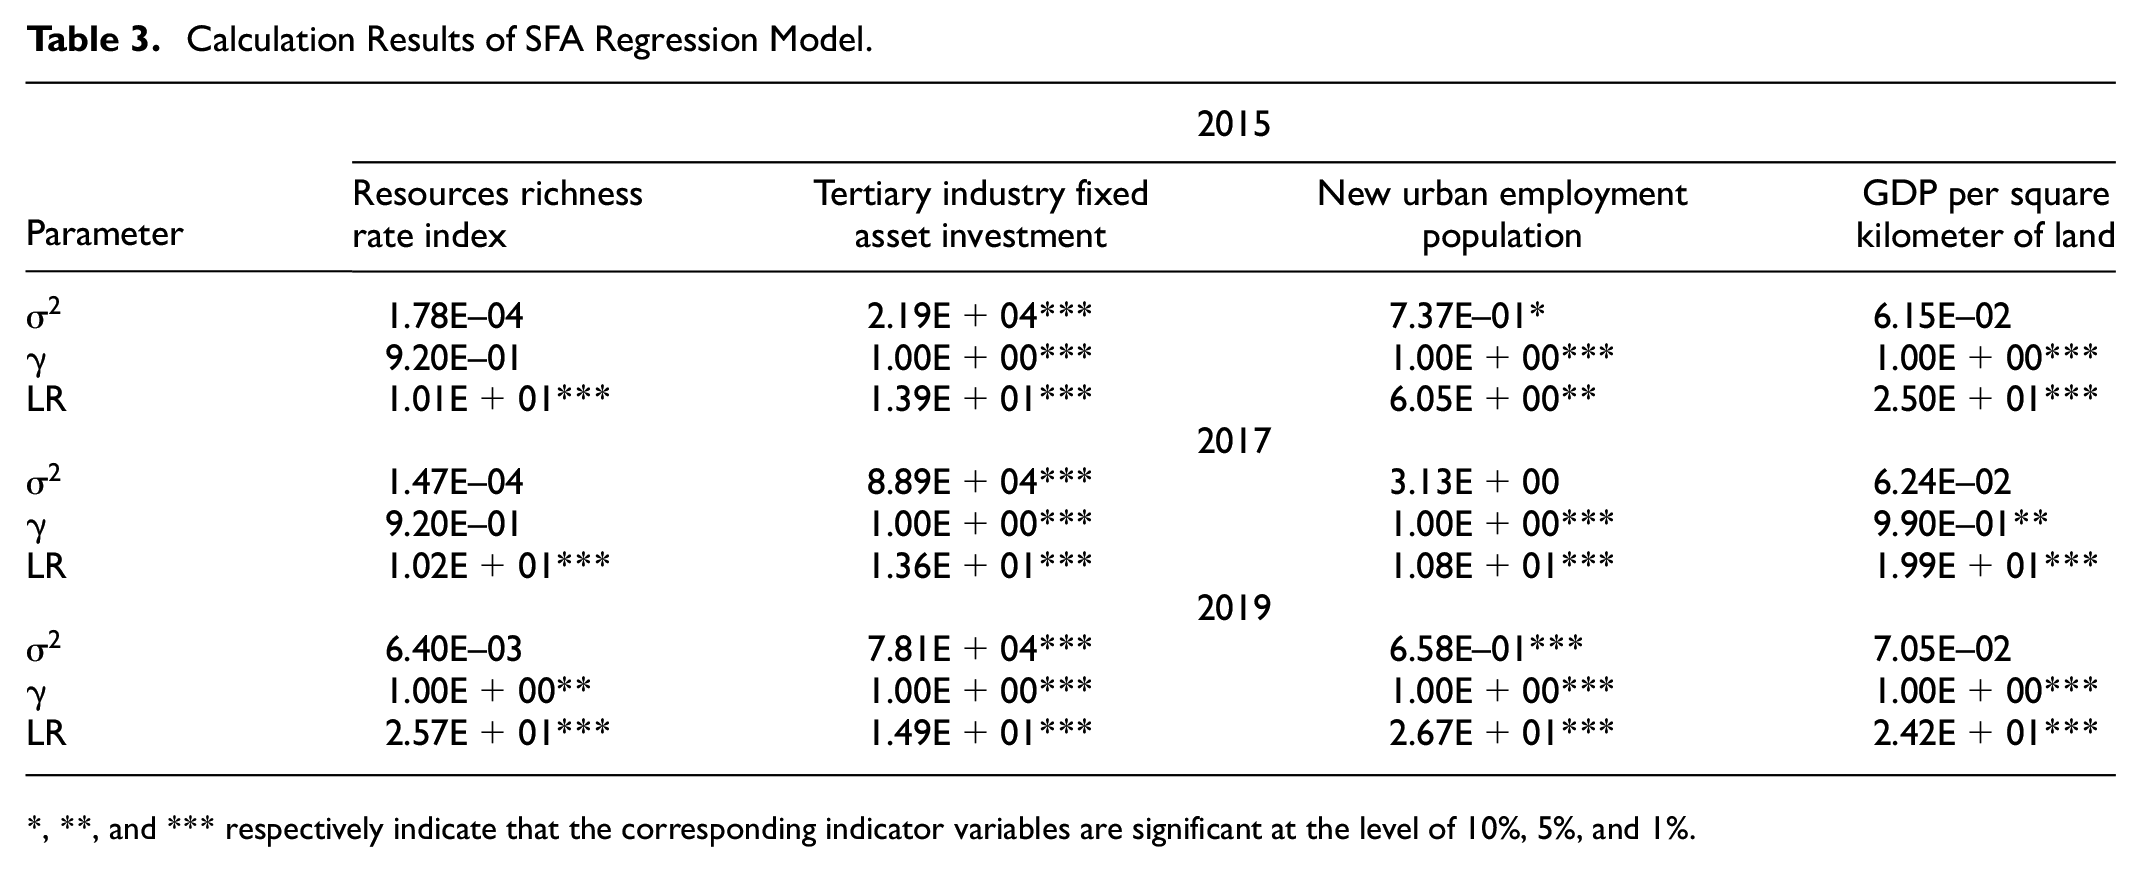
, **, and *** respectively indicate that the corresponding indicator variables are significant at the level of 10%, 5%, and 1%.
Some coefficient t-tests in Table 3 have insignificant issues. Referring to the study by F. F. Zhang et al. (2019), some variable indicators are not significant, which only indicates that the impact of environmental variables on the relaxation variables of the input indicator is relatively small, but the results are still meaningful. From the results shown in Table 3, it can be seen that there are differences in the impact of external environmental factors such as tourism dependence and the actual amount of foreign investment on various investment indicators. The order of impact intensity from strong to weak is “Tertiary industry fixed asset investment,”“New urban employment population,”“GDP per square kilometer of land,”“Resources wealth rate index,” and over time, the impact of external environmental factors on various investment indicators becomes stronger and stronger. When
Further analyze the relationship between various environmental factors and input variables. If the coefficient of the input relaxation variable is positive, it means that the direction of change of the environmental variable and the input relaxation variable is consistent, that is, if the environmental factor increases, the input waste also increases; If the coefficient is negative, then the environmental variable is beneficial for reducing the input amount (Yin et al., 2022). When the t-value does not pass the significance test, it still has an impact on directionality (J. J. Li et al., 2022).
It can be seen from Table 4 that the increase in the intensity of tourism dependency is generally conducive to reducing the waste of tourism resources, fixed assets investment and labor input. At the same time, the relationship between tourism dependence and tourism resource richness shifted to a positive direction in 2019. The reason is that as the dependence of urban development on the tourism industry increases, the attention to the tourism industry will also increase. Therefore, the tourism resources, funds, and labor at the input end will flow to the tourism industry and be fully utilized, avoiding investment waste. When urban development relies too heavily on the tourism industry, it leads to local management departments blindly developing tourism resources in pursuit of tourism benefits, resulting in waste of investment. The increase of GDP per land is mainly because the development of urban tourism has increased the income per unit of land. The increase of actual amount of foreign investment utilized is conducive to reducing the waste of tourism resources, labor force and GDP per capita, but it will increase the investment in fixed assets of the Tertiary sector of the economy. The increase in the amount of foreign investment utilization to some extent reflects the increase in the number of foreign enterprises and workers, as well as the increase in employment opportunities and tourists, alleviating the problem of labor redundancy and effectively utilizing tourism resources. At the same time, the increase in the number of foreign enterprises and foreign workers is bound to bring benefits to the urban catering, accommodation and other tertiary industries, so it will stimulate the blind increase of fixed asset investment in the Tertiary sector of the economy, resulting in redundancy.
The Relationship Between Environmental Variables and Relaxation Variables in the Second Stage SFA Regression Results.
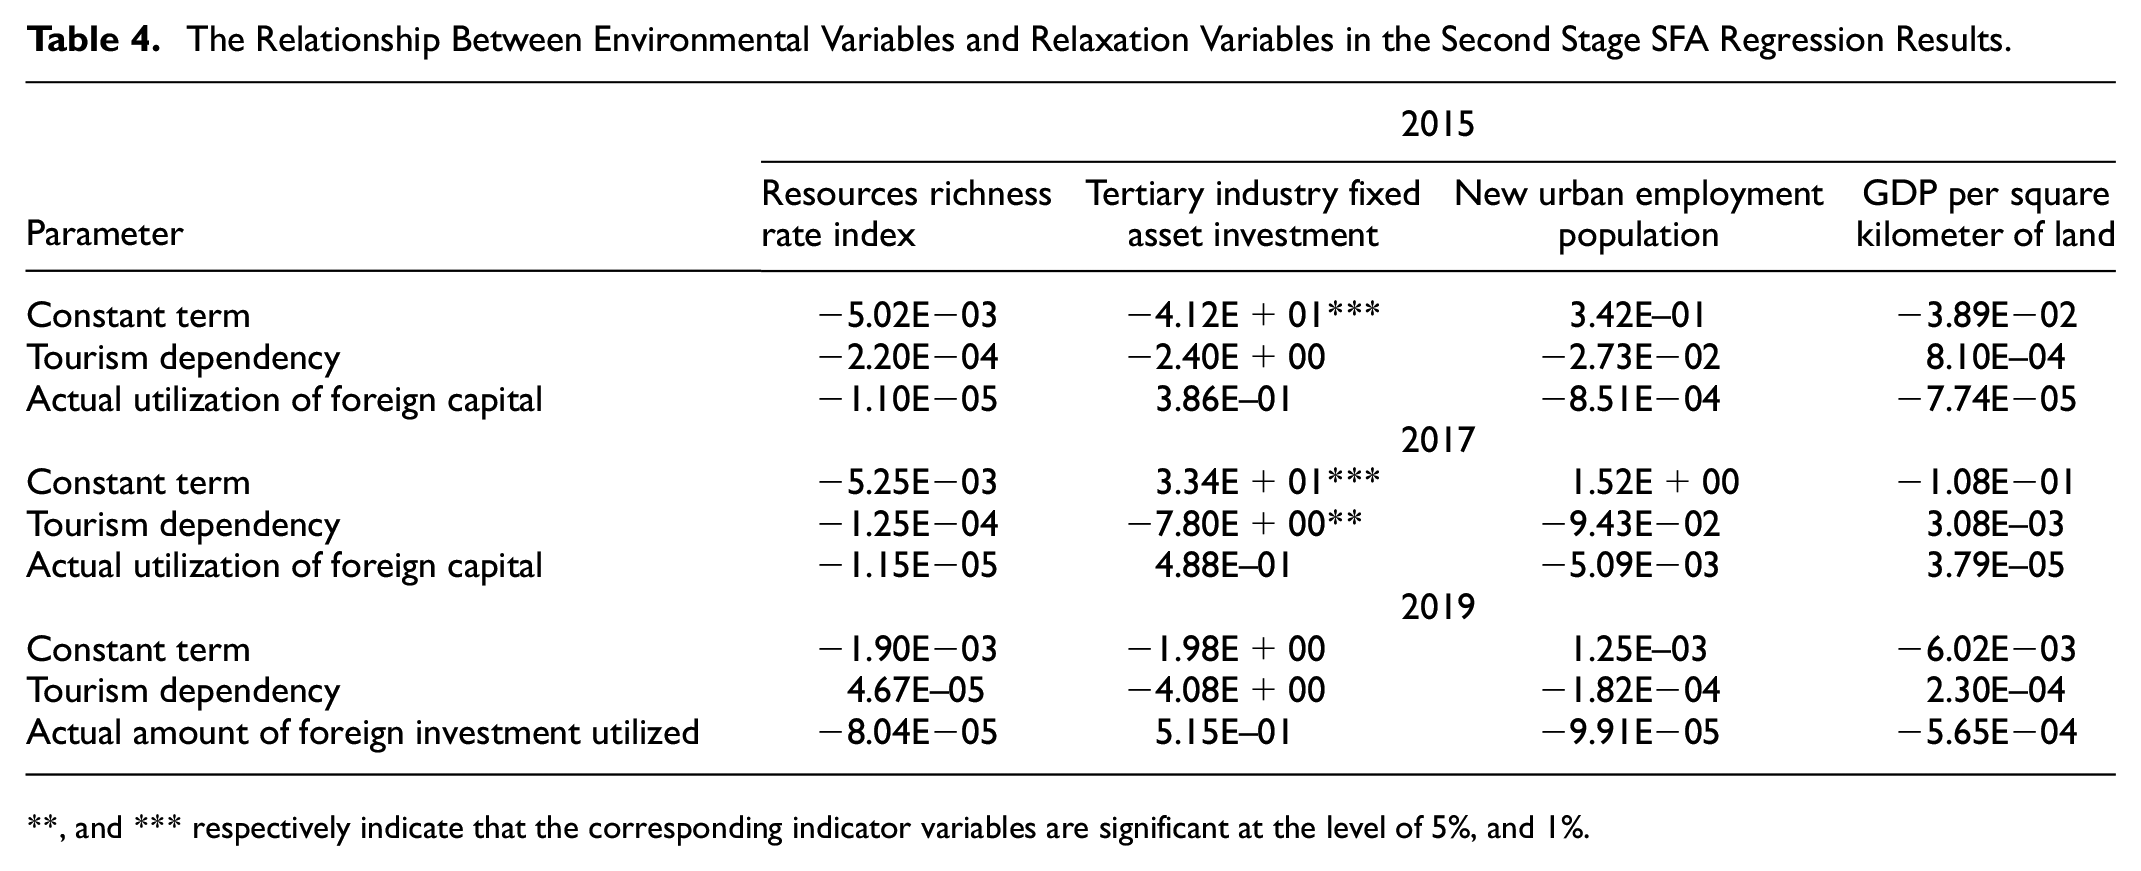
, and *** respectively indicate that the corresponding indicator variables are significant at the level of 5%, and 1%.
Phase III : Adjusted Calculation Results
The adjusted input indicators are used as independent variables, and the original output indicators are used as dependent variables, which are sequentially included in the BCC-DEA and super efficiency SBM-DEA models, are shown in Tables 5 and 6.
Calculation Results of BCC-DEA Model in the Third Stage.

Calculation Results of Super-Efficiency SBM-DEA Model in the Third Stage.

Table 5 shows the tourism efficiency value calculated by BCC model in the third stage, excluding environmental factors and random errors. By comparing the calculation results of the BCC model in the first and third stages, the impact of environmental factors on the comprehensive efficiency, pure technological efficiency, and scale efficiency of tourism in cities along the Beijing Hangzhou Grand Canal is reflected. From the average value of comprehensive efficiency of tourism, it decreases after excluding environmental factors and random errors. In 2015, it decreased by 3.8%, in 2017 it decreased by 2.9%, and in 2019 it averaged 0.853. This indicates that the degree of tourism dependence and the actual amount of foreign investment utilized will have a positive impact on the tourism comprehensive efficiency, and the intensity of the impact will gradually weaken. The amount of input variables can be adjusted appropriately, and the positive role of environmental factors can be utilized to promote the improvement of tourism comprehensive efficiency level. From the average value of pure technical efficiency of tourism, excluding environmental factors and random errors, it rose by 0.65% in 2015, 1.28% in 2017, and 0.22% in 2019. This indicates that the dependence on tourism and the actual amount of foreign investment utilized have constraints on the improvement of tourism pure technological efficiency. From the average value of the efficiency of tourism scale, excluding environmental factors and random errors, it declined by 2.1% in 2015, 4.4% in 2017, and 0.22% in 2019. Indicating that tourism dependence and actual utilization of foreign investment will have a positive impact on tourism scale efficiency. Overall, increasing the attention of cities to the tourism industry and increasing the introduction of foreign investment will stimulate the local expansion of the tourism industry, but a large amount of capital investment limits the improvement of management capabilities and resource utilization technology efficiency.
From the perspective of each city, after excluding environmental factors and random errors, the tourism comprehensive efficiency value of Langfang, Cangzhou, Hengshui, Xingtai, Dezhou, Tai’an, Liaocheng, Jining, Zaozhuang, Xuzhou, Suqian, and Huai’an decrease, while the tourism comprehensive efficiency value of Yangzhou, Changzhou, Wuxi, Suzhou, and Jiaxing increase. It can be seen that for cities with relatively underdeveloped economies, increasing tourism attention and increasing the amount of foreign investment can be helpful in promoting the tourism comprehensive efficiency. For cities with relatively developed economies, their own sufficient investment in capital and labor will weaken the role of increasing tourism attention and foreign investment, and even lead to investment redundancy. After excluding environmental factors and random errors, the pure technological efficiency of tourism in each city shows an overall upward trend, while the scale efficiency of tourism shows a downward trend. It shows that tourism dependence and actual amount of foreign investment will stimulate the expansion of urban tourism, but it is not conducive to the improvement of management ability and resource utilization efficiency.
In summary, environmental factors have a positive impact on the comprehensive efficiency and scale efficiency of tourism in cities along the Beijing Hangzhou Grand Canal, but they constrain the improvement of pure technological efficiency in tourism. This answers the previous question of “Question 2.”
Table 6 shows the calculation results of the third stage super efficiency SBM model, used for further comparison of cities with a tourism efficiency value of 1, and for sorting the tourism efficiency values of 22 cities along the Beijing Hangzhou Grand Canal. At the same time, provide data support for the analysis of spatiotemporal differences in tourism efficiency in the following text. As shown in Table 6, the tourism efficiency value of eight urban tourism in 2015 was more than 1, achieving effective development. In 2017 and 2019, there were also 7 urban tourism with tourism efficiency values greater than 1, achieving effective development. The cities with tourism efficiency consistently exceeding 1 in 2015, 2017, and 2019 include Beijing, Tianjin, Tai’an, Jining, Zhenjiang, Huzhou, and Hangzhou. Among them, in 2019, Hengshui changed from ineffective development to efficient development, while Suzhou changed from effective development to inefficient development. The reason is that Suzhou invested too much in 2019 and was not fully utilized, resulting in a decrease in efficiency conversion rate and a decrease in tourism efficiency. The eighth and ninth columns of Table 6 show the average tourism efficiency in 2015, 2017, and 2019, as well as the rankings of 22 cities. The average tourism efficiency from high to low is: Huzhou, Zhenjiang, Tai’an, Tianjin, Beijing, Hangzhou, Jining, Suzhou, Jiaxing, Yangzhou, Wuxi, Hengshui, Huai’an, Xuzhou, Changzhou, Suqian, Langfang, Dezhou, Zaozhuang, Liaocheng, Xingtai, and Cangzhou. The average tourism efficiency of the top six cities has reached an effective level.
Robustness Testing
The robustness test of this article consists of two steps: firstly, the super efficiency SBM model is used to calculate the tourism efficiency values of 22 cities along the Beijing Hangzhou Grand Canal in 2014, 2016, and 2018. The calculation results are shown in Table 7. Then, the Kendall coordination coefficient was used to measure the consistency between the tourism efficiency values calculated using the three-stage DEA model for 2015, 2017, and 2019, and the tourism efficiency values calculated using the super efficiency SBM model for 2014, 2016, and 2018. Kendall coordination coefficient is a correlation quantity used to calculate the correlation degree of multiple hierarchical variables, and is commonly used to verify whether the sorting results of different evaluation methods for multiple samples are consistent. The Kendall coordination coefficient ranges from 0 to 1. Generally, if the Kendall coordination coefficient is less than 0.2, it indicates poor consistency; The consistency level between 0.2 and 0.4 is average; A range of 0.4 to 0.6 indicates moderate consistency; A range of 0.6 to 0.8 indicates a strong degree of consistency; A range of 0.8 to 1.0 indicates a strong degree of consistency. In this study, the higher the Kendall coordination coefficient, the stronger the reliability and robustness of the tourism efficiency evaluation results (L.Bai, 2016).
Calculation Results of Superefficiency SBM-DEA Models in 2014, 2016, and 2018.

Set the parameter evaluation method to 2, which are the tourism efficiency values calculated using the three-stage DEA model in 2015, 2017, and 2019, and the tourism efficiency values calculated using the super efficiency SBM model in 2014, 2016, and 2018. The evaluation object is 66 (tourism efficiency values of 22 cities and 3 years), and the Kendall coordination coefficient is 0.984, greater than 0.8, calculated using the SPSSAU program. And the chi square value is 127.978, with a significance P value less than 0.01, indicating significant consistency between the calculation results of the two evaluation methods. Therefore, the tourism efficiency evaluation results in this article have strong reliability and robustness.
Analysis of Spatiotemporal Differentiation Characteristics
The ESDA method is generally used to analyze spatial data and its visual expression. It helps to deeply understand the spatial layout evolution law of a certain attribute within a region by visualizing correlation, agglomeration, and cold and hot regions. This paper uses the global Moran’s I index in the exploratory spatial data analysis tool library to evaluate the global spatial autocorrelation of urban tourism efficiency along the Beijing Hangzhou Grand Canal.
Moran’s I value is between −1 and 1, and greater than 0 means positive autocorrelation. The higher I value means the higher concentration degree of urban tourism efficiency along the Beijing Hangzhou Grand Canal; Less than 0 is negative autocorrelation. The smaller the I value, the higher the Statistical dispersion of urban tourism efficiency along the Beijing Hangzhou Grand Canal. Evaluate the significance of statistical results using
The global spatial autocorrelation calculation results of tourism efficiency are shown in Table 8. The z-values in 2015, 2017, and 2019 were all between −1.65 and 1.65, and the p-values were not significant. Therefore, the efficiency of urban tourism along the Beijing Hangzhou Grand Canal does not have global spatial autocorrelation.
Global Spatial Autocorrelation Test Results of Urban Tourism Efficiency Along the Beijing Hangzhou Grand Canal.

On this basis, the paper further studies the local spatial autocorrelation characteristics of urban tourism efficiency along the Beijing Hangzhou Grand Canal. When the global spatial autocorrelation is not significant, identify whether there is local difference more microcosmically, and determine the location of spatial Outlier or strong influence points. Apply the Anselin Local Moran I function in ArcGIS10.8 to calculate and visualize the local spatial autocorrelation index for 2015, 2017, and 2019.
According to Figure 2, the local spatial autocorrelation characteristics of urban tourism efficiency along the Beijing Hangzhou Grand Canal are mainly reflected in three states: H-H, H-L and L-L. In 2015 and 2017, Hangzhou and Jiaxing were upgraded to the “H-H” status, indicating a high level of tourism efficiency in Hangzhou and its surrounding cities such as Huzhou and Jiaxing. In recent years, Zhejiang Province has led the country in building tourism characteristic towns, creating comprehensive tourism demonstration zones, and developing the health and wellness homestay industry. The tourism industry in Hangzhou and Huzhou is particularly developed, forming a highland for tourism efficiency development in northern Zhejiang. Hengshui and Cangzhou were in an “L-L” state in 2015 and 2017. The tourism efficiency of Hengshui and its surrounding cities such as Cangzhou, Xingtai, Dezhou, and Langfang is relatively low. The cities in the southeastern part of Hebei Province and the northeastern part of Shandong Province are mostly dominated by industries such as petrochemical and equipment manufacturing. However, the tourism industry had a short development time, and lacked high-quality tourism resources, making the tourism attraction weak, resulting in the region becoming a depression for tourism efficiency.
In 2019, Hengshui City made great efforts to develop the tourism industry, committed to promoting the construction of Hengshui Lake scenic spot, built Wuqiang Zhouwo Music Town, created more than 50 key cultural and tourism projects, cultivated new cultural and tourism industries such as horse industry, music industry, leisure and health care industry, aviation sports industry, and significantly increased tourism revenue and tourist arrivals, Promoted the improvement of tourism efficiency. Therefore, it has formed an “H-L” state with surrounding cities. The local autocorrelation of urban tourism efficiency in other light yellow areas is not significant.
In summary, the overall spatial autocorrelation characteristics of urban tourism efficiency along the Beijing Hangzhou Grand Canal are not significant. From the perspective of local spatial autocorrelation characteristics, cities such as Hangzhou, Jiaxing, Hengshui, and Cangzhou exhibited tourism efficiencys of “H-H,”“H-L,” and “L-L” in 2015, 2017, and 2019. This section answers the previous question “Question 3.”
Results
This article, titled “efficiency evaluation and spatio-temporal differentiation analysis of tourism industry in cities along the Beijing Hangzhou Grand Canal based on three-stage DEA,” aims to measure the tourism efficiency of cities along the Beijing Hangzhou Grand Canal, analyze their spatiotemporal differences, and improve the level of regional tourism efficiency. At the same time, research was conducted around the three specific issues raised earlier, enhancing the logical and rigorous nature of the article. The research results as follows:
Evaluation Results of Urban Tourism Efficiency
The tourism development of Beijing, Tianjin, Tai’an, Zhenjiang, Huzhou, and Hangzhou has been effective. Due to the decline of decomposition efficiency, Jining and Suzhou cannot maintain the sustainable and effective development of tourism. The tourism development of the remaining cities is not effective. Among them, the comprehensive tourism efficiency of Xingtai, Zaozhuang, Suqian, and Huaian is greatly affected by tourism scale efficiency. Therefore, it is necessary to focus on adjusting the scale of tourism and improving the comprehensive benefits of tourism. The comprehensive efficiency of tourism in Xuzhou and Changzhou is greatly affected by the pure technical efficiency of tourism. Therefore, it is necessary to focus on improving the management capacity and technical level, and improve the efficiency of resource utilization.
The Influence of Environmental Factors on Tourism Efficiency
Through the calculation of the second and third stage models, it is found that the increase of tourism dependence is generally conducive to reducing the waste of tourism resources, fixed asset investment, and labor input. The increase of the actual utilization of foreign capital is conducive to reducing the waste of tourism resources, labor force and per capita GDP, but will increase the fixed asset investment in the tertiary industry. Tourism dependence and actual utilization of foreign capital have a positive impact on the overall efficiency of tourism. Enhancing the importance of tourism in cities along the line and increasing the attraction of foreign capital will stimulate the local tourism industry to expand its industrial scale, but a large amount of capital investment limits the improvement of management capacity and technical efficiency of resource utilization.
Analysis Results of Spatiotemporal Differences in Tourism Efficiency
The overall spatial autocorrelation characteristics of urban tourism effectiveness along the Beijing Hangzhou Grand Canal are not significant From the perspective of local spatial autocorrelation characteristics, in 2015 and 2017, the tourism effects of Hangzhou and Jiaxing shown “H-H” distribution characteristics The tourism effects of Hengshui and Cangzhou have successfully shown the distribution characteristics of L-L In 2019, the tourism efficiency of Hengshui shown a distribution characteristic of “H-L.”
Discussion and Recommendation
As the most representative linear tourism cultural heritage, the tourism development and protection along the Beijing Hangzhou Grand Canal have received special attention from the Chinese government. The government has strengthened its systematic protection by establishing a national cultural park (Zhuo & Fang, 2023). Although previous scholars have conducted research on tourism value evaluation (S. Zhang et al., 2023), the relationship between heritage and cities (S. H. Li et al., 2023; J. T. Li et al., 2020), ecological protection and sustainable development (Battilani et al., 2018; Yue et al., 2023), and other linear cultural heritage, more emphasis has been placed on qualitative analysis and primary land resource value evaluation. However, there is currently a lack of research on the input-output efficiency of tourism in cities along the Beijing Hangzhou Grand Canal.
In addition, previous studies evaluating the level of tourism efficiency have lacked elaboration on basic theories (S. P. Wang et al., 2023; R. Y. Yu et al., 2021; W. B. Zhang et al., 2022), but in reality, regional tourism efficiency can be based on spatial production theory as a theoretical basis. People obtain resources from the primitive material environment. In the stage of low tourism efficiency, they invest more costs and obtain less output benefits through production and reproduction. Then, through human intervention, management capabilities and resource utilization techniques were improved, and the scale of the tourism industry was adjusted to achieve pure technical and scale efficiency, forming a state of low input cost and high output benefits. The process of improving tourism efficiency from low to high was in line with the operational logic of “spatial practice,”“spatial representation,” and “spatial representation.” Therefore, this article elaborates on the operational logic of regional tourism efficiency based on the theory of spatial production.
The research results indicate that the tourism industry in cities such as Huzhou, Zhenjiang, Tai’an, Tianjin, Beijing, and Hangzhou has achieved effective development. They need to fully leverage their role, maintain a good development state, and maintain a balance between supply and demand in the tourism industry. The tourism industry in cities such as Xingtai, Zaozhuang, Suqian, and Huaihe has not achieved effective development, mainly due to the low efficiency value of tourism scale, resulting in the comprehensive efficiency value not meeting the standard. They need to focus on adjusting the scale of tourism development and improving its overall efficiency. The comprehensive tourism efficiency of Xuzhou and Changzhou is relatively low, and they are more affected by the pure technical efficiency of tourism. They need to focus on improving their management ability and technical level to improve tourism efficiency. The comprehensive efficiency of tourism in other cities is influenced by the alternation of scale efficiency and pure technological efficiency. They need to be based on reality, on the one hand, they need to increase attention to the tourism industry, strengthen support measures, and expand development scale. On the other hand, improving professional skills and improving resource utilization efficiency.
Meanwhile, the dependence of cities along the route on the tourism industry and the actual amount of foreign investment utilized can have a positive impact on the overall efficiency of the tourism industry. Therefore, cities along the route should pay attention to the positive role of environmental factors. On the one hand, optimizing the efficiency of utilizing foreign investment and expanding the international influence of the tourism industry. On the other hand, it is necessary to integrate the advantages of tourism resources in the Grand Canal city, promote the upgrading of high-level scenic spots, develop the tourism formats of Grand Canal museums and memorial halls, protect the urban appearance of famous villages and ancient towns, and inherit the intangible cultural heritage along the route.
In addition, the global spatial autocorrelation characteristics of tourism efficiency in cities along the Beijing Hangzhou Grand Canal are not significant. From a local perspective, the tourism efficiency values of Hangzhou and Jiaxing exhibit an H-H distribution characteristic. The tourism efficiency values of Hengshui and Cangzhou cities exhibit an L-L distribution characteristic. In 2019, the tourism efficiency value of Hengshui City showed an H-L distribution characteristic.
Therefore, in response to the temporal and spatial differences in tourism efficiency, it is necessary to strengthen the coordinated development of cities along the Beijing Hangzhou Grand Canal. Cities along the Grand Canal in Hebei Province should utilize the coordinated development strategy of Beijing Tianjin Hebei, actively connect with the relevant policies and measures of the capital on the development of tourism along the Grand Canal, and expand the scale of tourism development. Cities along the Grand Canal in Shandong Province should continue to strengthen their economic strength and carry out joint marketing with leading scenic spots such as Mount Taishan, Qufu “Three Holes” and Taierzhuang. Jiangsu Province needs to strengthen economic cooperation and cultural exchange within the province, narrow the gap in tourism development between southern and northern Jiangsu, and improve the coordination of tourism development throughout the province. Cities along the Beijing Hangzhou Grand Canal in Zhejiang Province should continue to leverage their existing advantages, promote the intelligent and digital construction of museums and memorial halls, and promote the upgrading of the tourism industry.
Limitation
There is no further measurement and analysis of the tourism efficiency of cities along the Beijing Hangzhou Grand Canal under the impact of the epidemic. From the beginning of 2020 to the beginning of 2023, the tourism industry was seriously affected by COVID-19, and the statistical data were lost or changed significantly. There are many factors that lead to the outbreak of COVID-19, which is an abnormal tourism development. Therefore, a rough consideration of the tourism development under the influence of the epidemic and before the epidemic will interfere with the normal development trend of tourism efficiency in urban tourism. In the future, special research can be conducted on the efficiency of regional tourism under the impact of the epidemic.
Footnotes
Acknowledgements
We would like to thank the anonymous referee and the editor for very helpful and detailed comments.
Declaration of Conflicting Interests
The author(s) declared no potential conflicts of interest with respect to the research, authorship, and/or publication of this article.
Funding
The author(s) received no financial support for the research, authorship, and/or publication of this article.
Data Availability Statement
Data sharing not applicable to this article as no datasets were generated or analyzed during the current study.