
Abstract
Since the Chinese government proposed the “dual carbon” target, the study of carbon emission efficiency has become a research focus in the academic community in China. However, experts and scholars have not focused on the animal husbandry industry, and there is a lack of literature on the research of carbon emission efficiency in animal husbandry. Based on national panel data from 2002 to 2020, this study uses a three-stage super-efficiency SBM-DEA model and the Malmquist index to examine the carbon emission efficiency of animal husbandry at the national level, four major economic zones, and 31 provinces, and analyze their evolution processes and trends. Empirical results show that: (1) There are significant differences in carbon emission efficiency among provinces. (2) The improvement of carbon emission efficiency in animal husbandry largely depends on the industrial scale rather than pure technological progress. (3) There is no absolute β-convergence phenomenon in the level of carbon emission efficiency in animal husbandry, and efficiency gaps will continue to exist over time. Finally, based on the empirical findings, this study puts forward important policy recommendations.
Keywords
Introduction
The emission of large amounts of CO2 since the industrial revolution has caused destructive impacts on the environment, resulting in the intensification of the global greenhouse effect. Excessive carbon emissions have exacerbated global warming and environmental degradation, forcing humans to face serious risks such as economic stagnation, health damage, resource shortages, and extreme weather events, among many other problems (Bashir et al., 2020; González et al., 2020; Khalfaoui et al., 2021; Liu et al., 2019). These corresponding issues have also attracted the attention of more institutions, countries, politicians, and scholars. The international community has made unremitting efforts to mitigate CO2 emissions, from the United Nations Framework Convention on Climate Change in 1992 to the Paris Agreement, which has been formally implemented by 192 countries, indicating that countries around the world have reached a consensus on controlling carbon emissions (Dai et al., 2022). At the same time, academic researchers are actively exploring to provide solutions for environmental degradation and carbon reduction from different perspectives.
In recent years, on the one hand, many scholars have been exploring the relationship between the economy, society, and the environment, evaluating and providing suggestions on environmental degradation (carbon emissions’ suppression or promotion) from the perspectives of economic growth (Charfeddine & Mrabet, 2017), technological progress (Meng et al., 2023; Xu, 2022), globalization (Ahmed et al., 2021; Kirikkaleli & Adebayo, 2021), foreign direct investment (Charfeddine & Mrabet, 2017), energy consumption (Ur Rehman et al., 2023), renewable resources (Feng et al., 2022; Ur Rehman et al., 2023). On the other hand, some scholars have focused on the relationship and mechanisms between economic growth, resource consumption, and carbon emissions, conducting research from an efficiency perspective, which can be categorized into two types.
The first type focuses on the study of spatial or industry-level carbon emission efficiency. At the spatial scale, the calculation of carbon emission efficiency for 136 countries from 2000 to 2019 reveals significant differences in carbon emission efficiency among different countries and regions, with most countries having less than ideal carbon emission efficiency (Xiao et al., 2023). Due to significant differences in economic development levels, industrial structure, resource endowment, and technological innovation among different regions in China, the carbon emission efficiency of the eight regions shows significant relative efficiency gaps (Li et al., 2020). At the industry level, agricultural greenhouse gas emissions account for 10% of the total greenhouse gas emissions of the 28 European Union countries, which have decreased by 23% over the past two decades (Zafeiriou et al., 2018). The United States, Russia, South Korea, Japan, and Italy are efficient agricultural production countries, while the carbon emission efficiency of the BRICS countries needs improvement (Yasmeen et al., 2022). China has the highest carbon emissions in the world, and the logistics industry is the only industry with continuously increasing carbon intensity (Yi et al., 2021). Similarly, the transportation industry also suffers from low carbon emission efficiency, especially in the western, central, and northeastern regions (Dong et al., 2022). China is the largest contributor to CO2 emissions in the construction industry, as evidenced by an analysis of CO2 emissions from the construction industry in 40 countries (Huang et al., 2018). Relevant studies have also found that carbon emission efficiency in sectors such as coal-fired power generation in China (Fang et al., 2022) and Chinese airlines (Z. Wang et al., 2020) urgently needs improvement.
The second type focuses on the measurement of carbon emission efficiency. In terms of measuring carbon emission efficiency, existing studies mainly use the stochastic frontier analysis (SFA) and data envelopment analysis (DEA) methods. The SFA model can describe individual production processes through estimated production functions and effectively identify efficiency loss terms and random errors of the model (Fries & Taci, 2005). It has been applied in studies on greenhouse gas emission efficiency in 38 European countries (Kutlu & Wang, 2021) and carbon emission efficiency in the Yangtze River Economic Belt in China (C. Zhang & Chen, 2021), among others. DEA and its improved models, as non-parametric technical efficiency analysis methods, do not require consideration of production function forms and are more flexible than SFA models. Many scholars have used this model to conduct research in their respective fields. An evaluation of the carbon emission efficiency and its differences in 30 provinces in China from 2005 to 2015 using the DEA model revealed that the overall carbon emission efficiency of Chinese agriculture is relatively low (Zeng et al., 2019). By extending the time span and using a three-stage SBM-DEA model, the measurement of carbon emission efficiency in Chinese agriculture also showed a “low efficiency” state (X. Zhang et al., 2023). Zhou and Yu (2021) evaluated the carbon dioxide emissions from the regional construction industry in China using a three-stage DEA method, indicating that environmental factors and random errors significantly affect the carbon dioxide emission efficiency of the construction industry. Based on the expected output, the EBM-DEA model was used to estimate the carbon emission efficiency of the transportation sector in 30 provinces in China from 2010 to 2016, revealing that the sectors with the highest carbon emission efficiency are in China’s developed coastal areas (Zhao et al., 2022). Evaluation and comparison of the carbon emission efficiency of the thermal power industry in 29 provinces in China from 2014 to 2019 using the non-expected output three-stage SBM-DEA model showed significant differences in carbon emission efficiency among the provinces. As research continues to deepen, carbon emission efficiency measurement methods have become more mature. Some scholars have also used the Malmquist index method to measure total factor carbon emission efficiency (Pérez et al., 2017).
The above literature provides a foundation for the selection of spatial scale, industry dimension, and calculation methods in this study. Through the review of related literature, it was found that there is a lack of evaluation of carbon emission efficiency focusing on the animal husbandry industry (Chen, 2016; X. Zhang et al., 2020; Zou & Chaoyang, 2016).
These papers also have the limitation of empirical research based on the perspective of China’s provincial, specific regions, or city levels, and there is no comprehensive research on the overall efficiency of the animal husbandry industry in China. Therefore, it is necessary to research on the overall animal husbandry carbon emission efficiency in China to provide a scientific basis for the development of low-carbon animal husbandry farming in China.
Therefore, this study attempts to make improvements in the following aspects: First, in terms of research perspective, under the background of China’s “dual carbon” goals, based on the theories of low-carbon economy, sustainable development, and industrial economics, and taking the green development of the animal husbandry as the starting point, this study quantitatively evaluates carbon emission efficiency, accurately identifies existing problems, and provides targeted policy suggestions. Second, in terms of research methods, to overcome the shortcomings of traditional data envelopment analysis that fails to consider the influence of environmental variables, random errors, and slack variables, and to obtain more objective and accurate efficiency evaluation results, the three-stage super-efficiency SBM-DEA model with non-expected outputs and the Malmquist index method is employed to evaluate carbon emission efficiency in the animal husbandry. Third, in terms of research content, carbon emission efficiency is calculated for the national level (2002–2020), four major economic zones (eastern, western, central, and northeastern regions), and 31 provinces (autonomous regions and municipalities) in China. Tools such as the Theil index and kernel density functions are used to simulate and analyze the dynamic evolution process, taking into account regional differences’ impact on carbon emission efficiency, conducting regional comparisons, and providing a detailed analysis of spatial variations in carbon emission efficiency. The rest of this paper is organized as follows. In Section 2, we introduce the analysis methods and selection of variables, as well as the sources of data. Section 3 presents the analysis results and discusses the results. Section 4 is about the conclusion and implication, and Section 5 proposes limitations and future research direction.
Methods and Material
Three-Stage Super-Efficiency SBM-DEA Model
The Data Envelopment Analysis (DEA) method was first proposed by Charnes et al. (1978). Tone (2001) defined the non-radial Super-SBM model (Super Efficiency SBM Model, Super-SBM), which is a commonly used non-parametric method for analyzing technical efficiency. It can remove the impact of the external environment and random errors on efficiency and more effectively evaluate the efficiency of decision-making units. The application of the three-stage super-efficiency SBM-DEA model in this paper is specifically divided into the following three stages:
The First Stage
To estimate the carbon emission efficiency of China’s animal husbandry industry, denoted by DMU j (j = 1,2, ……n), for each DMU, there are m types of inputs, represented by Xi = (x1k, x2k, ……xmk); q types of desired outputs, represented by Yi = (y1k, y2k, ……yqk); and p types of non-desired outputs, represented by Bi = (b1k, b2k, ……bpk). The Super-SBM model that considers non-desired outputs is shown in Equation 1, where ρ is the carbon emission efficiency of the animal husbandry industry to be measured in this paper, Si−, Sr+, and Stb− are slack variables corresponding to input variables, desired output variables, and non-desired output variables, respectively, and λ j is a constraint condition.

The Second Stage
Construct a SFA regression model between input redundancy and environmental variables, with the following Equation 2:

where i = 1,2,…m; k = 1,2,…n; Sik represents the redundancy variable of the kth DMU for the ith input; Zk = (Z1k,Z2k,…Zhk) represents h observable environmental variables; β
i
represents the estimated coefficient of the environmental variable in the SFA regression analysis of the ith input redundancy variable. The impact of each environmental variable on the ith input redundancy value Sik is determined by. After obtaining the regression results of SFA, the estimated values of environmental variables and random errors for each decision-making unit can be obtained, and then the original input variables can be adjusted using these estimated values. The specific adjustment formula is (3), where
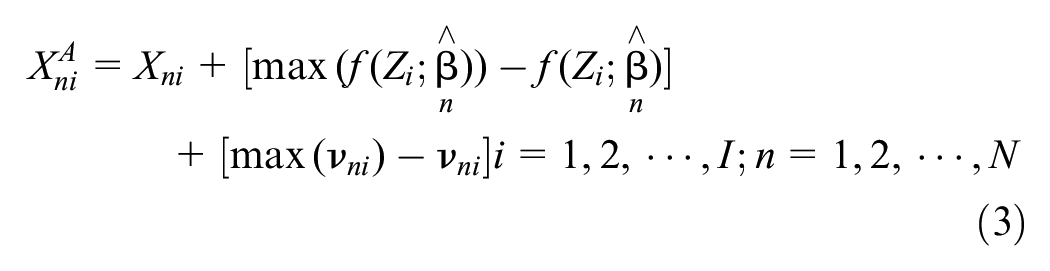
The Third Stage
The super-efficient DEA model is used to evaluate the adjusted input variable values and the initial output variable values again, so as to obtain the true efficiency values of each decision-making unit after removing the effects of environmental and random error factors.
Malmquist Index Method
This study adopts the calculation formula proposed by Caves et al. (1982) and calculates the Malmquist index, as shown in formula (4). M0 represents the productivity of the production point (Xt+1, Yt+1) at time t + 1 corresponding to (Xt, Yt) at time t.

If the scale return is not constant, the technical efficiency index (EFF) can be divided into pure technical efficiency (PECH) and scale efficiency index (SECH). As explained above, the total factor productivity index finally appears as the product of PECH, SECH, and TECH. That is:

If the comprehensive efficiency index is greater than 1, it indicates an improvement in the comprehensive efficiency level; otherwise, the comprehensive efficiency level is reduced. If one of the components that make up the comprehensive efficiency index is greater than 1, it indicates that this component is one of the factors that contribute to the improvement of the comprehensive efficiency index. Otherwise, it has a negative effect on the improvement of the comprehensive efficiency index.
Theil Index
The Theil index is introduced to illustrate the regional differences in carbon emissions efficiency of China’s animal husbandry industry. The efficiency gap is decomposed by the four major economic regions to show the overall efficiency level and regional differences. The Theil formula is as follows:

where n is the number of observed samples, which is 31 in this paper; μ is the average value of carbon emissions efficiency of the animal husbandry industry in 31 provinces (cities) of China; yi represents the carbon emissions efficiency of the ith province (city) of animal husbandry industry. The Theil index can be further decomposed into inter-regional differences Tb and intra-regional differences Tw, and the specific formula is as follows:

where yk refers to the average carbon emissions efficiency of the k-th group of provinces (cities), nk refers to the number of provinces (cities) in the kth group, and the meanings of μ, n, and yi are the same as above.
Kernel Density Analysis
Kernel density estimation is a non-parametric method used to monitor the evolution characteristics of data (Zambom & Ronaldo, 2013). Unlike parametric methods, it does not require setting a function form, and it characterizes variable changes using continuous curves, without requiring assumptions about the basic distribution. The density function (x) of variable X can be expressed as:

where n is the number of observed samples; h is the bandwidth; xi represents the carbon emission efficiency of the animal husbandry industry in province i; K(·) represents the kernel function. In this paper, the Gaussian kernel function is used to analyze the dynamic evolution law of carbon emissions in China’s animal husbandry industry.
Absolute Beta Convergence Test
Drawing on the research of Barro et al. (1991), this paper selects the specific formula for the absolute beta convergence model as follows:
The left side of the formula represents the annual average growth rate of the carbon emission efficiency of province i in period t, α is the constant term, and β is the convergence coefficient. If β < 0 and passes the significance test, it indicates a negative correlation between the initial value and the growth rate of carbon emission efficiency in the animal husbandry industry, and there is a convergence phenomenon. The convergence rate is v = −ln(1 − |β|)/T, and the half-life of convergence is s = ln(2)/v. If β > 0 and passes the significance test, it indicates a positive correlation between the initial value and the growth rate, showing a divergence characteristic, and ε it is the random disturbance term.
Variable Selection
Based on the relevant literature and the actual situation of China’s animal husbandry, this study considers labor, land, and capital as key inputs in the breeding process. People are the direct participants in breeding activities, so the labor input indicator is selected as the number of people engaged in animal husbandry. The land is the carrier of breeding activities, so the animal husbandry breeding area is selected as the land indicator. Fixed assets of animal husbandry are selected as the capital input. In addition, for output indicators, there are two types: intentional output indicators and non-intentional output indicators, which correspond to the value-added that characterizes the economic growth level of animal husbandry and the carbon emissions generated in the production process, respectively. Finally, the selection of environmental variables follows the principle that they should affect production efficiency and be unrelated to input-output. Therefore, the selection of environmental variables is based on three perspectives: economic development level, industrial structure, and regional innovation capability. The specific indicators are shown in Table 1.
Input-Output Variables.

Data Sources
The carbon emission factor data used in this study mainly comes from the “IPCC Guidelines (Bernstein et al., 2008)” and the “Provincial Greenhouse Gas Inventory Compilation Guidelines (National Development and Reform Commission, 2011).” Data on animal husbandry production, number of employees, fixed asset investment, industrial structure, and economic development level are obtained from the annual “China Statistical Yearbook,”“China Animal Husbandry Yearbook,” and “China Animal Husbandry and Veterinary Yearbook (National Bureau of Statistics, 2022).” Regional innovation capability data comes from the “2020 China Regional Innovation Capability Evaluation Report (China Science and Technology Development Strategy Research Group, 2022).” The animal husbandry breeding area comes from the “Reference Guide for Land Use in Shandong Province Animal husbandry and Poultry Farms (Shandong Provincial Bureau of Animal Husbandry and Veterinary Medicine, 2021),” and other data sources include relevant literature.
Results and Discussion
Static Three-Stage Super-Efficiency SBM-DEA Analysis
The First Stage
Based on the evaluation index system of efficiency shown in Table 1, the input and output variables are selected. The super-efficiency SBM model is used, and with the help of MaxDEA5.2 software, the initial efficiency of China’s national level, four major economic zones, and 31 provinces and cities in the animal husbandry industry between 2002 and 2020 is calculated, and the results are shown in Table 2.
First Stage Carbon Emission Efficiency Values for China’s Animal Husbandry Industry from 2002 to 2020.

Source. Editorial Committee of China Animal Husbandry Statistical Yearbook (2022), National Bureau of Statistics (2022), IPCC Guidelines (2008) is from Bernstein et al., 2008.
Note. Due to space limitations, only partial years and average values of carbon emission efficiency are listed.
From Table 2, it can be seen that the average carbon emission efficiency of China’s animal husbandry industry is 0.0018 without excluding the external environment and random interference. There are significant spatial differences in carbon emission efficiency values among different economic regions and provinces. For example, the efficiency values of Zhejiang, Shanghai, Tianjin, and Beijing are all greater than 0.5, while the efficiency values of regions such as Xinjiang, Inner Mongolia, and Heilongjiang are all less than 0.02. The efficiency values in the eastern regions are greater than 0.02, while the lowest in the western regions is less than 0.009. As the first stage did not exclude the impact of the external environment and random interference on efficiency, there is some deviation between the results and the actual situation, and further adjustments to the variables are needed for analysis. Therefore, Zou and Chaoyang (2016) used a first-stage non-radial non-expected output model (SBM model) to measure the environmental efficiency of animal husbandry industry in 31 provinces (municipalities, regions) of China from 2000 to 2013. The results showed that the overall environmental efficiency of China’s animal husbandry industry was at a moderate level, but this conclusion is not accurate.
The Second Stage
Using the input indicator slack variables calculated by the super-efficiency SBM model in the first stage as the dependent variable and the industrial structure, economic development level, and regional innovation ability in Table 1 as independent variables, a regression analysis was performed using Frontier 4.1 software to construct a random frontier model. The calculation results are shown in Table 3. If there is a positive correlation between input slack and carbon emission slack and environmental variables, it indicates that increasing environmental input will reduce the improvement of carbon emission efficiency, and vice versa will help improve carbon emission efficiency.
Results of Random Frontier SFA Regression Analysis.

Source. Industrial structure and Economic development level that the variables are collected from National Bureau of Statistics (2022); Regional innovation capability that the variables are collected from Chinese Academy of Science and Technology for Development (2020).
p < .01.
Table 3 shows that the LR one-sided test for the three input slack variables passed the 1% significance test, indicating that the SFA model is reasonably set. Based on the above results, it can be concluded that the impact direction of the industrial structure and regional innovation ability on the slack variable of employees is positive, while the impact on the slack variables of fixed asset investment and land resource input is negative. The economic development level has a positive impact on the slack variables of the number of employees and fixed asset investment, and a negative impact on the slack variable of land resource input. Due to the different external environments in different regions, the influence of external environmental factors on various input indicators is different and redundant, so it is necessary to remove the influence of environmental variables and re-conduct efficiency measurements.
The Third Stage
In the third stage of input adjustment, the adjusted input values are obtained using formula (3), and the adjusted input values and the original output are input into the super efficiency SBM-DEA model to obtain a more realistic carbon emission efficiency from 2002 to 2020 for China’s animal husbandry, as shown in Table 4.
Carbon Emission Efficiency of China’s Animal Husbandry Industry in the Third Stage from 2002 to 2020.
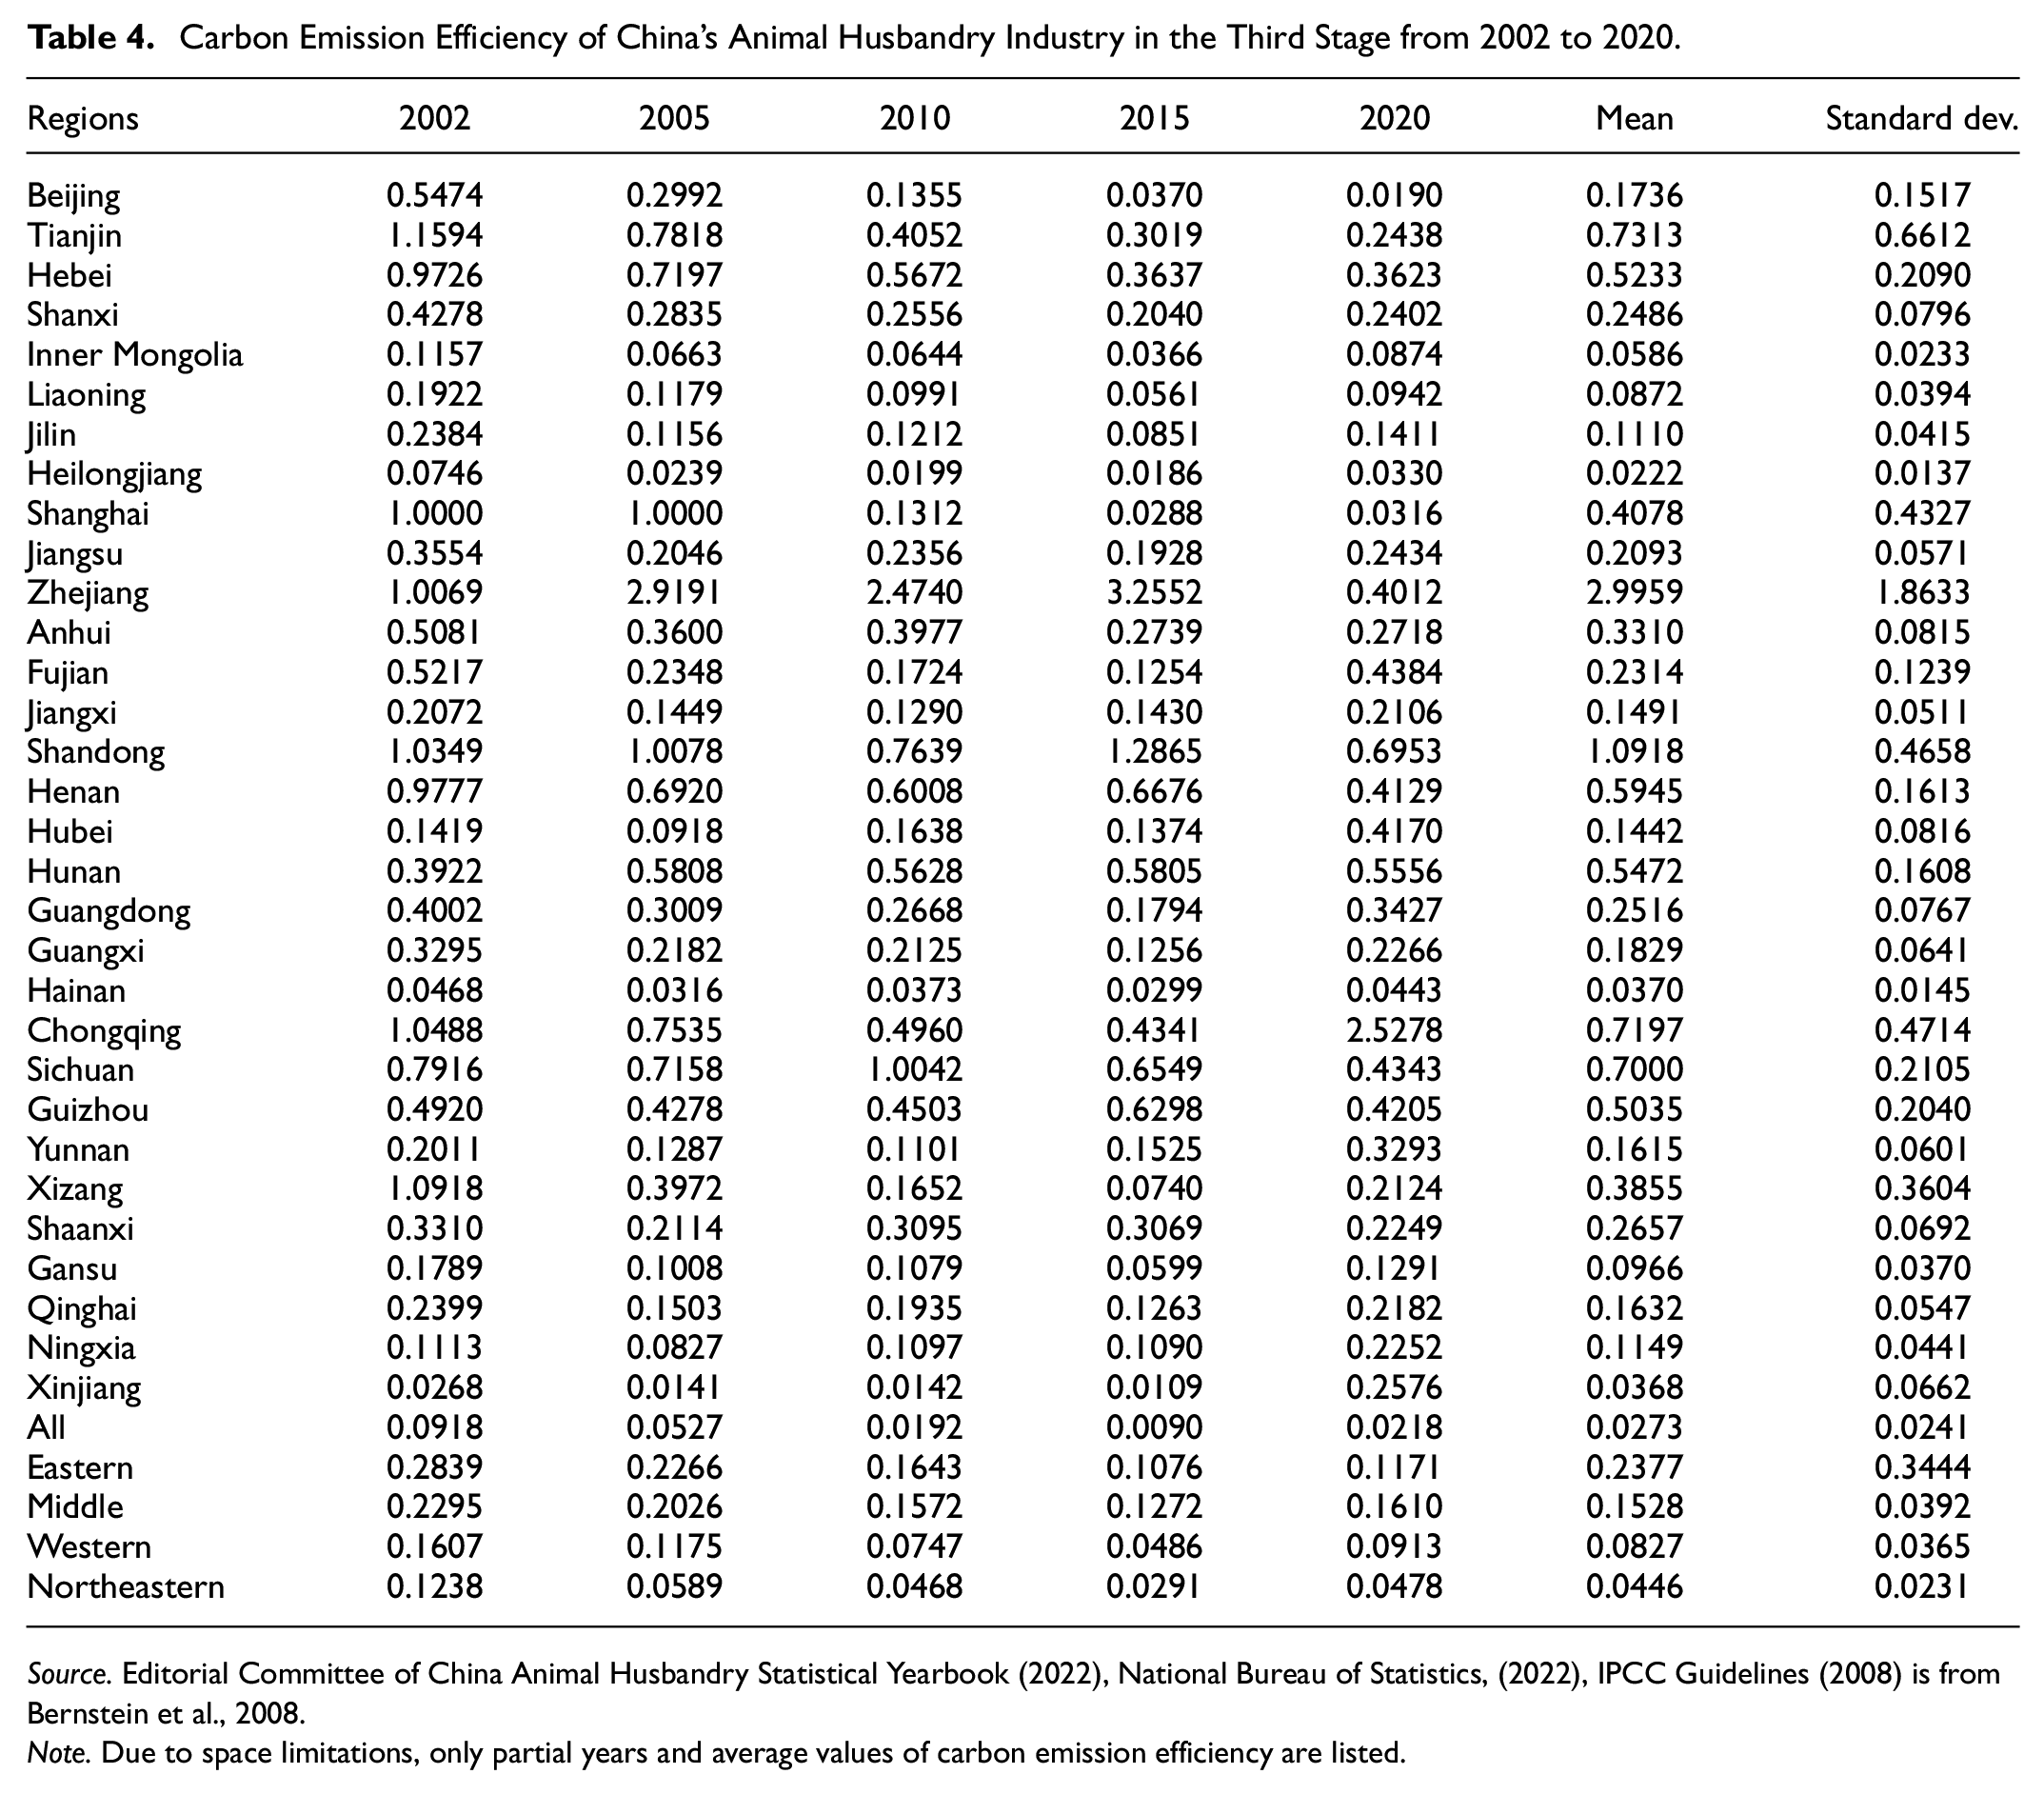
Source. Editorial Committee of China Animal Husbandry Statistical Yearbook (2022), National Bureau of Statistics, (2022), IPCC Guidelines (2008) is from Bernstein et al., 2008.
Note. Due to space limitations, only partial years and average values of carbon emission efficiency are listed.
After comparing Tables 2 and 4, it can be seen that adjusting the input items through the SFA regression model not only eliminates the effects of environmental variables and random factors but also produces more realistic results. To further reveal the spatial pattern characteristics of carbon emissions in China’s animal husbandry industry, considering that there is a large gap in carbon emission efficiency among regions, this paper adopts the “natural breakpoint method” to divide the average carbon efficiency during the study period into five levels from high to low, which are the high-efficiency zone, the medium-high efficiency zone, the medium efficiency zone, the medium-low efficiency zone, and the low-efficiency zone, to ensure that the within-class difference is minimal (Tian & Lin, 2021). Based on this, the distribution of comprehensive carbon emission efficiency in China’s animal husbandry industry is mapped using ArcGIS software (Figure 1).

Distribution of mean values of carbon emission efficiency zones in China’s animal husbandry industry from 2002 to 2020.
From the overall perspective, the distribution of carbon emission efficiency values in China’s animal husbandry industry is uneven, with carbon emission efficiency showing an “east > central > west > northeast” pattern. Provinces with low carbon efficiency are mainly concentrated in the northwest and northeast regions, which is similar to the research results of Dong et al. (2013) and Q. W. Wang et al. (2013) on regional carbon emission efficiency in China. However, the results obtained by Chen (2016) using a DEA model that did not eliminate environmental variables and random disturbances to evaluate the greenhouse gas emission efficiency of China’s animal husbandry industry and various regions were inconsistent. According to Chen (2016), the central region was relatively advanced, followed by the eastern region, and the western region was lagging behind. This inconsistency indicates that the applicability of the scholar’s research results needs further discussion. From the mean values of carbon dioxide emission efficiency from 2002 to 2020, the carbon emission efficiency of Zhejiang (2.9959) and Shandong (1.0918) is at an effective level, while the carbon emission efficiency of other provinces has not reached an effective level. The four provinces with the lowest carbon emission efficiency are Inner Mongolia, Hainan, Xinjiang, and Heilongjiang. The carbon emission efficiency value of Heilongjiang (0.0222) is as much as 134 times lower than that of Zhejiang. This is because the low-efficiency regions are influenced by regional innovation capacity, industrial structure, and economic development level. The development mode of animal husbandry in these regions is mainly traditional and extensive, with a dispersed and small development pattern, low levels of industrialization, standardization, and scale, and many pollution sources with a wide distribution. They are also limited by geographical and natural environmental factors, which result in the low carbon emission efficiency of animal husbandry in these regions. However, there is a large space for improving the carbon emission efficiency of animal husbandry in these regions, which can be achieved through the use of new feed formulas, the introduction of new technologies, and the development of new breeding models.
From the evolution trend of carbon emission efficiency in the four major economic belts during the sample period (Figure 2), except for the anomaly that occurred in the eastern region in 2008 (the 29th Summer Olympics was held in Beijing, and strict environmental regulations were implemented in the eastern region), the carbon emission efficiency in other regions has a generally consistent trend of fluctuating decline and rise. The carbon emission efficiency of each economic belt is relatively low and has not reached an effective level. It should be noted that from 2002 to 2008, the efficiency curve of the central region was lagging behind that of the eastern region. From 2008 to 2020, the efficiency growth rate of the central region increased significantly, and its efficiency curve exceeded that of the eastern region. The efficiency curve shows overlapping and “catching up” characteristics, and it is in a leading position. On the one hand, according to the theory of technology diffusion, technology has “spillover effects,” and advanced production factors will flow to other regions, driving the progress of surrounding regions. On the other hand, this may be related to the partial industrial transfer and industrial structural adjustment in the eastern region during the 2008 financial crisis. The northeastern region is at the lowest level, exhibiting a multi-“W” shaped pattern overall and showing a staged characteristic. This is highly correlated with the relevant policies introduced by the Chinese government and outbreaks of animal-related epidemics. This finding is also in strong agreement with the research conducted by X. Zhang et al. (2023), which used an over-efficient SBM model to study the green total factor productivity of animal husbandry industry in the northeastern region under carbon emission constraints.

Characteristics of changes in carbon emission efficiency for the four major economic belts in the animal husbandry industry from 2002 to 2020.
At the provincial level, carbon emission efficiency in Zhejiang province fluctuated the most dramatically among the sample years, with its efficiency value increasing from 1.0068 to a peak of 7.0148, with a high standard deviation of 1.8633. Tianjin, Chongqing, Shandong, and Shanghai followed closely behind, with Tianjin having a less volatile trend than Zhejiang, with a standard deviation of 0.6611, but overall trending downward from a strong effectiveness of 2.364 in 2009 to a weak effectiveness of 0.2438 in 2020. Liaoning, Gansu, Inner Mongolia, Hainan, and Heilongjiang provinces showed stable performance in carbon emission efficiency during the sample years, with differences of less than 0.04. Overall, most western and northeastern provinces in China’s animal husbandry industry were constrained by factors such as resource endowment, industry structure, brain drain, and slow economic development, making it difficult to improve carbon emission rates.
Dynamic Analysis of Carbon Emission Efficiency Based on the Malmquist Total Factor Productivity Index
Given that the previous three-stage super-efficiency SBM-DEA calculation analyzed changes in carbon emission efficiency statically, this paper uses the Malmquist index to further analyze the dynamic evolution of carbon emission efficiency.
As shown in Table 5, there were 10 intervals with a Malmquist productivity index (MI) greater than 1 in China’s animal husbandry industry between 2002 and 2020, accounting for 52.6% of the overall total, with a mean of 1.0908, indicating an upward trend in total factor productivity during the sample period. The mean values of technological progress change (TC), technological efficiency change (EFF), and scale efficiency change (SECH) were all greater than 1, indicating that technological progress, technological efficiency, and scale effects played a significant role during the study period. The mean value of pure technical efficiency (PECH) was less than 1, indicating that China’s animal husbandry industry may still have shortcomings in the development of new technologies and products, especially in the area of environmental governance in breeding areas and carbon efficiency control, where there is a serious lack of new technology, new product research and development, and usage, and the level of technology needs to be improved.
Malmquist Index and Its Decomposition Index for China’s Animal Husbandry Industry from 2002 to 2020.

Source. Editorial Committee of China Animal Husbandry Statistical Yearbook (2022), National Bureau of Statistics, (2022), IPCC Guidelines (2008) is from Bernstein et al., 2008.
Table 6 shows the Malmquist index and its decomposition index for carbon emissions of 31 provinces and four economic zones in China. Looking at the four economic zones, the total factor productivity (MI) index was highest in the eastern region, followed by the central, western, and northeastern regions, with a mean value of 1.2853, all of which were greater than 1. The carbon emission efficiency increased by an average of 28.53% annually, with the fastest increase in the eastern region at 73.2%, followed by the central region, then the western region, and the slowest in the northeastern region, which was below the average. The main factors contributing to the carbon emission efficiency in different regions vary greatly. In the eastern region, where the economic development level is higher, most provinces lead in carbon emission efficiency, and the significant increase in productivity resulting from technological progress has significantly promoted the improvement of carbon emission efficiency. The improvement in carbon emission efficiency in the central and western regions mainly relies on the improvement of technological efficiency. The provinces in these regions have achieved an improvement in carbon emission performance while catching up with benchmark regions. The progress in the central region is particularly significant, with an average annual increase in carbon emission technological efficiency of 23.12%, which also confirms the phenomenon shown in Figure 2 that the carbon emission efficiency in the central region surpasses that in the eastern region. Similar to the economic development model, under the influence of various factors such as national industrial layout, economic structure, and regional advantages (Qingfeng, 2012),the pressure for energy conservation and emission reduction, as well as the transformation and upgrading of the animal husbandry industry, is considerably high in the economically relatively underdeveloped western and northeastern regions.
Malmquist Indices and Their Decomposition Indices of Animal Husbandry Production in 31 Provinces and Four Major Economic Zones in China from 2002 to 2020.

Source. Editorial Committee of China Animal Husbandry Statistical Yearbook (2022), National Bureau of Statistics, (2022), IPCC Guidelines (2008) is from Bernstein et al., 2008.
Note. Due to space limitations, only partial years and average values of carbon emission efficiency are listed.
Looking at the annual average Malmquist index of each province, all 31 provinces (autonomous regions, municipalities) were above 1.2, indicating a significant efficiency improvement during the study period, showing an upward trend, which was mainly driven by technological efficiency change and supplemented by technological progress change. Through correlation analysis, it was found that the Malmquist index had a significant positive correlation with technological progress and technological efficiency change, which contradicts the research conclusion that technological efficiency change is not related to carbon emission efficiency change (Ang & Zhang, 2000). This further illustrates that technological progress and technological efficiency are key factors affecting carbon emission efficiency changes. Looking at the efficiency change index, which includes pure technological efficiency change index and scale efficiency change index, the scale efficiency change in all regions was greater than pure technological efficiency change, indicating that the improvement in carbon emission efficiency in China’s animal husbandry largely depends on industrial scale rather than pure technological progress, which is fully consistent with the development process and current situation of China’s animal husbandry.
Analysis of Regional Differences in Carbon Emission Efficiency
The study used the Theil index method to decompose the regional differences in carbon emission efficiency of the animal husbandry industry. The specific calculation results are shown in the table below. Table 7 visually displays the Theil index of carbon emission efficiency and its decomposition gap values and contribution rates for the animal husbandry industry in China and its four major regions. From the perspective of overall difference, the Theil index of carbon emission efficiency for the animal husbandry industry increased year by year from 2002 to 2007, then began to decrease slightly, and reached the level of 2004 in 2011. It started to rise sharply in 2012, reached its peak in 2018, and then began to decline. Specifically, the highest and lowest values of the Theil index appeared in 2018 and 2002, respectively, at 0.7027 and 0.1217. In terms of structural decomposition, except for some years (2006 and 2018), the contribution of within-group differences in carbon emission efficiency of the animal husbandry industry has always been higher than 30%, reaching 70% in 2020. In terms of gap decomposition, from 2002 to 2011, the Theil index of within-group differences in the eastern region was low, and it gradually increased after 2011. The Theil index in the central region fluctuated greatly, while the western and northeastern regions remained relatively stable during the study period, with the western region slightly higher than the central and northeastern regions. After 2018, the Theil index in the eastern and central regions began to decline, indicating a trend toward balanced development of carbon emission efficiency in the animal husbandry industry in these regions, with a slight reduction in the level of efficiency gap between provinces and regions within them.
The Decomposition of China’s Animal Husbandry Carbon Emission Efficiency and Its Theil Index from 2002 to 2020.

Source. Editorial Committee of China Animal Husbandry Statistical Yearbook (2022), National Bureau of Statistics, (2022), IPCC Guidelines (2008) is from Bernstein et al., 2008.
Figure 3 further illustrates the changes in the Theil index of carbon emission efficiency in China and its four major regions. From the trend of the Theil index decomposition, during the research period, the overall gap in China’s animal husbandry industry carbon emission efficiency was mainly due to intra-group and inter-group differences. The development trend of these two factors was basically similar to that of the overall gap curve, showing a slight increase in the early stage, followed by a gradual decline, a sudden increase, and a slight decrease again at the end of the study. J. X. Zhang and Wang (2020) divided China into three major regions: eastern, central, and western regions. Using data from 1997 to 2007, they conducted a study on regional carbon emissions in the animal husbandry industry in China, focusing on carbon emissions. The conclusion indicated that there was overall fluctuating growth in the differences in carbon emissions, but the magnitude of the growth was relatively small. The contribution of within-region differences in animal husbandry industry carbon emissions showed a trend of initially increasing and then decreasing, while the contribution of inter-regional differences exhibited a trend of initially decreasing and then increasing. These findings, from a quantitative perspective, contradict the results of this study, which focused on efficiency and regional differences. From a methodological standpoint, both approaches have their advantages, but in terms of the current academic frontier and the formulation of effective emission reduction policies, this study is more informative and applicable.

The trend of the Theil index and its decomposition of carbon emission efficiency in China’s animal husbandry industry from 2002 to 2020.
Furthermore, according to the division of gaps into intra-regional gaps in the eastern, central, western, and northeastern regions, the results show that the intra-regional gap in the eastern region is the closest to the overall gap, followed by the western region. Since 2012, only the eastern region and the overall gap have been intertwined, and the Theil index of their intra-group gaps is much higher than that of the central, western, and northeastern regions. During the research period, the eastern and western regions have always been intertwined. After 2004, the intra-group gap curve in the northeastern and central regions was much lower than the overall curve, and the gap with other regions was very large. Overall, as of 2018, the Theil index of carbon emission efficiency in China’s animal husbandry industry showed a fluctuating upward trend, indicating that the gap in carbon emission efficiency in China’s animal husbandry industry is constantly widening, and the overall trend of animal husbandry development is toward non-equilibrium and high carbonization. In terms of time periods, from 2002 to 2011, the Theil index of carbon emission efficiency in the animal husbandry industry showed a fluctuating upward trend, and after reaching a continuous low point in 2011, it began to rebound, indicating that the gap in carbon emission efficiency was not significant during this period. Starting in 2012, there was a rapid increase until 2018, reaching a peak, indicating that with the gradual emergence of economic contributions, various regions vigorously developed animal husbandry industry through their own location or resource endowments, and the carbon emission efficiency of animal husbandry industry in various provinces and regions showed differentiated and non-equilibrium characteristics. Since 2019, the Theil index of the overall gap in China’s animal husbandry industry carbon emission efficiency has been continuously decreasing, and the overall difference is gradually narrowing, which may be closely related to the severe economic recession caused by the COVID-19 pandemic.
Kernel Density Estimation Analysis
Combining formula (7) and using Stata16.1 software, the years 2003, 2008, 2013, 2018, and 2020 were selected as the examination profiles to conducting kernel density estimation of carbon emission efficiency in China and its Eastern, Central, Western, and Northeast regions (see Figures 4 and 5), in order to analyze the temporal evolution characteristics of carbon emission efficiency in animal husbandry.

Kernel density estimation of carbon emission efficiency in China’s animal husbandry.

Kernel density estimation of carbon emission efficiency in the four major economic belts of China’s animal husbandry.
From the position of the curve, the center of the kernel density curve shows a trend of “left-right” movement, indicating that the overall carbon emission efficiency gradually decreased and then quickly improved, and the growth rate accelerated in the later stage; from the shape, compared with 2003, the main peak of the kernel density curve in 2018 has a narrower shape, indicating that the convergence trend of the medium-level carbon emissions within the region is obvious, due to the free flow of production factors, the spillover of breeding technology, and the acceleration of regional integration; however, from 2018 to 2020, the kernel density curve changed from a “tall and thin” type to a “thick and fat” type, indicating that the overall difference in carbon emission efficiency in animal husbandry showed a trend of first weakly narrowing and then gradually expanding; from the shape of the tail, the right tail of the curve is longer than the left tail each year, and the right tail shows a trend of lengthening and decreasing, indicating that some provinces and cities with lower efficiency have appeared as low-value clusters, and the proportion of cities with high-efficiency values is lower than those with low-efficiency values, and the proportion of provinces and cities with higher efficiency values is lower. Finally, compared with 2003, the density curve of China’s animal husbandry carbon emissions in 2020 has a shorter right tail and increased thickness, indicating that with the implementation of environmental regulation policies, high-carbon emission areas have shown a trend of emission reduction, and the number of areas with slightly higher carbon emissions has increased.
Figures 5-1 to 5-4 represent the kernel density estimation graphs of carbon emissions from animal husbandry in the eastern, central, western, and northeastern regions, respectively. From Figure 5–1, it can be seen that there is an obvious right-skewed phenomenon in the kernel density estimation of carbon emissions efficiency in animal husbandry in the eastern region, and the range of the right-skewed phenomenon has expanded and contracted in waves from 2002 to 2020. This indicates that there is a significant difference in carbon emissions efficiency between high and low provinces (cities) in the eastern region, but the degree of difference between high and low provinces (cities) has increased and then decreased. Secondly, from the peak, the carbon emissions in animal husbandry in the eastern region have undergone an evolution from “double peaks” to “single peak,” indicating that the carbon emissions in animal husbandry in the eastern region are gradually evolving from multipolarization to unipolarization. Thirdly, the center of the kernel density function shows a leftward shift followed by a rightward shift, indicating that the carbon emissions efficiency in animal husbandry in various provinces (cities) in the eastern region first decreased, then increased, and then decreased again. Finally, the height of the main peak of the kernel density first decreased and then increased, but the range of the curve width decreased significantly, indicating that the difference in carbon emissions from animal husbandry between various provinces (cities) in the eastern region may change significantly.
From Figure 5–2, it can be seen that there are the following evolutionary patterns in the carbon emission efficiency of the animal husbandry industry in the central region: First, the kernel density estimation of carbon emission efficiency of the animal husbandry industry in the central region shows a less obvious right-skewed phenomenon, and the range of right-skewness is generally shrinking, indicating that there is not a very significant difference between the high and low carbon emission efficiency provinces (cities) in the central region, but the degree of difference between high and low provinces (cities) is generally decreasing. Second, from the peak, the carbon emissions of the animal husbandry industry in the central region exhibit obvious “bimodal” and “multimodal” phenomena, indicating a trend toward polarization in carbon emissions efficiency of the animal husbandry industry in various provinces (cities) in the central region. Third, the center of the kernel density function shows a phenomenon of first rightward shift and then leftward shift, indicating that the carbon emission efficiency of the animal husbandry industry in various provinces (cities) in the central region first increased and then decreased. Finally, overall, the height of the main peak of the kernel density decreased, and the change in curve width was relatively weak, indicating that the difference in carbon emissions efficiency among various provinces (cities) in the animal husbandry industry in the central region has a certain degree of increasing trend.
The following evolutionary patterns can be observed in the carbon emissions efficiency of the animal husbandry industry in the western region from Figure 5–3: First, the kernel density estimation of carbon emissions efficiency in the animal husbandry industry in the western region showed a clear right-tail phenomenon in 2020, and the range of the right-tail first narrowed and then expanded. This indicates that the difference in carbon emissions efficiency among provinces (cities) in the western region is showing a trend of narrowing, and there is no significant difference between high and low provinces (cities), but the degree of difference between high and low provinces (cities) is showing a trend of decreasing first and then increasing. Secondly, from the peak, the animal husbandry industry in the western region showed a clear “multi-peak” phenomenon, indicating that the carbon emissions efficiency of the animal husbandry industry in various provinces (cities) in the western region showed a trend of polarization. Thirdly, the center of the kernel density function showed a phenomenon of first leftward and then rightward movement, indicating that the carbon emissions efficiency of the animal husbandry industry in various provinces (cities) in the western region first decreased and then increased, and overall, it showed a trend of more. Finally, overall, the height of the main peak of the kernel density showed an upward trend, and the width of the curve also showed a trend of narrowing, indicating that the difference in carbon emissions efficiency among provinces (cities) in the animal husbandry industry in the western region is increasing.
From Figure 5–4, the following evolutionary patterns can be observed in the carbon emissions efficiency of the animal husbandry industry in the northeastern region: First, the kernel density estimation curve of carbon emissions efficiency of the animal husbandry industry in the northeastern region did not show a clear right-tail phenomenon during the study period, and the curve was generally flat and wide, indicating that the difference in direct carbon emissions efficiency among provinces in the northeastern region did not increase. Secondly, the center of the kernel density function showed a phenomenon of first leftward and then rightward movement, indicating that the carbon emissions efficiency of the animal husbandry industry in each province first increased and then decreased, but there was a clear “single-peak” when the curve moved leftward in 2013, indicating that the efficiency value was concentrated during that period, and the phenomenon of carbon emissions efficiency value reduction and polarization was weakened. In 2020, there was a clear rightward movement, indicating that the carbon emissions efficiency of the animal husbandry industry in each province (city) in the northeastern region began to improve. Finally, the height of the main peak of the kernel density showed an upward trend, and the width of the curve also showed a trend of narrowing, indicating that the difference in carbon emissions efficiency among provinces in the animal husbandry industry in the northeastern region is showing a trend of increasing and then decreasing.
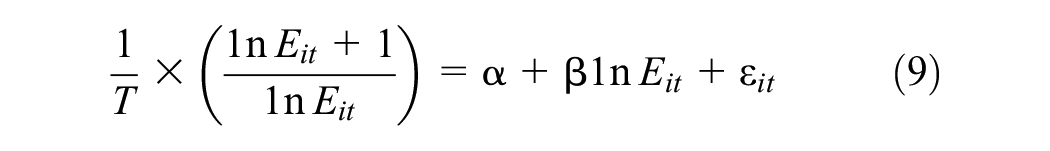
Absolute β Convergence Test Estimation
According to the absolute β convergence formula (9), this paper selects a time interval of 1 year, that is, T = 1, and uses Stata16.0 software to perform regression using the OLS model (where cons is the constant term, V is the convergence speed, and S is the half-life of convergence). The regression results are shown in Table 8. Table 8 shows the absolute β convergence test results for the carbon emission efficiency of China’s animal husbandry industry from 2002 to 2020.
Results of Absolute β-Convergence Test of Carbon Emission Efficiency in China’s Animal Husbandry from 2002 to 2020.

Source. Editorial Committee of China Animal Husbandry Statistical Yearbook (2022), National Bureau of Statistics, (2022), IPCC Guidelines (2008) is from Bernstein et al., 2008.
p < .01. **p < .05. *p < .1.
From Table 8, it can be seen that the β coefficients of the entire country and the four regions (East, Central, West, and Northeast) are all greater than 0 and have passed the significance test. This indicates that there is no absolute β convergence phenomenon in the carbon emission efficiency level of the animal husbandry industry in the country as a whole and in the four regions, but rather a divergent trend. This suggests that even under similar conditions such as economic development level, resource endowment, and industrial structure, the carbon emission efficiency level of the animal husbandry industry in some provinces and regions will eventually show different development trends and different efficiencies over time. Provinces and regions that were initially at a low level of carbon emission efficiency may not necessarily catch up with those at a high level at a faster pace, and there may be fluctuations in efficiency values or the gap may gradually widen, which is consistent with the analysis in the previous sections. It should be noted that the above estimation results of the absolute β convergence test are based on the judgment made under the context where the comprehensive factors such as economic development level, industrial structure, and animal husbandry industry development environment are similar among provinces and regions. However, in reality, there are heterogeneities among provinces and regions.
Conclusions
This study is based on panel data of China’s animal husbandry industry from 2002 to 2020. It comprehensively uses the three-stage super-efficiency SBM-DEA model, SFA method, and Malmquist index method to measure the carbon emission efficiency of China’s animal husbandry industry at the national level, four economic belts, and 31 provinces (autonomous regions and municipalities) from both static and dynamic aspects. It also uses methods such as the Theil index, kernel density estimation, and absolute β-convergence test to analyze the sources, evolution characteristics, and convergence status of carbon emission efficiency differences, and finally draws the following conclusions:
(1) From a static perspective, the distribution of carbon emission efficiency values in China’s animal husbandry industry is uneven, with a pattern of “eastern > central > western > northeastern.” Provinces with low carbon efficiency are mainly concentrated in the northwest and northeast regions. The carbon emission efficiency trends of the four economic belts are generally consistent (excluding 2018), showing a wave-like downward and upward trend, and the carbon emission efficiency of each economic belt is generally low and has not reached an effective level. Only two provinces, Zhejiang and Shandong, have reached effective levels of carbon emission efficiency among the 31 provinces and cities. Other backward regions face great pressure to increase carbon emissions due to factors such as resource endowment, industrial structure, talent loss, and slow economic development.
(2) From a dynamic perspective, the total factor productivity shows an upward trend, and technological progress, technical efficiency, and scale effect all play a significant role. However, pure technical efficiency has a deficiency, with a mean value of less than 1. From the perspective of economic belts, the total factor productivity index of the eastern region > central region > western region > northeastern region, and the mean values are all greater than 1. However, the speed of improvement in the northeastern region is lower than the average value. As an old industrial base in China, the energy-saving and emission reduction and industrial transformation and upgrading of animal husbandry are not optimistic. Looking at the annual average Malmquist index of each province, the changes in scale efficiency are greater than the changes in pure technical efficiency, indicating that the improvement of carbon emission efficiency in the animal husbandry industry depends largely on industrial scale rather than pure technological progress, which is completely consistent with the development process and current situation of China’s animal husbandry industry.
(3) From the temporal and spatial evolution of carbon emission efficiency, the overall difference in carbon emission efficiency mainly comes from within-group and between-group differences, showing a trend of “upward-downward-sharp increase-slow decrease,” and the difference is continuously expanding. The development of animal husbandry is tending toward imbalanced and high carbonization. It is difficult to return to the research’s initial state in the short term. The kernel density curve shows that the overall carbon emission efficiency gradually decreases and then quickly increases, and the growth rate accelerates in the later period. The overall difference shows a trend of first slight narrowing and then gradually widening. According to the economic belts, the differences between provinces (cities) with high and low carbon emission efficiency are obvious, and a trend of polarization of animal husbandry carbon emission efficiency is emerging. The absolute β-convergence results show that there is no absolute β-convergence phenomenon in the carbon emission efficiency level of China’s animal husbandry industry as a whole and the four economic belts, showing a divergent feature. Provinces and regions with low initial carbon emission efficiency levels may not catch up with those with high levels at a faster rate. There may be fluctuations in efficiency values or the gap may gradually widen.
The efficiency of carbon emissions in the animal husbandry industry is not isolated, and there is interdependence among various regions. In order to effectively control the carbon emissions of the animal husbandry industry and further improve its emission efficiency, based on the above conclusions, propose the following suggestions:
(1) Guiding the development of animal husbandry with green and circular development concepts, and accelerating the transformation of animal husbandry production methods. To accelerate the transformation of animal husbandry development, more attention should be paid to ecological environment protection and pollution control. It is necessary to adhere to the coordination of good breeds, good practices, and production ecology, establish and implement standardized feeding management regulations that are tailored to local conditions and different types of livestock, and establish a sound standardized production system. Governments at all levels should play a leading role, carry out the creation of standardized cooperatives, comprehensively improve the integration of quality and organized production and operation levels of leading enterprises, utilize spillover effects, enhance demonstration and driving effects, shift from primarily relying on resource input to relying on technological innovation and improving labor quality, and shift from primarily relying on resource consumption to sustainable development, realizing the organic unity of ecological benefits, economic benefits, and social benefits, and promoting the green development of animal husbandry.
(2) Increase fiscal expenditure on animal husbandry and establish a long-term mechanism to support the low-carbon, green, and circular development of animal husbandry. Improve the accuracy, pertinence, and scientific nature of government investment in animal husbandry, and provide financial subsidies and tax incentives to enterprises that introduce, adopt, and develop new technologies on a large scale. Encourage investment entities to increase investment in carbon reduction and efficiency-enhancing facilities and equipment in animal husbandry, and implement active technological subsidy measures. Introduce supportive policies for low-carbon development of animal husbandry as soon as possible, establish a fiscal incentive system and financial service system guided by “carbon reduction and carbon sink,” and due to the vast territory of China and the different livestock categories in different regions due to resource endowments, explore the compensation mechanism for ecological environment in the main sales areas to connect with the carbon emission benefits in the main production areas.
(3) Strengthen mutual learning and promote the construction of a regional coordinated development mechanism for carbon emissions in animal husbandry. As analyzed in the previous text, there are significant regional disparities in the carbon emission efficiency of animal husbandry in China. In order to reduce these regional gaps, on the one hand, all regions of the country should strengthen mutual assistance, give play to complementary advantages, actively explore inter-regional cooperation between the eastern, central, western, and northeastern regions, integrate the economic development, technological innovation, and financial advantages of the eastern region with the resource advantages of the central and western regions. The northeastern region can leverage its land resource advantages and actively explore new models of investment attraction. On the other hand, a regional information-sharing platform should be established to achieve extensive information-sharing from regions to regions and from governments to enterprises and the general public, further enhancing management efficiency.
Limitations and Future Research
This study empirically analyzes the regional differences and spatial effects of carbon emission efficiency in animal husbandry. However, this study has limitations such as the parameter selection being too general, focusing mainly on the livestock industry as the research object, involving very few related industries, and having a limited number of reference literature, resulting in weak comparability. The depth of the research in this study still needs to be further improved. In future research directions, deeper exploration can be conducted in the following aspects: Firstly, there is no unified standard for measuring carbon emission efficiency indicators on a global scale. Therefore, further research can be conducted on carbon emission efficiency measurement indicators at the provincial level. Secondly, the scope of this study is limited to the 31 provinces in China, only from the perspective of domestic provinces, and the spatial correlation of carbon emission efficiency between countries has not been studied. There have been very few studies on cross-national environmental issues, so international environmental issues are also one of the future development directions. Finally, under the background of “dual carbon,” subsequent countries and regions will gradually introduce relevant policies and measures, and evaluating the effectiveness of these policies and measures will be a key research direction.
Footnotes
Declaration of Conflicting Interests
The author(s) declared no potential conflicts of interest with respect to the research, authorship, and/or publication of this article.
Funding
The author(s) disclosed receipt of the following financial support for the research, authorship, and/or publication of this article: This work was supported by the research grant of Pai Chai University in 2023.
Ethics Statement
This paper does not deal with animal and human studies.
Data Availability Statement
The datasets used or produced in this study can be obtained from the corresponding author upon resonable request.