
Abstract
The fundamental reason for the series of difficulties in the development of the cultural and creative industry is the imbalance between the various links in the cultural and creative industry chain. The strategic method of how to promote the optimization and upgrade of cultural and creative supply chain is critical. In the process of supply chain transformation and upgrading, the scientific evaluation of supply chain efficiency is regarded as an essential basic work. Then, a three-stage data envelopment analysis (DEA) model for evaluating a cultural and creative supply chain in China as well as in each province is presented. It combines the relevant data from 30 provinces in mainland China from 2013 to 2019, and focuses on the impact of the different influencing factors on cultural and creative supply chain efficiency. Besides, it compares and analyzes the calculated efficiency before and after the adjustment. After excluding environmental factors and random factors, the research shows that the cultural and creative efficiency in various regions has changed significantly, and the actual efficiency has a spatial imbalance. The results after data adjustment show that the annual efficiency values of the eastern and midland are higher than 0.70, while the northeast and western regions are lower than 0.50. Besides, green policy support from the government will have a negative impact on the number of outlets and employees of cultural enterprises, the sustainable development and low-carbon protection will have a positive impact on the two input slack variables.
Plain language summary
This paper mainly evaluates the supply chain efficiency of cultural and creative industries in China, focusing on the influence of different environmental factors on the supply chain efficiency of cultural and creative industries. At present, the cultural and creative industry has received much attention, and improving the cultural and creative supply chain efficiency can promote the further development of the industry. Efficiency improvement can not only reveal the overall development level of the industry, but also find the difference in development quality between cities. It can better support the high-quality development of the industry and supply chain. We propose measures to promote supply chain efficiency. We hope to fill in the gaps in the subject and method of this topic and provide reference for further study in the subsequent part of this series of articles. In the research process, we use the three-stage data envelopment analysis method (an evaluation method that can measure industrial efficiency under the condition of multi-input and multi-output). The final results show that after eliminating environmental factors and random factors, the cultural creative efficiency changes significantly in each region, and the development of technical efficiency is unbalanced in each region. Increasing the efforts of sustainable development and low-carbon protection can improve the efficiency of the study subjects.
Keywords
Introduction
Since the introduction of cultural and creative products, this industry has developed rapidly (Mezias & Mukti, 2018; Santoro et al., 2018). With the accelerated development of industrialization, informatization and agricultural modernization, cultural and creative industries have penetrated into various fields of economy and society (Correa-Quezada et al., 2018; De Beukelaer, 2014). Cultural and creative industries have made great contributions to the global economy and employment, and their technological upgrading has speeded the development of science and technology (Budnitsky & Jia, 2018; Prados-Peña & Del Barrio-García, 2021). The digital strategy of the cultural industry has brought new vitality to cultivate key cultural enterprises. It standardizes the development of cultural industry parks and promotes the construction of regional cultural industry belts (Klein et al., 2021; Luo, 2021; Moore, 2014). Besides, it points out the correct direction and provides a solid foundation for the high-quality development of cultural industries, and the importance of cultural and creative industry development is obvious (Černevičiūtė et al., 2019). In China, the scale of the cultural and creative industry continues to expand, and the distribution of industrial parks gradually spreads from the eastern coastal areas to the central and western regions (Hu & He, 2021). The cultural and creative industry, an emerging industry, was first proposed in the Eleventh Five Year Plan for cultural construction in 2006. During this period, the proposal of several targeted policies has promoted the long-term active development of cultural and creative industries (Qiu, 2022; Wang, 2021). The government attaches great importance to cultural and creative industry. It strengthens the combination of products and traditional culture, so that the development of cultural and creative industry has certain advantages in China (Fan & Zheng, 2013). At the same time, China pays more attention to improving the ability of cross-cultural creative communication worldwide and grasping the cultural characteristics of different countries in the research of cultural and creative industries. Therefore, it is helpful to study the development of Chinese cultural and creative industries. In summary, it is meaningful to choose China as the research object for developing cultural and creative industries.
The production process of cultural and creative industries involves member exchanges, content creativity, production, technical support, and marketing promotion (C. Xu, 2019). If the quality of cultural and creative products is to be guaranteed, it requires high coordination of these processes in the supply chain. Therefore, it is significant to research the coordination of various parts of the cultural and creative industry supply chain (Campbell et al., 2019). Promoting the further optimization of the cultural and creative industry supply chain is a meaningful measure to cultivate new growth points in the national economy, and enhance national cultural soft power and core competitiveness (Dixon, 2022; Sava, 2018). It is also an important way to promote product and service innovation, meet diversified consumer demand, and improve people’s quality of life (Colombo, 2018). In the global economic environment, the competition between enterprises has changed to supply chain competition (Moniz, 2021; Stoilova, 2020). Supply chain factors have become the key link for enterprises to seek innovation and improve their innovation ability (Zhou, Xu, & Zhang, 2024). At the same time, the current development direction of the industry is to combine the supply chain and the concept of green development (Dey, Yilmaz, & Seok, 2022; Dey, Park, & Seok, 2022). Although the cultural industry chain has been initially formed, there still a considerable gap in the maturity of the system. Due to the low civil penetration rate, lack of modern sense of supply chain, and too few profit channels, such as marketization difficulty of industry and blocked supply chain circulation, have intensified. There are few studies on the efficiency of the cultural and creative supply chains. Most of them are theoretical studies, and the literature on the quantitative analysis of the current situation of cultural and creative industries rarely studies the impact of supply chain factors on enterprises. At the same time, DEA and its expansion model are the main models for evaluating supply chain efficiency. Input-output index and environmental index are not related to green and low carbon index.
Based on the DEA model, industry efficiency can be measured by multiple factors, which can satisfy the difficulty of determining the index weight. The results obtained by the three-stage DEA model can be more accurate and produce more information. Using the three-stage DEA model can effectively evaluate the efficiency of the cultural and creative supply chain. In this study, 30 provinces (municipalities and autonomous regions) in mainland China’s provincial regional cultural and creative industry are selected, with the number of creative design patents, operating income of the cultural service industry and sales income of publications as output indicators, the number of cultural enterprises unit outlets and employee number as input indicators, and three-stage DEA model is used to evaluate their input-output efficiency. Through the empirical analysis, this paper expects to make up for the gaps in research objects and methods and increase the reliable basis for the improvement of the theoretical system. At the same time, it can reveal the overall development level of the road freight industry in the region and the development quality difference between cities. Thus, this paper takes the cultural and creative supply chain as the starting point and analyzes the impact of the varied influencing factors on the cultural and creative supply chain according to the industry supply chain characteristics.
There are some innovations in this paper. On the one hand, the article will analyze the supply chain efficiency of the cultural and creative industry, which is a research direction in that few people are involved. The relevant research results can fill some gaps. On the other hand, this paper will build a model evaluation system combined with ecological environmental protection indicators, aiming to analyze the positive and negative effects of environmental factors on efficiency, and summarize the development suggestions for the cultural and creative supply chains. The relevant indicators proposal meets the requirements of low-carbon emissions, promotes green GDP accounting, and promotes high-quality development of the industry.
Literature Review
Cultural and creative industries take creativity as the core and have the characteristics of creativity, cultural heritage and intellectual property rights (Casey & O’Brien, 2020). It can be shown in broadcasting, film and television, animation, audio and video, media, visual art, performing art, technology and design, sculpture, environmental art, advertising and decoration, clothing design, software and computer services. The definition of the cultural creative industry includes two main viewpoints. The first is the economic sector of the creative industry, which mainly refers to the cultural and creative sector within the scope of intellectual property law protection (Hewkins, 2002). The second is the industry that can provide consumers with products or services related to culture, art or entertainment (Caves, 2002). Under the trend of globalization, cultural and creative industries increasingly need high-quality and multidimensional. Klein et al. (2021) proposed that cultural and creative industries are essentially digital, but the development of their non-digital parts is stagnant. Therefore, the key to cultural and creative industries is to promote the healthy development of sustainable ecosystems (Klein et al., 2021). Luo (2021) proposed that the design of cultural and creative industries should shift more to emerging economic forces. To develop themselves, the industry must be transformed and upgraded (Moore, 2014; Steinbergs & Cane, 2021). In China, in recent years, Chinese cultural and creative workers have constantly stimulated the enthusiasm of cultural and creative industries in the new era. Through the development, creation and promotion of cultural resources, the national cultural and creative industry development has shown good momentum and unique advantages (Liang & Wang, 2020). However, there are still some problems, such as low legislative level, low technical content, low degree of marketization, lack of professional talents, and insufficient financing channels (Bai, 2021; White & Xu, 2012). Future cultural and creative industries also need further regional planning, openness, carbon emissions and energy conservation (Yang & Zhuo, 2019).
The essence of upgrading the culture and creative industry is cultural innovation (C. Xu et al., 2021). In the current research on innovation efficiency, the author generally chooses to analyze the data of innovation activities in various provinces and cities. Qiao and Wang (2017) proposed the three-stage DEA method and DEA-Windows method, which takes environmental factors as input and output variables directly into the classic DEA and measures DMU efficiency values. They described the development law of provincial innovation efficiency from two dimensions of spatial variation and temporal evolution. According to the data of high-tech development zones, M. Liu and Li (2016) used the three-stage DEA model to empirically analyze their innovation efficiency. The results showed that environmental factors seriously restricted the innovation efficiency of high-tech development zones. Cao and Yu (2015) built a more effective measurement model to estimate innovation efficiency from the perspective of green low carbon, and are committed to effectively promoting green technology innovation and improving China’s current ecological environment. In order to enhance the innovation efficiency of the pharmaceutical industry, L. Xu et al. (2020) took economic development, policy support, industrial foundation and innovation foundation as environmental indicators, analyzed the input-output problem of the industry, and gave corresponding suggestions. Fukuyama and Tan (2022) proposes a new three-stage network DEA model to estimate three different types of efficiencies.
Research on supply chain efficiency generally builds models and uses many different methods. Assumpção et al. (2022) put forward the correlation hypothesis on the functional performance of green supply chain management. Then, a model of structural equations was performed using the PLS approach, Kaiser criterion and Bootstrap method were used to test the data. Y. Liu et al. (2022) used the moderated-mediation model to determine the impact of supply chain planning on innovation performance, and finally used regression analysis to test the model. Using statistical and DEA methods, Lu et al. (2019) examined the perception gap of service supply chain partners on the relative importance of key performance indicators and their relationship with service performance. George and Elrashid (2023) used a structural equation model to analyze the benefits of the drug supply chain. It aims to investigate the role of inventory level control and demand forecasting on the PSC performance of hospital pharmacies. Patel and Tsionas (2022) meld the social network literature with literature on organizational culture to propose a framework of cultural interconnectedness among supply chain members, by using the machine learning approach.
For the cultural and creative supply chain, the supply chain has been initially formed, but there still a considerable gap from the system’s maturity. Through the combing of relevant literature, it is found that there have been many studies on the cultural and creative industry in recent years, and there are also many research results on the development status and trend of the industrial supply chain, but they generally focus on the elaboration of major theoretical issues (Windrum, 2018). Most studies are written based on normative theoretical analysis and indicator comparison. Empirical research is limited, and there is room for further specific research promoting industrial development. The proposed countermeasures are closer to the top-level design, and the lack the application close to the industry development level. There are few articles from the perspective of low-carbon development (Han et al., 2018; Lita et al., 2018). In terms of efficiency research methods, at present, SFA and DEA methods are mainly used by scholars in the study of industrial efficiency. For the case of multi-input and multi-output, the DEA method is more effective than SFA. When the real effective production “frontier” is found, the DEA method can really play its superiority. Using the three-stage DEA model to carry out empirical analysis can not only obtain more accurate efficiency results than the traditional DEA method, but also further understand the advantages and disadvantages of the current cultural industry innovation and development, so as to provide a scientific basis for the formulation of industrial innovation efficiency improvement policies. Accordingly, this study divides 30 provinces (municipalities and autonomous regions) in mainland China into four regions (northeast, eastern, midland, and western) based on consulting the relevant literature. Using the three-stage DEA model, it discusses the change law of cultural and creative supply chain efficiency in different regions of China, which under the constraint of removing external environmental factors and random factors, so as to provide decision-making reference for improving industrial innovation ability, and promoting high-quality and comprehensive development. The current trends are in Table 1.
Research Gaps and Contributions of Previous Author(s).
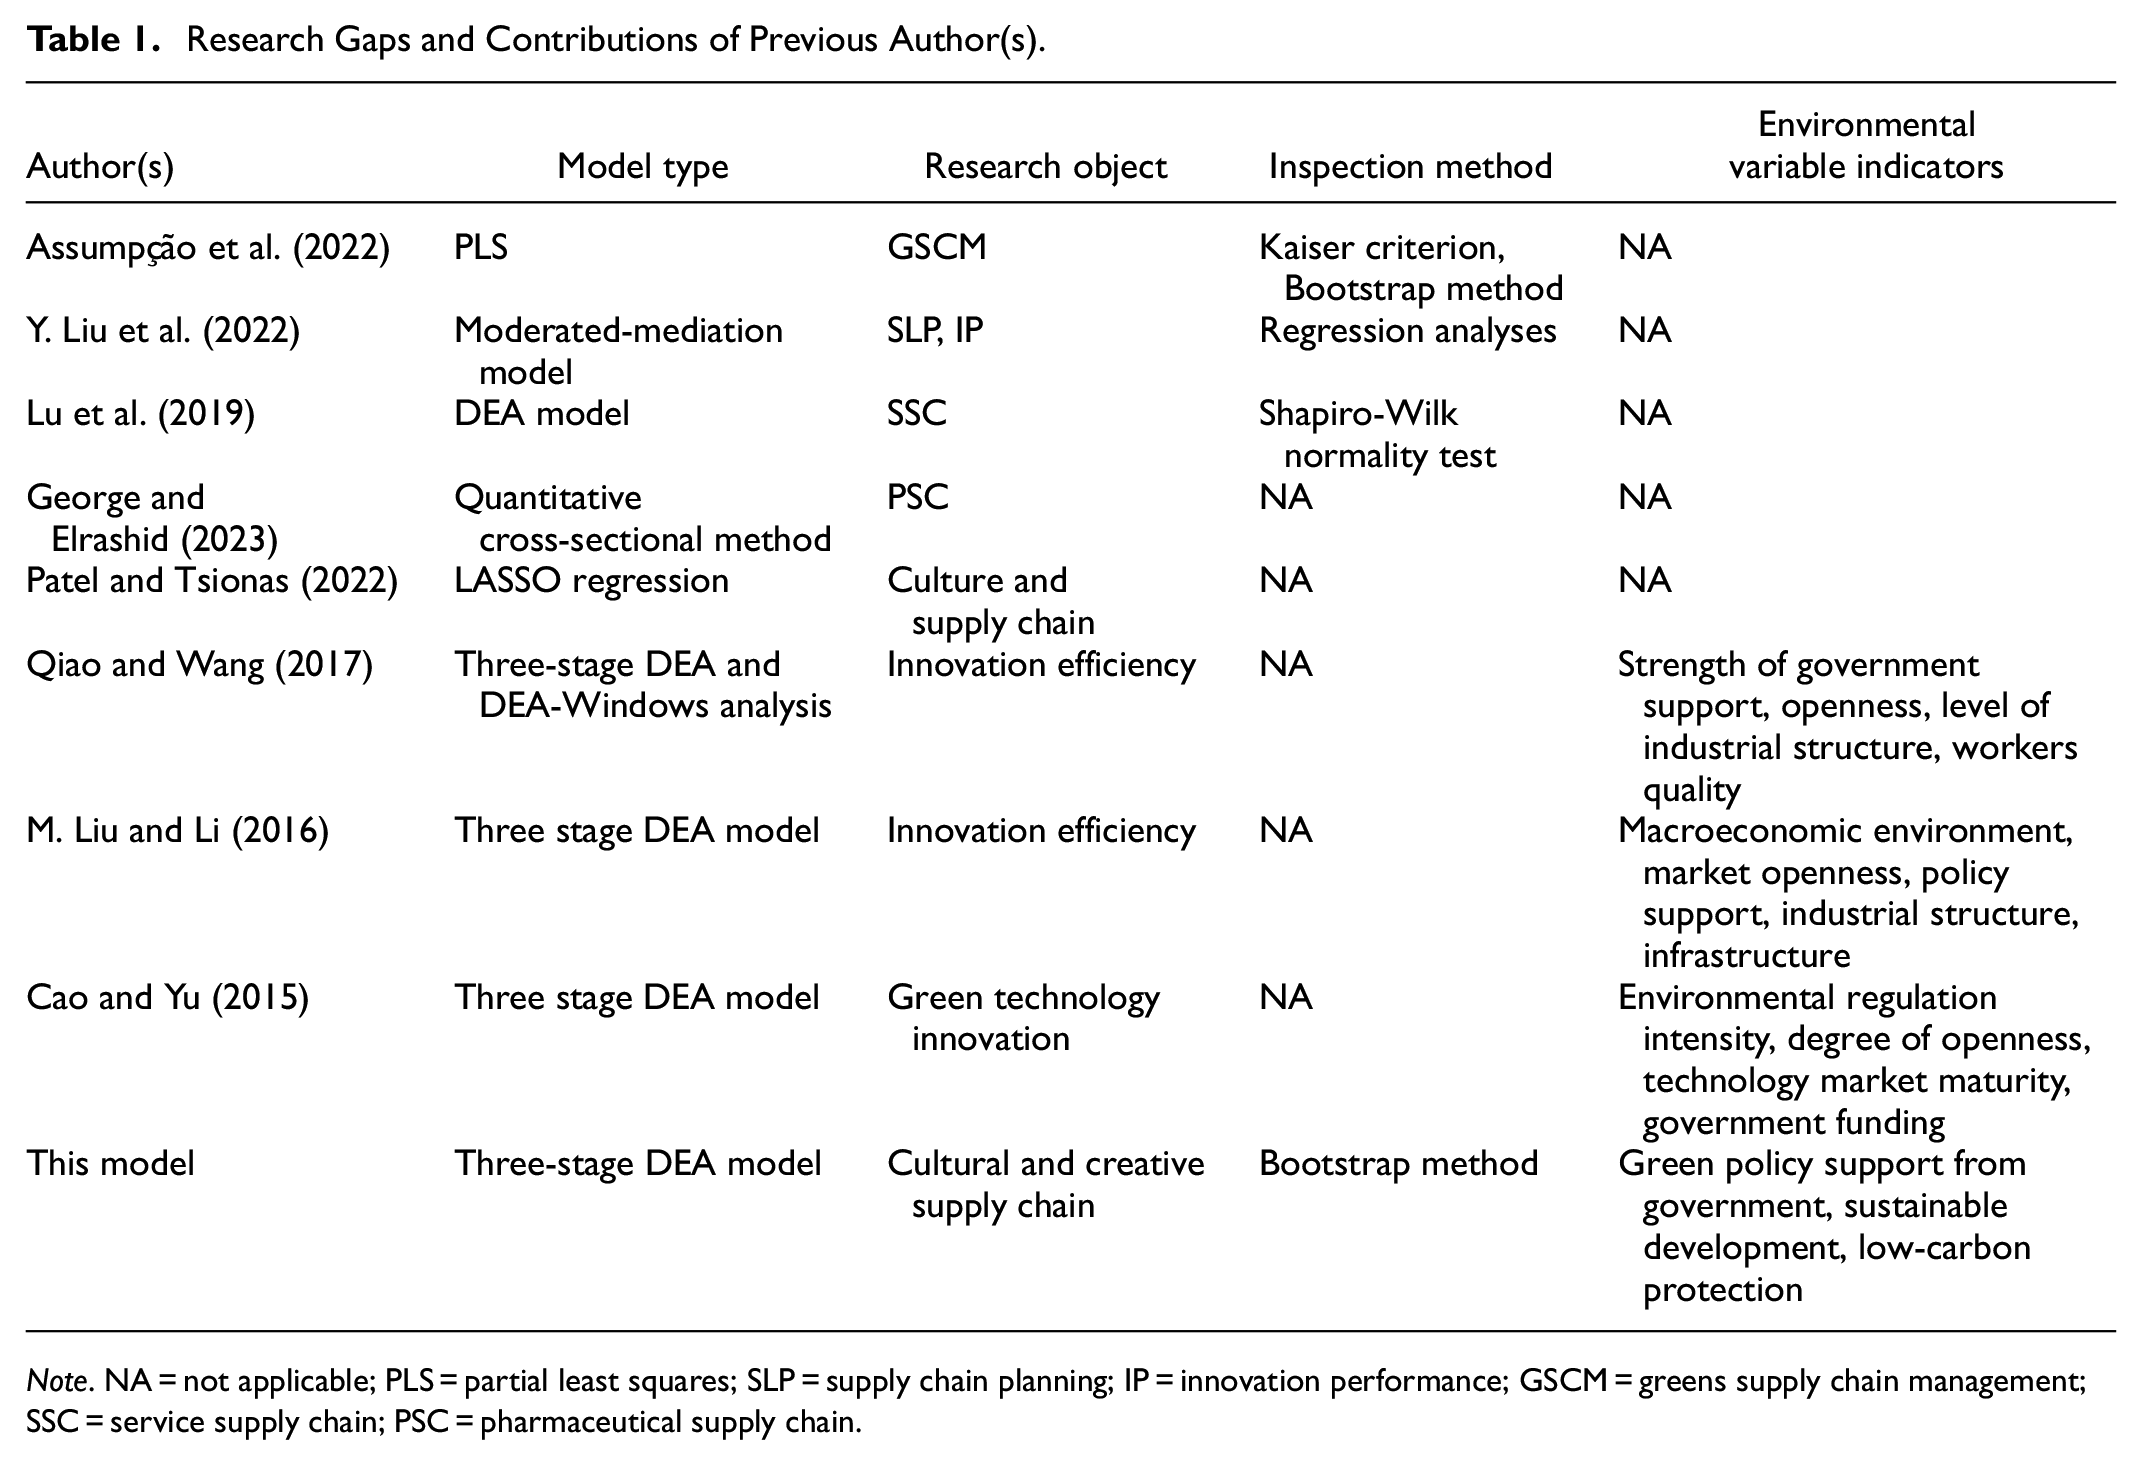
Note. NA = not applicable; PLS = partial least squares; SLP = supply chain planning; IP = innovation performance; GSCM = greens supply chain management; SSC = service supply chain; PSC = pharmaceutical supply chain.
Mechanisms of Influence
Before constructing the model, input and output indicators should to be processed. If the index is positive, there is no need to correct the data; if the index is an inverse index, the index needs to be changed to a positive index by the data conversion function processing method. Therefore, it is necessary to first determine the type of index. Thus, the first hypothesis is:
Development efficiency includes the judgment of development status and future trends. Although the development level represents the current situation, it can lay a good foundation for the further industry development, and accelerate the future industrial layout. Thus, the second hypothesis is:
There is always a gap between theoretical and practical problems, and considering too many secondary elements can make model building more difficult. The presence of these two hypotheses facilitates the simplification of the model and reflects the essential issues of the model. The hypotheses could be inllstrated in Figure 1

The theoretical hypothesis.
Research Methods
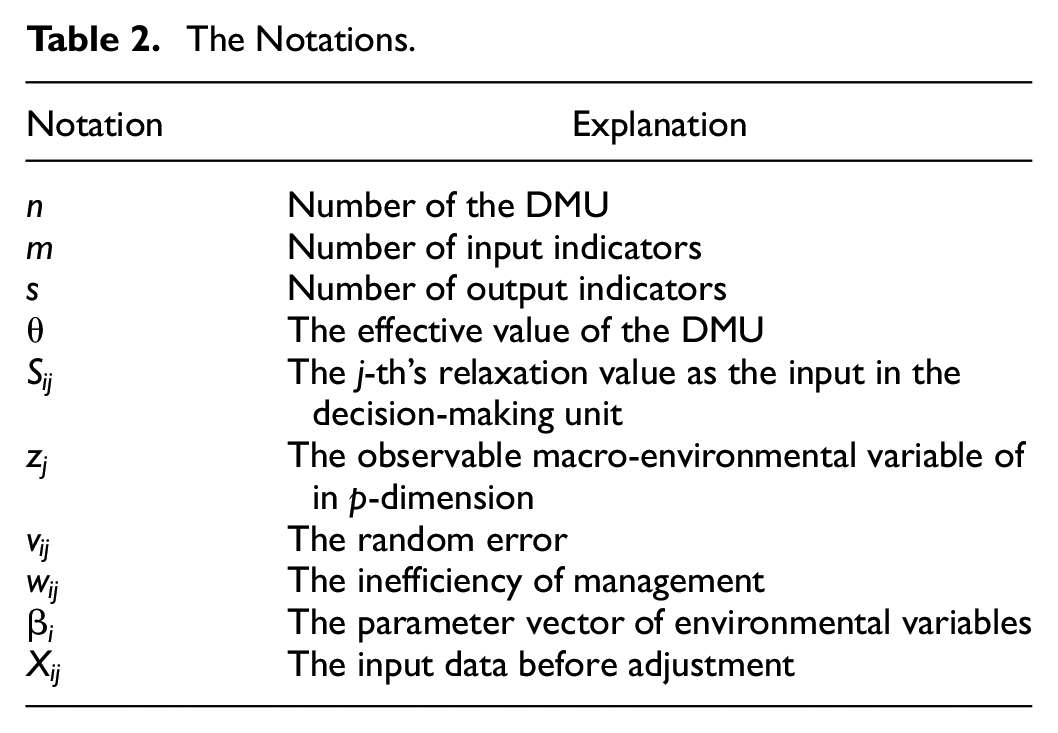
The DEA model was first proposed by Charnes et al. (1978), and it is used to evaluate the efficiency of multi-input and multi-output decision making units (DMU). After a series of evolutions, in order to further push the data intuitive and accurate, Fried et al. (2002) revised the three-stage DEA model based on the traditional DEA method, considering the influence of the external environment and random error on the efficiency value, so that the measured efficiency value is only affected by the management inefficiency. Table 2 shows the notations used to review the theories and construct our model. Specifically, the operation of the three-stage DEA model is as follows.
The Notations.
Stage 1: Traditional DEA Efficiency Analysis
In this stage, the BCC model with variable returns to scale is selected to calculate and analyze the efficiency value of decision-making units. On the basis of the CCR model, the technical efficiency (


where
Phase 2: SFA Data Adjustment
In order to further make the data in the selected variables intuitive and accurate, the influence of environmental factors and random factors on the calculation results is removed in this stage. The decision-making unit in the first stage is taken as the dependent variable, and the environmental factors and random factors are taken as explanatory variables. The stochastic frontier analysis (SFA) model is used to remove the influence of external environmental factors and stochastic factors on efficiency measurement. Formula is as follows:

Where
Then, the stochastic error term should be separated from the mixed error term. Formula is as follows:


The SFA regression is used to adjust all decision-making units to the same external environment. Formula is as follows:

N is the adjusted input,
Stage 3: DEA Efficiency Analysis After Adjustment
The adjusted input data
Indicator Selection and Data Description
Selection of Indicators
According to existing research theory and empirical methods, this paper analysis the calculation results of cultural and creative industry efficiency in the supply chain. The efficiency evaluation model is constructed from the two levels of input and output indicators. At the same time, the environmental factors that may affect the industry efficiency are proposed and applied to the SFA analysis of the second stage (Table 3).
Operation Efficiency Index.

Input Indicators
Through the research of relevant literature, combined with the availability and operability of index data, using the three-stage DEA model to evaluate the cultural innovation efficiency, the input index refers to the traditional macroeconomic theory, and the input variables of innovation efficiency include two dimensions: The first is basic input. Y. Liu and Wu (2018) proposed STR Model, and the number of unit outlets of cultural enterprises is used as the main index of the industrial supply chain to reflect the query serviceability of cultural enterprises. The second is labor input. According to Qu and Wang’s (2017) clause, employee number as labor input indicators to indicate human input.
Output Indicators
The direct output of innovation activities is mainly reflected in the number of patent applications and authorizations. The realization result of the production side in the cultural and creative supply chain is cultural and creative products. Therefore, this paper selects the number of creative design patents to reflect the cultural and creative industry innovation efficiency. At the same time, the economic and material output of the industry are related to the innovation activities of the industry. Leung (2019) put forward that the creative end is the key to the success of cultural and creative products, which will directly affect the economic benefits and cultural increment. Therefore, this paper chooses the operating income of the cultural service industry and the sales income of publications to represent the economic output of the cultural service industry, cultural publishing and distribution manufacturing industry, respectively.
Selection of Environmental Variable Indicators
Taking into account the factors that have a significant impact on the cultural industry efficiency, this paper proposes three environmental factors: green policy support from government, sustainable development and low-carbon protection. ① Green policy support from government. The policy support can speed up the pace of industrial structure adjustment, enhance the ability to guarantee the safety and progress of the industry, and measure the green government support by the proportion of funds supporting innovation activities in the internal funds expenditure. ② Sustainable development. Through empirical analysis, Li et al. (2019) believe that the degree of service openness and market openness can effectively improve industrial competitiveness and sustainable development ability. Therefore, this paper uses the proportion of total import and export in GDP as an indicator of sustainable development. ③ Low-carbon protection. “Circular on carrying out the pilot of supply chain innovation and application” proposes that the government should focus on building a green supply chain to guide enterprises to practice the green development concept. Only low-carbon economic development can help solve the contradiction between economic development and environmental protection (Agyabeng-Mensah et al., 2022; Dey, Yilmaz, & Seok, 2022; Dey, Park, & Seok, 2022). Based on the idea of sustainable development, low-carbon economy refers to reducing the consumption of high-carbon energy such as coal and oil as much as possible. This paper takes energy consumption as the influencing factor of the cultural and creative industry (Zhou et al., 2022). To a certain extent, it can reflect the development trend of the green economy. The innovative science is also the driving effect on the high-quality development of the industry (Zhou, Zhang, & Fei, 2024). The energy consumption is an undesirable output, and the construction rules of the DEA model reflect that the input and output indicators conform to the “isotropic” principle, and the input and output values of each decision-making unit must be positive. The linear data conversion function is used to transform it into the expected positive output.
Data Description
The data of this paper mainly comes from the “China Statistical Yearbook,”“China Culture and Related Industries Statistical Yearbook,”“China Science and Technology Statistical Yearbook,” and “China Energy Statistical Yearbook,” not including Tibet Autonomous Region, Hong Kong, Macao and Taiwan. This study selects the panel data of 30 provinces (municipalities and autonomous regions) from 2013 to 2019 as observation samples, and uses Frontier4.1 and DEAP2.1 software to calculate.
Since the different measurement units of indicators can greatly affect the analysis results, this paper uses the data conversion function processing method proposed by Seiford and Zhu (2002), which transforms the reverse indicator data of energy consumption. The specific formula is
Observation Table 4, cultural industry input and output data were significantly positively correlated (**p < .01), and the correlation coefficient is larger. At the same time, according to the descriptive analysis in Table 5, the difference between the minimum value and the maximum value in each variable is extremely unbalanced. Among them, the largest variable is the number of cultural enterprises per unit network index, the standard deviation is 4.89. The maximum value is Guangdong in 2019 (58371.00), the minimum value is Qinghai in 2015 (19.00), the difference between the two is about 3,072 times. Similarly, the difference between the maximum and minimum variables is more than eight times. Therefore, it is effective to use this sample data for efficiency measurement analysis.
Pearson Correlation Analysis Results.

Note.**p < .01.
Descriptive Analysis.

Efficiency Analysis of Cultural and Creative Industries
The First Stage DEA Analysis
In this study, DEAP2.1 software is used to analyze the cultural industry data of 31 provinces (municipalities and autonomous regions) from 2013 to 2019, and the results are shown in Figure 2.

Efficiency value of the first stage of cultural and creative industry in each province.
From the national level, under the premise of environmental factors and random factors, the number of provinces and cities that have reached the frontier of technological effectiveness at the national level fluctuates year by year between 4 and 9, from four changes in 2013 to five in 2019, of which the number is the largest in 2016. At the same time, the comprehensive technical efficiency of the industry is reduced from 0.72 to 0.63. The overall average comprehensive technical efficiency level in the western, northeast and midland shows a fluctuating downward trend, which is consistent with the fluctuation trend of the national average comprehensive technical efficiency. Among them, the pure technical efficiency of the cultural industry market in various provinces and cities is generally general, and the scale efficiency value is generally maintained between 0.70 and 1.00. The scale efficiency level of the whole country and the four regions is higher than that of the pure technical efficiency level of the region, and the difference is significant, which shows that the main reason for restricting the cultural industry efficiency in the various regions is pure technical efficiency, and scale efficiency is an essential factor to promote the improvement of comprehensive technical efficiency. However, due to the result does not remove the impact of environmental factors and random factors, it cannot truly reflect the actual industrial efficiency status of each province. It needs to be further calculated and analyzed after the relaxation variable data adjustment in the second stage.
The Second Stage SFA Regression Analysis
In the second stage of DEA analysis, the SFA method is used to decompose the influence of environmental factors, random errors and management inefficiency on the cultural and creative industry efficiency, adjust the original input slack variables of provinces and cities, and finally obtain the industrial performance level under the same management environment. The slack variables of the number of cultural enterprises unit outlets and employee number measured in the first stage are used as explained variables in the regression function, green policy support from government, sustainable development, and low-carbon protection are used as explanatory variables in the regression function to examine the impact of three environmental variables on the two input slack variables. Using Frontier 4.1 software, the second stage SFA regression results can be got, as shown in Table 6.
Estimation of SFA Parameters for External Environmental Variables.

Note.***Indicates a significance level of 1%, **indicates a significance level of 5%, and *indicates a significance level of 10%.
It can be seen from Table 6 that some results show different degrees of significant aboriginality, external environmental factors and random factors have significant aboriginal effects on input slack variables in different provinces. This also indicates that it is necessary to adjust the input slack variables, so as to effectively strip the influence of external environmental factors and random factors. When investigating the impact of environmental variables on input slack variables, if the output coefficient is positive, the increase of the three selected environmental variables will lead to input growth or output reduction, which will adversely affect the cultural and creative supply chain efficiency. If the output coefficient is negative, the increase in the value of the three selected environmental variables will lead to reduced input or increased output, which will have a favorable impact on the cultural and creative supply chain efficiency. This article examines the three environmental variables of green government support, sustainable development and low-carbon protection, and analyze their impacts on input slack variables.
Green policy support from government. The regression results show that the regression results of government green support on the slack variables of the number of cultural enterprises unit outlets and employee number in cultural enterprises are all positive. The impact of green government support on the number of cultural enterprises unit outlets is not significant, but the operation results of employees in cultural enterprises show that it passes the 1% significant test level, which also shows that the greater the government’s financial support for cultural enterprises is, the greater employee number in cultural enterprises will be. It also means that human resources are not being fully utilized, which will have a negative impact on environmental efficiency.
Sustainable development. The regression results show that the influence of opening to the outside world on the number of unit outlets of cultural enterprises is negative, that is, the increase of the environmental index value will reduce the number of unit outlets or employees, or increase the output variable, which has a favorable impact on the development environment of the cultural and creative supply chain. At the same time, the results show that the regression coefficient of opening to the outside world for the personnel index of cultural enterprises is obvious at the level of 1%, while the number of units of cultural enterprises is opposite.
Low carbon protection. The calculation results show that the regression results of energy consumption on the input slack variables of cultural enterprises unit outlets number and the employee number are both negative, and are significantly indigenous at 10% and 1%, respectively. It shows that the increase in energy consumption, to a certain extent, will reduce the number of units of energy enterprises, resulting in savings in network resources and human resources.
In summary, the green policy support from government indicator will have a negative impact on the efficiency of the cultural and creative supply chain, while the sustainable development indicator and low carbon protection indicator will have a positive impact on the efficiency of the cultural and creative supply chain.
DEA Analysis After Adjusting in the Third Stage
In the third stage, the adjusted input variables are recalculated in the first stage, and the chain performance value of the cultural and creative industry, excluding environmental factors and random errors, is obtained in the performance evaluation. At this stage, with the help of software DEAP2.1, the adjusted input data and the original output data are substituted into the BCC model again, and the efficiency level that is different from the value before adjustment is calculated. The specific results are shown in Figure 3.

Efficiency value of the third stage of cultural and creative industry in each province.
By comparing the results of the first and third stages of DEA, it can be found that after removing the influence of the external environment and random factors, the efficiency values of different provinces and cities have significantly changed. The output performance of the integrated cultural and creative supply chain after adjustment is significantly lower than that before adjustment, and the overall efficiency trend is fluctuating year by year. Before the adjustment, the provinces have roughly the same trend of combined and pure technical efficiency, with the highest scale efficiency values, mostly fluctuating between 0.7 and 1.0. However, after the adjustment of the regression formula, the variation trend of comprehensive efficiency and scale efficiency in each province of the country is consistent and the value is similar. The average pure technical efficiency of the adjusted country is significantly higher than the average scale efficiency. Compared with the efficiency value before adjustment, the pure technical efficiency on the whole is dramatically improved, while the scale efficiency value is significantly decreased. It can be seen that after excluding the influence of environmental factors and random factors, the development of comprehensive efficiency level is hindered under the influence of insufficient scale efficiency level, which means that the industrial efficiency improvement is mainly restricted by the low scale efficiency level.
Comparing the regional cultural and creative industry efficiency in the first stage and the third stage of 2013, it can be seen that the efficiency value of most provinces has decreased, as shown in Figure 4. The figure of other years is similar to that of this year. By calculation, the efficiency of the cultural and creative supply chain declined by more than 10% in 16 provinces and by more than 40% in 9 provinces. There are six provinces of cultural and creative supply chain efficiency increased by more than 10%. Only Shandong Province, the efficiency of this province increased by more than 40%, indicating that the impact of environmental factors and random interference on Shandong Province is negative. Environmental factors and random interference have little influence on Shanghai, Jiangsu and Hunan, but have great influence on provinces in northwest and southwest of China, such as Qinghai, Ningxia, Xinjiang and Hainan. The real cultural and creative efficiency of these regions is covered up.

Regional efficiency comparison charts for the first and third phases in 2013.
From the perspective of the technical effective frontier, the number of provinces and cities with comprehensive technical effectiveness decreased to four to six provinces after the adjustment. The number of cities at the technical effective frontier decreased significantly. Among them, 2018 was the year with the largest number of provinces and cities, and then decreased to 5.
From the perspective of scale income before and after adjustment, most provinces are in the ranks of increasing returns to scale, and very few are in the ranks of constant or decreasing returns to scale. Until 2019, all provinces except Jiangsu Province are in the ranks of increasing returns to scale, or comprehensive technology has reached the optimal state. For provinces in the state of increasing returns to scale, the values in all years are more than those before adjustment, and the number changes significantly. For provinces with diminishing returns to scale, all years are less than the number before adjustment, and the number changes significantly. This also means that external environmental factors are the key factors restricting the expansion of the scale. Expanding the scale of factor input can still be a powerful measure to improve the efficiency of most provinces (Table 7).
Comparison of Effect Levels Before and After Data Adjustment.

Comparative Analysis of Regional Efficiency Based on Bootstrap Method
Based on the Bootstrap method, this paper uses SPSS22.0 software to calculate the average value and confidence interval of cultural and creative supply chain efficiency in different regions of China before and after investment adjustment. It helps to verify the robustness of the evaluation results and further improve the reliability of efficiency calculation. The descriptive statistical options in SPSS22.0 software are selected to divide the four regions. Set the factor variable without considering the time change, and set the Bootstrap number B to 1,000. It can be seen from Tables 8 to 10 that the pure technical efficiency of the cultural and creative industry has increased significantly after the data adjustment. In contrast, the comprehensive efficiency and scale efficiency have decreased significantly. The changes in various economic regions are as follows:
Comparison of Mean Value and Confidence Interval of Comprehensive Technical Efficiency in Economic Regions Before and After Input Adjustment.

Comparison of Mean and Confidence Intervals of Pure Technical Efficiency in Economic Regions Before and After Input Adjustment.

Comparison of Mean Scale Efficiency and Confidence Interval of Economic Regions Before and After Input Adjustment.

Northeast: After removing external environmental factors and random factors, the average comprehensive technical efficiency in Northeast China decreased from 0.59 to 0.37, the average pure technical efficiency increased from 0.65 to 1.00, and the average scale efficiency decreased from 0.90 to 0.37. The results show that the average level of pure technical efficiency in Northeast China is underestimated. In contrast, its scale efficiency and regional average comprehensive technical efficiency are overestimated. At the same time, it is observed that the influence of related environmental variables on the cultural and creative industry efficiency in the northeast is mainly reflected in the change of pure technical efficiency.
Eastern: After adjustment of input slack variables, the average value of comprehensive technical efficiency decreased slightly from 0.81 to 0.78, pure technical efficiency increased from 0.89 to 1.00, and the scale efficiency decreased from 0.90 to 0.78. The variation trend of each efficiency after adjustment is consistent with the northeast. The critical point of the influence of external environmental variables on the cultural and creative industry is pure technical efficiency.
Midland: Compared with the average efficiency changes in the eastern and northeast, the changes in the central region are slightly different. After data adjustment, the average comprehensive efficiency of the central region increased from 0.78 to 0.94, the pure technical efficiency increased from 0.82 to 1.00, and the scale efficiency increased from 0.96 to 1.00. The pure technical efficiency and scale efficiency are underestimated due to external environmental factors and random factors. Then the regional average comprehensive technical efficiency is underestimated.
Western: After excluding environmental and random factors, the average comprehensive technical efficiency of the western region decreased from 0.61 to 0.42, the pure technical efficiency increased from 0.76 to 1.00, and the scale efficiency decreased from 0.82 to 0.42. Therefore, it is concluded that the influence of external environmental variables on the change of industrial efficiency in the western region is mainly realized through pure technical efficiency.
From the national perspective, after removing environmental factors and random factors, the national average comprehensive technical efficiency has decreased significantly from 0.71 to 0.62. The external environmental factors adjust the development level of cultural and creative industries by influencing the pure technical efficiency value.
In summary, the impact of external environmental variables on industrial performance in China’s regions is mainly achieved through regional pure technical efficiency, and the effect is remarkable.
Conclusions and Policy Suggestions
Conclusion
In order to solve the dilemma between internal indicators and environmental factors, and overcome the shortcoming of less accuracy with traditional methods, a new DEA method based on three stages was proposed. It consists of the traditional DEA model and SFA model, with the additional support of the Bootstrap method. This paper uses the three-stage DEA model and linear data conversion function to conduct an empirical study on the development of cultural and creative supply chain in 30 provinces (municipalities and autonomous regions) from 2013 to 2019, indicates that the presented algorithm is of high accuracy, also generates more diverse results. Finally, the study obtains the following conclusions.
After removing external and random factors, the cultural and creative supply chain efficiency in various regions of China has changed significantly. After adjusting the input slack variable, the national average pure technical efficiency is much higher than the scale efficiency value. The comprehensive technical efficiency and scale efficiency tend to be consistent in the development level and trend. The pure technical efficiency of the whole country, northeast, eastern, midland and western is underestimated to varying degrees. In contrast, the scale efficiency is significantly overestimated in the national, northeast, eastern and western regions except for the midland, which explains the overestimation of the average comprehensive technical efficiency of each region. Therefore, the change in comprehensive efficiency of the cultural and creative supply chain is mainly due to external environmental factors and random factors, and it is affected by pure technical efficiency. The existence of environmental factors and random factors will affect the measurement of real efficiency. Therefore, it is necessary to use the three-stage DEA model to measure the efficiency of the cultural and creative supply chain.
The real efficiency of regional cultural and creative industries exists in spatial imbalance. The efficiency measurement results after data adjustment show that the development efficiency of the eastern and midland of China is high, and the data each year are higher than 0.70, while the development efficiency of the northeast and western is low, and the data in each year are lower than 0.50. The results of the first-stage DEA analysis describe that the operational efficiency of China’s cultural and creative industry shows a decreasing trend from the eastern coastal areas to the western inland areas. After correcting the environmental and random factors, there is no significant change in the operational efficiency differences between various regions. However, the comprehensive efficiency of the midland ranks first than that of the eastern region, and the difference in industrial efficiency between the midland, western region, and northeastern region further increases. The efficiency value is in the order of “midland > eastern > northeast > western.” At the same time, under the influence of environmental and random factors, the scale income of each province changes obviously. Most provinces are in the ranks of increasing returns to scale, and few are in the ranks of constant or decreasing returns to scale. Before the adjustment, the total number of provinces and cities with comprehensive technical effectiveness is 6 to 11 provinces. And after the adjustment, the total number of provinces and cities with comprehensive technical effectiveness are four to six provinces. The number of cities at the frontier of technical effectiveness decreased significantly.
Environmental factors and random error factors have a significant impact on the efficiency of the cultural and creative supply chain. The green policy support from the government will have a negative impact on the number of outlets and employees of cultural enterprises. Sustainable development and low-carbon protection will have a positive impact on the two input slack variables, indicating that the increase in energy consumption and the import or export ratio will reduce the input variables of the number of enterprises outlets to a certain extent, resulting in the savings of network resources and human resources. Overall, the green policy support from government indicator will reduce the efficiency of the cultural and creative supply chain, while the development of sustainable development indicator and low carbon protection indicator will improve the efficiency of the cultural and creative supply chain. Therefore, the government can strengthen the efforts of sustainable development and low carbon protection.
The article needs further research. Sustainable development is the future direction of the industry’s upgrading and it is very interesting to study the relevant content (Gerner, 2019). Although the method currently applied is able to evaluate the industry efficiency, the measures proposed are only in the direction of scale effects and pure technical efficiency, and cannot propose more specific measures based on the calculation results. In addition, the sample collected in the article is limited to various provinces in China, and the sample size is small. It does not extend to other countries as well as specific city and county data, which will lead to less accurate results obtained in the end. The environmental factors affecting the supply chain of the cultural and creative industries are not only those mentioned in the article, but also factors such as national culture (Dragojlovic, 2012). Further development of this research will concern a second level analysis aimed at exploring the future development of the cultural and creative supply chain. This second level analysis should take in account that expanding the method to diversify its research dimensions.
Policy Suggestions
The emergence of cultural and creative supply chain provides a broader space for the cultural and creative products development, and forms a complete closed loop of cultural and creative product ecology. Under the background of the diversified development of the creative industry, the operation supply chain efficiency is gaining more and more attention. Based on the above discussions, this paper put forward the following suggestions for improvement in efficiency.
Regional development diversification. The cultural and creative supply chain efficiency in China has the characteristics of regional heterogeneity. After the adjustment of input slack variables, the pure technical efficiency of each region is underestimated to varying degrees, and the scale efficiency of each region except the central region is significantly overestimated. It also confirms that the northeast and western have greatly improved under the influence of the external environment, which should make full use of the role of the external environment, actively expand opening up, improve green government support and cultivate the awareness of low-carbon supply chain in each region. Governments can guide social capital to invest in cultural enterprises in various forms, strengthen the scale investment of cultural and creative industries, support the development of “specialized, refined, special and new” small and medium-sized cultural enterprises, and optimize resource allocation efficiency. Due to the relatively weak pure technical efficiency, the northeast and midland should actively improve their independent the innovation ability, promote the transformation of cultural industry parks from factor agglomeration space to innovation development platform, introduce advanced equipment and production technology, deeply apply scientific and technological achievements, such as 5G, blockchain, big data, and cloud computing. Then it can concentrate advantageous resources to extend the cultural industry chain. In addition, the cooperation between regions is also an important factor in encouraging the development of cultural and creative industries, promoting the integration and development of large, medium and small enterprises between regions, and actively promoting the development alliance of cultural and creative industrial parks, “Guangdong-Hong Kong-Macao Cultural Information Network,” cultural industry fairs and other related regional activities nationwide.
Reasonable expansion of market size. The improvement of industrial efficiency is mainly restricted by the low scale efficiency, expanding the scale of the cultural and creative supply chain and better releasing the potential of cultural and creative industry. The industry should rationally use the green government investment fund for the cultural industry, strengthen products construction and factor markets, transform the advantages of cultural resources into industrial and market advantages, and continuously promote the optimization of supply and demand structures of processes. The expansion of scale should follow certain criteria: for the provinces and cities with increasing returns to scale, including most provinces and cities in China. In this way, the government can take the path of expanding the scale of factor input to improve their industrial efficiency, build the interconnection platform of digital technology and cultural industry, strengthen the deep integration of cultural industry and digital technology. What’s more, using industrial interconnection to realize the resources optimization and integration. It promotes the transformation of supply chain management from the traditional induction-response mode to prediction-implementation mode, and provide more optimized decision-making basis for the overall industrial development strategy. For regions with diminishing returns to scale, such as Jiangsu Province, optimizing resource allocation is an effective method. With the help of the Silk Road Economic Belt and the 21st-Century Maritime Silk Road, industry could accelerate the commercialization and industrialization of scientific and technological achievements, adjust the proportion of industrial structure, and improve the efficiency of resource utilization.
Making full use of the external environment. The industry should further enhance opening up and promote low-carbon development, promote the sustainable, stable and healthy development of the cultural and creative supply chain from the perspective of external favorable conditions. On the one hand, under the impact of the new coronavirus disease, the global supply chain is affected, and regions need to further promote sustainable development and the orderly connection of the supply chain. The key to cultural and creative products is creative added value. Actively respond to the government launched “Some measures on deepening the implementation of the opening-up drive strategy and accelerating the improvement of the level of Opening-up,” in-depth integration into the “the Silk Road Economic Belt and the 21st-Century Maritime Silk Road” construction. Relying on the free trade pilot areas, try to create a new competitive advantage in foreign trade. On the other hand, in order to further tap the development potential of the cultural and creative supply chain, promote the transformation and upgrading of traditional cultural industries with high-end, intelligent and green. Deepen the third-party evaluation of the development environment of small and medium-sized enterprises, make green become the label and symbol of enterprises to attract the positive emotions of the audience, and vigorously improve the aggregation and integration ability of cultural and creative supply chain. It focuses on supporting industrialization development projects integrating traditional art forms with modern scientific and technological means, supporting the creative design of handicrafts and its derivatives development projects, productive protection of intangible cultural heritage and creative design promotion projects, and promoting traditional crafts into modern life projects.
Footnotes
Acknowledgements
The authors of this manuscript acknowledge the enormous supports offered by Madam Hong WANG and Madam Manli ZHANG from Hangzhou Haicang Cloud Business Technology Co., LTD; Miss Anan ZHAO, who resides in Coquitlam, BC, Canada, who inspired the authors many magnificent implications.
Declaration of Conflicting Interests
The author(s) declared no potential conflicts of interest with respect to the research, authorship, and/or publication of this article.
Funding
The author(s) disclosed receipt of the following financial support for the research, authorship, and/or publication of this article: The author(s) disclosed receipt of the following financial support for the research, authorship, and/or publication of this article: This work was supported by the Zhejiang Province philosophy and social science project (24NDJC139YB); China Social Science Key Fund (23&ZD037); Special fund for basic research expenses of Zhejiang provincial university (XT202207); Zhejiang women association (202250); ZJGSU (1310XJ3119004-04, 1310KU222110); and China Scholarship Council under Grant 202009545007.
Ethics Statement
The authors claim that they have no conflict to interest.
Informed Consent
Informed consent was obtained from all individual participants involved in the study.
Data Availability Statement
The data are available from the corresponding author on reasonable request.