Abstract
There has been an increasing interest in research performance in recent years. However, in previous studies, research performance has generally been measured by traditional methods. In this study, a model based on multi-criteria decision-making (MCDM) methods is proposed to evaluate the research performance of universities. In order to apply the proposed model, the research performance of 88 universities was analyzed with MCDM methods. The research performance of universities was examined with six criteria in total in the dimensions of productivity and impact with the last 5 years of data from InCites Benchmarking and Analytics. First, the criteria were weighted by CRITIC, MEREC, and Entropy methods. Each of these criteria weights was analyzed separately with ARAS, MABAC, and TOPSIS methods and a total of nine different rankings were obtained. The different ranking values were combined using the Borda function and the final ranking of each university was determined. According to the results of the study, the most important productivity criterion in performance evaluation is “number of documents in Q1 per academic staff” and the most important impact criterion is “h-index excluding self-citations per academic staff.” In this study, 88 universities were ranked according to their research performance with the proposed model. Validation and sensitivity findings showed that the proposed model is a robust, consistent and stable methodology for measuring research performance. With the methods proposed in this research, the research performance of researchers, countries and academic units as well as universities can be analyzed.
Plain language summary
The research performance of universities is important for reasons such as financial constraints on universities, the benefits of prestige and reputation, performance-based grants, and the ability to attract students and academics. Therefore, there has been an increasing interest in research performance in recent years. However, in previous studies, research performance has generally been measured by traditional methods. In this study, a model based on multi-criteria decision-making (MCDM) methods is proposed to evaluate the research performance of universities. In order to apply the proposed model, the research performance of 88 universities was analyzed using MCDM methods. The research performance of universities was analyzed by using the proposed model with a total of six criteria in the dimensions of productivity and impact. First, the importance level of the criteria, that is, the weight values, were determined by three different MCDM methods. Using these criteria weights, universities were ranked according to their research performance by three different MCDM methods. In this study, 88 universities were ranked according to research performance with the proposed model. Validation and sensitivity findings showed that the proposed model is an objective and robust methodology for measuring research performance. With the methods proposed in this research, the research performance of researchers, countries and academic units as well as universities can be analyzed.
Introduction
Research performance is one of the issues examined in higher education institutions, universities, faculties, institutes and research centers. Many countries base a large proportion of research funding for higher education institutions on performance evaluation (Bazeley, 2010). As higher education institutions face financial constraints, the demand for productivity and accountability of academics and institutions has increased (Law & Chon, 2007). Government grants to institutions with high research performance have also increased (Geuna & Martin, 2003).
There are organizations such as THE, ARWU, and QS that measure and rank the performance of universities in various fields. Studies have shown that the results of these rankings attract prospective students to elite universities (Bowman & Bastedo, 2009), affect activities such as organizational mission, strategy, decision-making and recruitment (Hazelkorn, 2007, 2008), and affect the reputation and prestige of institutions (Bastedo & Bowman, 2010). A prestigious university has social and economic benefits for the country and its region (Fritsch & Slavtchev, 2007; Pressman et al., 1995).
For these reasons, universities and academics have started to spend their time on higher productivity (Law & Chon, 2007) and a strong motivation to improve the research performance of universities has emerged in recent years (Åkerlind, 2008). This motivation has led to a growing interest in examining the research output and hence performance of universities and academics (Abdul-Majeed et al., 2021; Barney et al., 2022; Preut et al., 2022).
This growing interest is reflected in studies on the performance of different units of universities and researchers. In the literature, there are studies on the performance of universities (Abdul-Majeed et al., 2021; Abramo et al., 2008, 2012; Maral, 2023, 2024a, 2024b, Maral & Çetin, 2024; Buela-Casal et al., 2009; Johnes & Yu, 2008; Kao & Pao, 2009), faculties (Dean et al., 2011; Ence et al., 2016; Holliday et al., 2014; Lowe & Gonzalez-Brambila, 2007), academic departments (Brocato & Mavis, 2005; Fox & Mohapatra, 2007; Khan et al., 2014, 2019; Law & Chon, 2007; Saxena et al., 2023), researchers (Abramo et al., 2020; Khan et al., 2019; Tanya et al., 2022).
When it comes to the research performance of universities, researchers working in this field are curious about the measures of research performance. When the research studies are examined, it is seen that research performance is generally examined in two different dimensions. The first one is productivity, which depends on the number of publications, and the other is impact, which reflects the quality of publications. As a measure of productivity, the number of publications (Bansal et al., 2023; Chang et al., 2020; Holliday et al., 2014), the number of publications per academic staff (Johnes & Yu, 2008), the h index (Lai et al., 2022; Praus, 2018; Sadeghi-Bazargani et al., 2019), the proportion of publications among the best publications (Craig et al., 2021), the number of publications in Scientific Journal Ranking (SJR) journals (Saxena et al., 2023), g index (Ke et al., 2016), the ratio of publications to total publications (Abramo et al., 2008), i10 index (Cvetanovich et al., 2016; Susarla et al., 2015). To determine publication impact, which is an indicator of the quality of publications, measures such as the number of citations (Aldieri et al., 2020; Sanmorino et al., 2022), the number of citations per publication, the h-index and g-index (Ding et al., 2020; Tahira et al., 2018), and the i10 index (Susarla et al., 2015) are frequently used. In addition to these measures, there are studies that consider research grants in the evaluation of research performance (Goldstein, 2011; Marisha et al., 2017; Valadkhani & Ville, 2010). Apart from these objective measurement methods, performance is also evaluated based on the opinions of researchers and academic administrators (Izuagbe, 2021; Law & Chon, 2007; Martin-Sardesai et al., 2017; Nguyen Quoc et al., 2021; Ryan, 2014).
One of the important issues in measuring research performance is the method by which the performance will be measured and analyzed. It is seen that descriptive statistical methods based on complete counts are generally used in research (Brocato & Mavis, 2005; Holliday et al., 2014; Khan et al., 2014; Saxena et al., 2023). However, other methods such as data envelopment analysis (Abramo et al., 2008; Hung & Chou, 2013; Johnes & Yu, 2008; Lee et al., 2012; Mutz et al., 2017), bibliometric method (Cardoso et al., 2020; Lee et al., 2012) have also been used.
These methods used to evaluate the research performance of universities have some limitations in measuring the research performance of universities. In addition, the use of multi-criteria decision making methods (MDCM) in the evaluation of research performance is important to overcome these limitations. First, research performance is a multidimensional and complex process that needs to be measured with more than one criterion. MCDM has the ability to evaluate more than one alternative by considering more than one criterion. Second, in previous methods, the performance criteria were assumed to be of equal importance. This is an assumption that causes bias in research results. The performance criteria of universities may not be of equal importance. In this case, the importance level of the criteria should be determined statistically. At this point, arbitrary weight assignments can be made. However, such an approach may reduce the reliability of the results. However, MCDM methods have the ability to weight performance criteria based on a certain statistical and theoretical background. Therefore, in this study, the weighting of the criteria was carried out using methods based on a statistical and theoretical background. Third, in previous studies, research performance has been evaluated based on a single method. Such an approach may cause concerns about the reliability of the results. The use of MCDM methods by integrating more than one method in a hybrid approach has the advantage to overcome this problem. In this research, more than one MCDM method was used to weight the research performance criteria and rank the universities. Such an approach is an effective method to utilize the advantages and reduce the limitations of MCDM methods with different theoretical backgrounds. In addition, the use of more than one MCDM method leads to more reliable results by increasing methodological diversity.
The aim of this study is to propose a new method by examining the research performance of universities with multi-criteria decision making (MCDM) methods. There is no research in the literature that measures the research performance of universities with multi-criteria decision making method. In this study, objective multi-criteria decision-making methods were used both in weighting the research performance measures and in creating the rankings. In addition, more than one MCDM method was used for both the weighting of performance measures and the ranking of universities. The main rationale for this is that each MCDM method has its own statistical background. Therefore, more than one MCDM method was used to ensure methodological richness and reduce bias. Another contribution of this research is to show that the criteria used to evaluate the research performance of academic units may have different levels of importance. This is because not all criteria used to measure the research performance of an academic unit may have the same importance.
As a result, this study seeks to answer two main questions:
What are the weights of research performance measures (criteria)?
What is the ranking of universities in terms of research performance?
Method
In this study, MCDM methods were used to evaluate the research performance of universities. MCDM emerged as a part of operations research, which is concerned with using computational and mathematical tools to help decision makers evaluate performance criteria (Zavadskas et al., 2014). MCDM methods are used to identify alternatives, categorize and group them into fewer categories, and rank alternatives. MCDM is a concept that encompasses all methods available to assist the decision maker in situations where there are multiple and conflicting criteria (Ho, 2008).
The method model used in the research is shown in Figure 1. In this research, firstly, the criteria for research performance were weighted by three different objective CRCDM methods: (1) Criteria Importance Through Intercriteria Correlation (CRITIC), (2) Method Based on the Removal Effects of Criteria (MEREC), (3) Entropy. Then, the weights of each alternative (university) were ranked with three different ranking methods. These methods are (1) Additive Ratio Assessment (ARAS), (2) Multi-Attributive Border Approximation Area Comparison (MABAC), (3) The Technique for Order of Preference by Similarity to Ideal Solution (TOPSIS). By including each weight value in the analysis with each of the ranking methods, nine different rankings of an alternative were obtained. These rankings were combined with the Borda Function to obtain a single ranking value for each alternative.

Research model.
CRITIC Method
The first method used for weighting the criteria is the CRITIC method. This method was developed by Diakoulaki et al. (1995) and is used for objective weighting of the criteria in a CRITIC problem. The CRITIC method uses the correlation coefficient between attributes to determine the relationship between attributes. The steps of the method are as follows (Alinezhad & Khalili, 2019):
Step 1: Normalization of the Decision Matrix
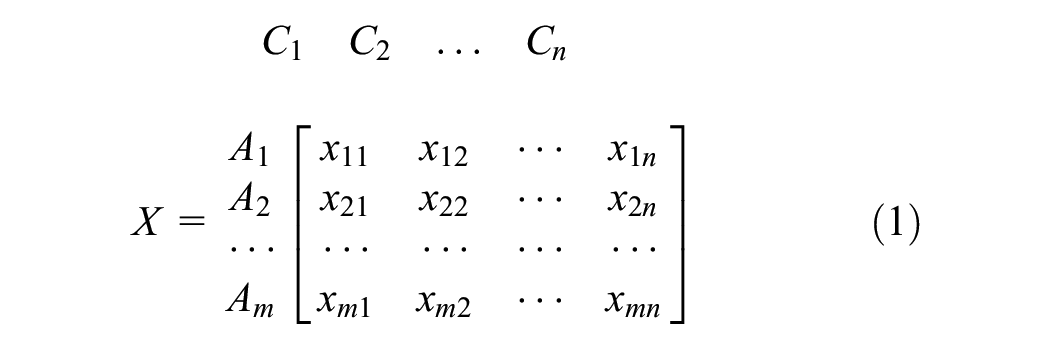
The decision matrix in the CRITIC method is as follows:
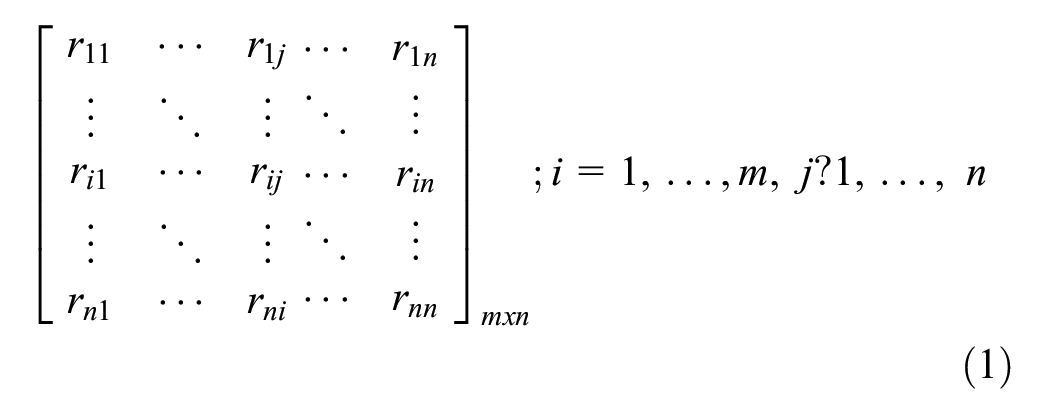
The following equations are used to normalize the positive and negative values of the decision matrix, respectively.

Where xij represents the normalized value of the decision matrix for the jth attribute of each ith alternative, ri+ = max (r1, r2, …, rm), and ri− = min (r1, r2, …, rm).
Step 2: Determination of Correlation Coefficient
The correlation coefficient between attributes is found with the help of the following equation:

where

Step 3: Determination of C Index
The standard deviation of each attribute is estimated by the first equation below. The C index is then calculated with the second equation.


Step 4: Determination of the Weight of Attributes
The weights of the attributes are calculated with the following equation:

Step 5: Determination of Final Weighting of Attributes
The weights of the attributes are obtained by sorting them in descending order.
MEREC Method
The second method used to weight the criteria is the MEREC method. This method is a method developed by Keshavarz-Ghorabaee et al. (2021), which is used for the objective weighting of the criteria in the MCDM problems. In this method, the removal effect of each criterion on the overall performance of the alternatives is used to determine the weights of the criteria. The MEREC method is based on the concept of causality. The following steps are used in the application of the MEREC method (Keshavarz-Ghorabaee et al., 2021):
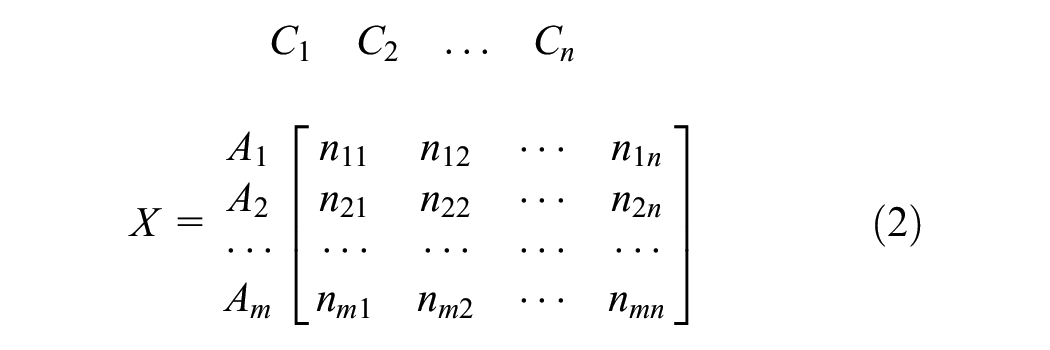
Step 1: Creating the Decision Matrix
A decision matrix is created that shows the rating of each alternative or the values for each criterion.

Step 2: Normalization of the Decision Matrix
A simple linear normalization is used to scale the elements of the decision matrix. The following equation is used for normalization.

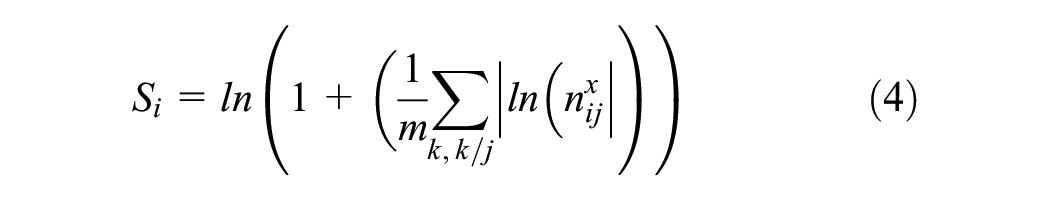
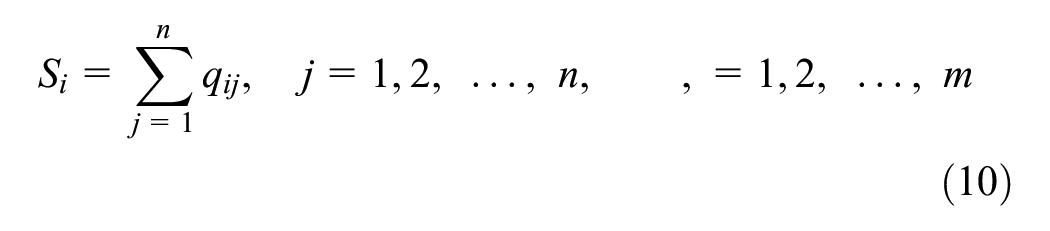
Step 3: Calculation of Overall Performance of Alternatives (Si)
A logarithmic measure with equal criteria weights is applied to calculate the overall performance of the alternatives. The following equation is used for this.

Step 4: Calculating the Performance of Alternatives
The performance of the alternatives is calculated by removing each criterion. The performance of the alternatives is calculated as follows:
Step 5: Calculating the Sum of Absolute Deviations
In this step, the removal effects of the jth criterion are calculated based on the values obtained in the third and fourth steps.

Step 6: Determination of the Final Weight of the Criteria
The objective weight of each criterion is calculated using the lifting effects from step 5. The value wj denotes the weight of the jth criterion.

Entropy Method
The concept of entropy was first introduced by the German physicist R. Clausius in 1865 and describes the complexity of a thermodynamic system. The entropy method uses the magnitude of the entropy value from information theory. It calculates the extent to which each evaluation attribute conveys decision information and reveals the relative weight between attributes. The entropy method uses the degree of difference of the criteria to calculate the information entropy of the criterion, to measure the effective information found and the criterion weight. The application steps of the entropy method are as follows (C. H. Chen, 2020):
Step 1: Normalization of the Decision Matrix
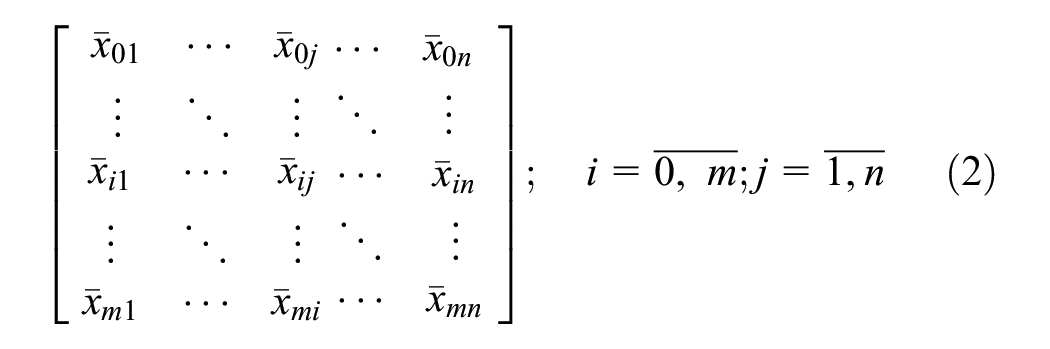
M alternatives and n criteria are organized for the initial matrix of the entropy weight evaluation.

Due to the differences between units, each criterion needs to be standardized to eliminate the influence of different units on the evaluation results. At this stage, the conversion method is applied with the following formulas.

Step 2: Calculation of Entropy Value
The entropy value of ej is calculated with the following equation:

Step 3: Calculation of Information Utility
The information utility of the jth criterion is calculated with the following equation:

Step 4: Calculation of Weights of Criteria
The weights of the criteria are calculated with the following equation.

Step 5: Estimating the Measurement Value
The measurement values of the criteria are obtained with the following equation:

ARAS Method
The ARAS method is a MCDM method developed by Zavadskas and Turskis (2010), which is used to select the best alternative with different attributes. In this method, the ranking of alternatives is done by determining the degree of contribution of each alternative (Alinezhad & Khalili, 2019). The following steps are followed in the application of the ARAS method (Zavadskas & Turskis, 2010):
Step 1: Creating the Decision Matrix
A decision matrix is created. The decision matrix is as follows:

Step 2: Normalization of the Decision Matrix
The initial values of all criteria are normalized and a normalized decision matrix is obtained.
The criteria to be maximized are normalized as follows:

The criteria to be minimized are normalized as follows:

Step 3: Defining the Normalized Weighted Matrix
In this step, the normalized weighted matrix is defined as follows.

The normalized weighted values of all criteria are calculated with the following equation:

The equation below shows the values of the optimality function.

Si denotes the value of the optimality function of alternative i. A large Si value indicates that the alternative is effective. The utility value of the alternative is obtained by comparing it with the best S0. The following equation is used to calculate the degree of benefit Ki:

Step 4: Determining the Final Ranking of Alternatives
Ki values take values between 0 and 1. These values are arranged in descending order and the alternative with the largest Ki value is selected as the best alternative.
MABAC Method
The MABAC method is an MCDM method developed by Pamučar and Ćirović (2015). This method is based on determining the distance of each alternative to the border approximation area of the criterion function. The application steps of the MABAC method are as follows (Pamučar & Ćirović, 2015):
Step 1: Creating the Decision Matrix
The decision matrix is as follows. Where xij is the value of the ith alternative according to the jth criterion, m is the number of alternatives and n is the number of criteria.
Step 2: Normalization of the Decision Matrix
The normalized version of the initial decision matrix is as follows:
The elements of the normalized decision matrix are determined by the following equations:
(a) For the utility criterion;

(b) For the cost criterion;

Step 3: Calculation of Elements in the Matrix
The elements in the matrix are calculated with the help of the following equation:

nij is the element of the normalized matrix. wi is the weighted coefficient of the criterion. The weighted matrix is obtained with the help of the following equation:

In this equation, n is the number of criteria and m is the number of alternatives.
Step 4: Determination of Border Approximation Area Matrix
The border approximation area matrix is determined by the following equation:

After calculating the gi value for each criterion, the boundary approximation area matrix is created.

Step 5: Calculating the Distance of the Alternative from the Border Approximation Area
The distance of the alternatives to the border approximation area (qij) is determined as the difference between the elements in the weight matrix and the value of the border approximation area.


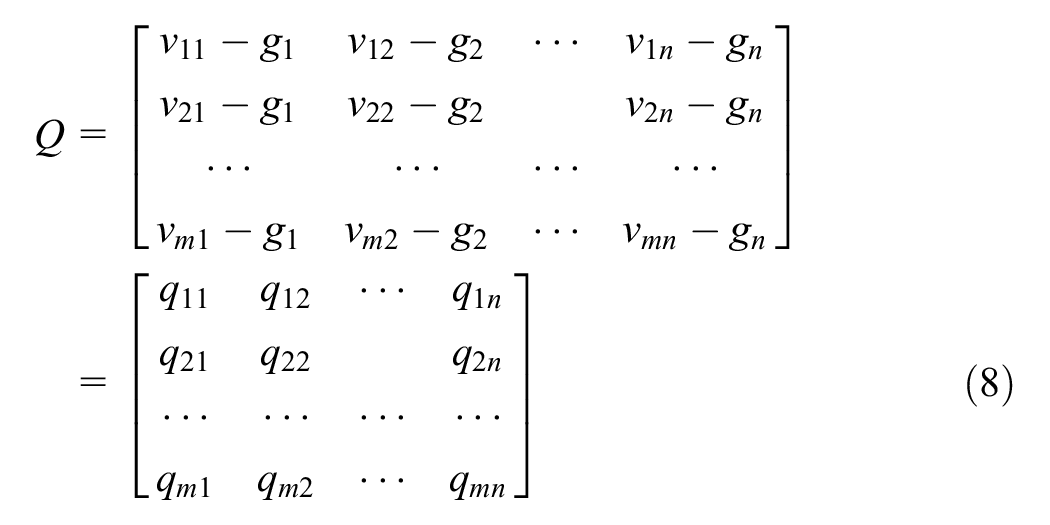
The belonging of alternative Ai to the approach areas (G, G−, G+) is determined by the following equation:

Step 6: Ranking of Alternatives
The values of the criterion functions for the alternatives can be calculated as the sum of the distance of the alternatives from the boundary zoom areas (qi). By taking the sum of the elements of the Q matrix in rows, the final values of the criteria functions of the alternatives are obtained. n is the number of criteria and m is the number of alternatives.
TOPSIS Method
The TOPSIS method is one of the first MCDM methods developed by Yoon (1980) and Hwang and Yoon (1981). This method is used to rank and select alternatives by measuring Euclidean distances. This method is based on the idea that alternatives should be closest to the positive ideal solution and farthest from the negative ideal solution (Zhang et al., 2011). The TOPSIS method consists of the following steps (Tzeng & Huang, 2011):
Step 1: Creating the Decision Matrix
The decision matrix is created with n alternatives and m criteria as follows, where x is the set of performance ratings and w is the weight of the criteria.

Step 2: Normalization of the Decision Matrix
At this stage, the decision-making matrix is normalized. For this, the following equations apply:

For the utility criterion;

For the cost criterion;

Step 3: Obtaining the Normalized Decision Matrix with Weights
The weighted normalized decision matrix is obtained by the following equation:

Step 4: Determination of Positive (PIS) and Negative Ideal Point (NIS)
The following equation is used to determine the positive ideal point.
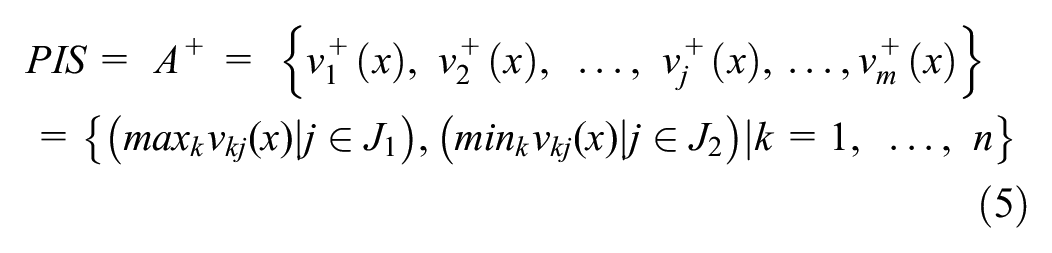
The following equation is used to determine the negative ideal point.
J 1 and J2 show the benefit and cost criteria.
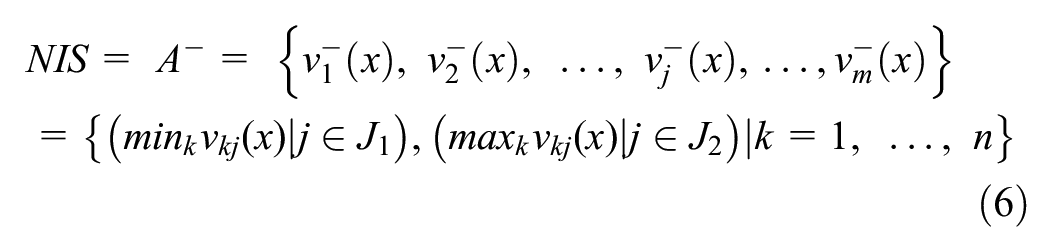
Step 5: Calculating PIS and NIS Discrimination Between Alternatives
The PIS and NIS discrimination values between alternatives are measured using Euclidean distance. The following equation is used for this purpose:


Similarities to PIS are obtained with the following equation:
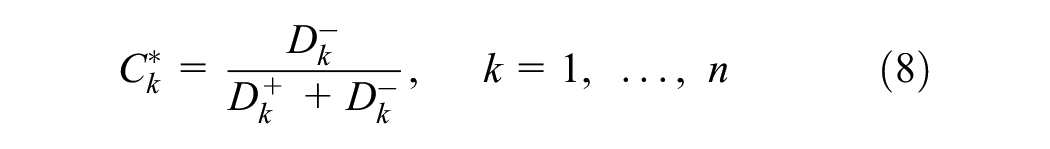
Step 6: Ranking of Alternatives
The value of
Advantages and Disadvantages of MCDM Methods
In this study, the CRITIC, MEREC and Entropy methods were used to weight the research performance criteria and the ARAS, MABAC, and TOPSIS methods were used to rank the universities. Each of these methods has its advantages and disadvantages. The reason for using more than one MCDM method in this research is to combine the advantages of different methods and to minimize the disadvantages of these methods.
The advantage of the CRITIC method is that it evaluates the relationships between the criteria and provides a different perspective on the problem. It weights the criteria objectively. It removes the influence of subjectivity. The disadvantage is that it requires data on alternatives for each criterion and involves relatively complex calculations. The MEREC method removes each criterion and focuses on its impact on the overall performance of the alternatives. It provides a different perspective on the problem. It weights criteria objectively. It removes the effect of subjectivity. The disadvantage is that it requires data on the alternatives for each criterion and has relatively complex calculations. In the entropy method, the weight of the criteria is determined according to the degree of dispersion (Qu et al., 2022). Provides a different perspective on the problem. Weighs criteria objectively. Removes the effect of subjectivity. However, it may not be sufficient on its own to determine model weights (Qu et al., 2022). It needs the data of alternatives for each criterion. In the ARAS method, the priority of alternatives is determined according to the value of the utility function. It uses the relationship with an optimal alternative when ranking alternatives (Hatefi et al., 2021). This method has limitations in dealing with problems where the degrees of belongingness and non-belongingness of an alternative can add up to more than 1 (Mishra et al., 2022). The MABAC method determines the values of the criterion functions of the alternatives and defines the distance of the criterion function to the boundary approximation region (Pamučar & Ćirović, 2015). It provides a different perspective on the problem. It provides consistent results when the units of measurement of the criteria change (Torkayesh et al., 2023). The TOPSIS method proposes to rank alternatives based on the shortest distance to the positive ideal solution (PIS) and the negative ideal solution (NIS) (Hwang & Yoon, 1981). This method represents the preferences of decision makers in a logical way. It can identify the best and worst alternatives simultaneously. It is easy to program and compute. Polyhedral graphs can be used to visualize the performance of all alternatives (Kim et al., 1997; Shih et al., 2007). However, when an alternative is added or removed from the decision problem, the order of preference of the alternatives changes (García-Cascales & Lamata, 2012).
Integration of Rankings: Borda Function
The weights of the criteria for the research performance of universities were analyzed by CRITIC, MEREC, and Entropy methods. The weight values obtained from these three methods were ranked separately by ARAS, MABAC, and TOPSIS methods. As a result of these analyses, nine different ranking values were obtained for each university. Borda function was used to obtain a single rank value from these rankings.
The Borda function is expressed as the most fair method to reach a common goal when different opinions need to be combined (Dummett, 1998). The Borda score obtained from the Borda function expresses the superiority of each alternative over the other alternatives in the preference ranking. Borda function is calculated by the following formula (Y. K. Chen et al., 2014):

Here
Validation and Sensitivity Analysis
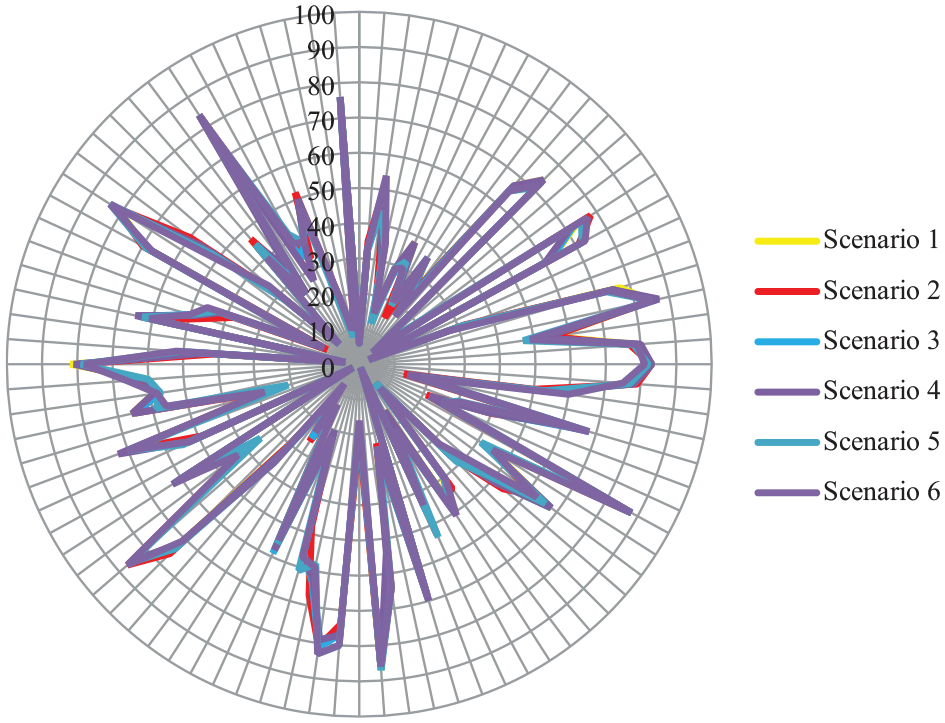
In studies where a model is proposed using MCDM methods, it is important to test the validation and sensitivity of the model. The purpose of these tests is to determine the reliability of the results of the proposed model, to examine the sensitivity and stability of the findings to changes (Mukhametzyanov & Pamučar, 2018). There are various methods to test the validation and sensitivity of a model. This research adopts an approach that follows previous studies. This approach examines the extent of change of results by changing the criteria weights for sensitivity analysis in a systematic approach (Biswas, Pamučar et al., 2022; Hezam et al., 2023; Pamucar et al., 2017; Salimian et al., 2023). Therefore, in this study, scenarios were generated by assigning the weight of the most important criterion to the other criteria respectively and all analyses were repeated. The difference between the ranking results produced by different scenarios means that the model is highly sensitive to change. Kendall’s W test was applied to test whether there is a significant difference between the scenarios.
To test the validation of the results of the model, the method in previous studies was followed (Biswas, Majumder, & Dawn, 2022; Pamucar et al., 2022). For this purpose, a different ranking method, EDAS (Keshavarz Ghorabaee et al., 2015), was used to rank the universities and these results were compared with the existing results using Spearman rank correlation test.
Research Performance Criteria
Measuring research output is challenging. Research has certain characteristics such as productivity, quality, impact, progress and reputation. Different measures reveal different aspects of performance (Auranen & Nieminen, 2010). Research performance is traditionally based on publication output, citations as a measure of impact, and sometimes work quality assessments and reputation indicators of researchers (Bazeley, 2010).
In this research, research performance will be considered in two dimensions. The first one is productivity and the other is impact. Productivity refers to the amount of research output. A high number of research outputs indicates that the researcher or institution is productive. Impact is related to how effective these outputs are. It is therefore often associated with the quality of outputs.
Quantity has an important place in the evaluation of research performance. However, it should be evaluated in terms of quality as well as quantity (Kao & Pao, 2009). The number of publications cannot be used for research performance without knowing the scientific impact of publications. In addition, the number of citations alone is not a reliable performance indicator without considering the number of publications and researchers. Similarly, the citations per article indicator is an acceptable indicator, but it is not recommended for performance measurement as it neglects the size of the university and shows a bias toward large universities (Abdul-Majeed et al., 2021).
In this study, three different measures were used for productivity: Number of documents, number of documents in the top 10%, and number of documents in Q1. However, these measures yield results in favor of large universities when comparing universities with each other. This is because universities with more academic staff are able to publish more. For this reason, these indicators have been adjusted for the number of staff in order to accurately compare universities. As a result, the following three criteria were used as measures of productivity:
(1) Number of documents per academic staff (DPA): Total number of publications divided by the number of academic staff.
(2) Number of documents in the top 10% per academic staff (TPA): The top 10% of the most cited documents in a given subject, year and publication type divided by the total number of publications in a given publication group (Incites, 2022).
(3) Number of documents in Q1 per academic staff member (Q1PA): The number of publications in the top 25% of the Journal Impact Factor (JIF) in a given year (Incites, 2022).
As impact measures, h-index excluding self-citations, Category Normalized Citation Impact, and Impact Relative to the World were used. However, since the h-index excluding self-citations measure produces a result in favor of large universities, this measure was adjusted for the number of staff. As a result, three impact measures were used:
h-index excluding self-citations per academic staff (HPA): The h-index based on the number of citations, calculated by subtracting self-citations (Incites, 2022).
Category Normalized Citation Impact (CNCI): The actual citation value of documents with the same publication type, year, and subject area divided by the expected citation rate (Incites, 2022).
Impact Relative to the World (IRW): It is obtained by dividing the citation impact by the world citation impact. It shows the impact of research on the basis of global research impact. The world average is equal to one. If the IRW value is above one, it means that the unit under study performs above the world average (Incites, 2022).
Universities Included in the Analysis
In certain academic disciplines, more articles are published and these articles receive much higher citations. Therefore, publication impact, which is associated with citation frequency, varies according to the discipline to which the publication belongs (Radicchi & Castellano, 2012). Engineering disciplines have been found to have lower citations than Physics and Chemistry. Therefore, it is stated that researchers in the field of engineering should publish more articles in order to catch up with the h-index of researchers in Physics and Chemistry (Czarnecki et al., 2013).
Aside from these differences in different fields of science, this is also the case for sub-disciplines or fields within the same discipline. Since the number of citations per article is higher in fields with more publications, normalizations are required (Czarnecki et al., 2013; Simko, 2015). As a result, realizing research performance without taking disciplinary differences into account does not allow for a healthy comparison.
This study focuses on the educational research of universities in order to provide a more robust basis for comparing universities. The important point here is that some of the research performance criteria are free from the influence of personnel. Therefore, it is clear that determining a measure by taking into account all the staff of a university will lead to wrong conclusions. As a result, only 88 universities with faculties of education were included in this study and the number of faculty staff was taken as the basis for the calculations. Universities with faculties of education established in 2018, which is the starting year of the data, and later were not included in the study.
Data Collection
The data on research performance used in this study is from InCites Benchmarking and Analytics by Clarivate (December 12, 2022). This data covers the last 5 years (2018–2022) of universities. Only articles and review articles are included in the data. Books, book chapters, proceedings and other publications are excluded. The data covers four categories in the field of education: (1) Education Eduactional Research, (2) Education Scientific Disciplines, (3) Education Special, (4) Psychology Education. Data on the number of staff were taken from the Statistics database of the Council of Higher Education, the supreme organization of higher education institutions in Türkiye (YÖK, 2022).
A decision matrix was created to evaluate the performance criteria of 88 universities based on the data collected. The matrix combines the alternatives used in MCDM with the criteria values for the alternatives. Alternatives are listed in rows and criteria in columns, with each cell displaying the performance of a particular alternative in specific criteria. The decision matrix compares and evaluates the performance of each alternative on each criterion. In this study, 88 universities are listed in rows, and their performance values in each research performance criterion are listed in columns to form a decision matrix. This decision matrix serves as the initial step of the MCDM methods employed in this research.
Results
Findings on Criteria Weights
In order to answer the first question of the research, productivity criteria were weighted with CRITIC, MEREC and Entropy methods. The weight results of the criteria for productivity are shown in Figure 2. When the weight values of the three different MCDM methods are analyzed, it is seen that each criterion reaches the maximum level in different methods. While DPA value is found to be maximum in CRITIC method, Q1PA value has maximum weight in MEREC method and TPA value has maximum weight in Entropy method. While CRITIC and Entropy methods calculated TPA and Q1PA weights closer to each other, MEREC method calculated DPA and TPA values closer to each other. When the weight values of the three criteria made by the three CRCDM methods are evaluated together, it can be said that there are not very serious value differences between the criteria. When the average weight values are examined, the most important criterion is Q1PA, followed by TPA and DPA, respectively.
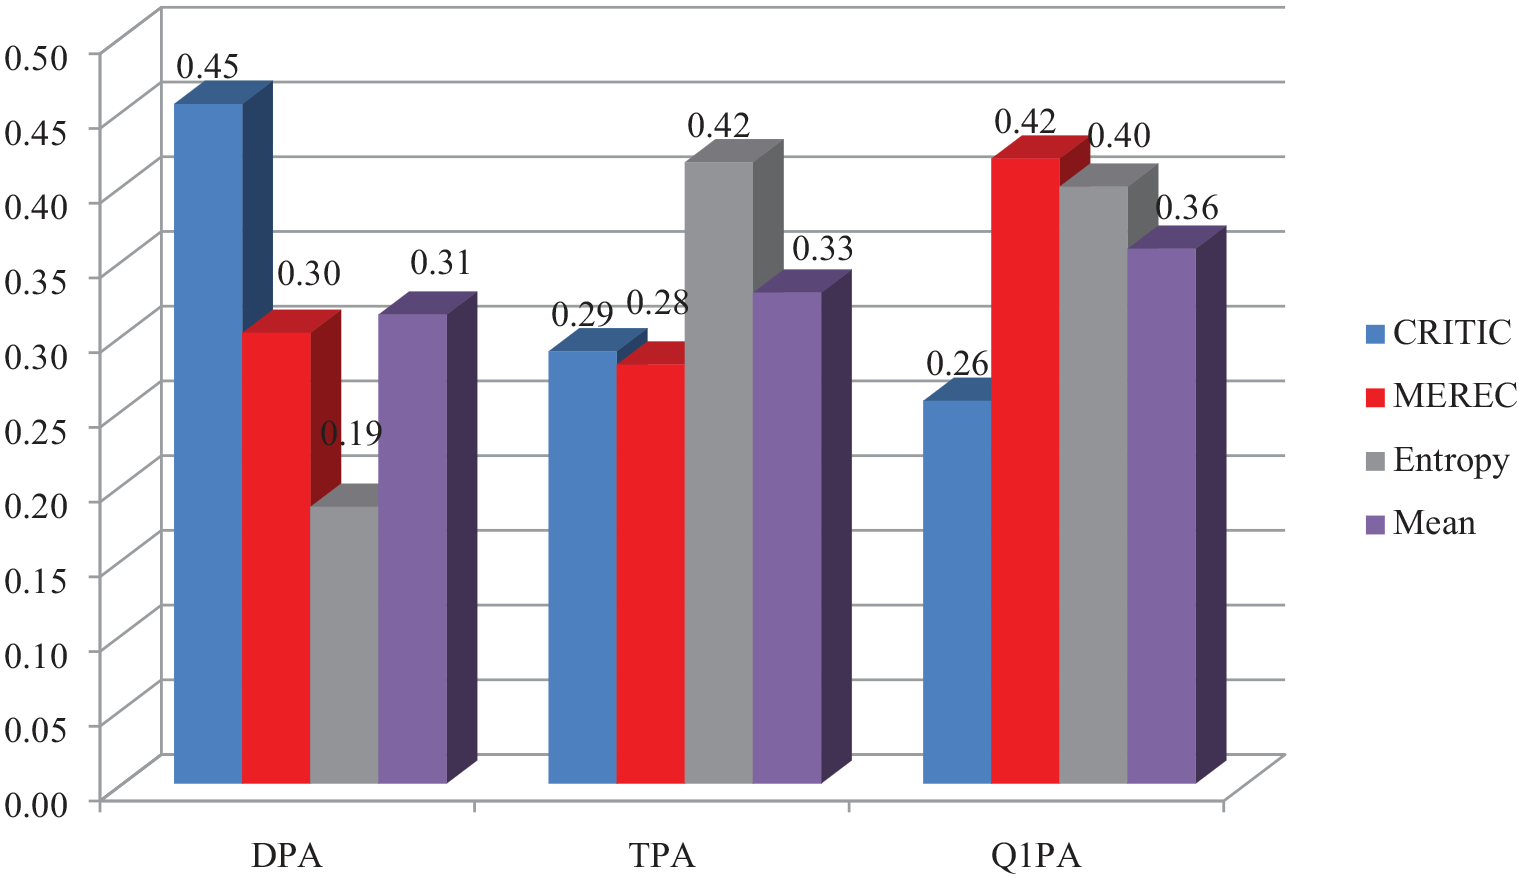
Weight values of productivity criteria.
The weight values of the impact criteria weighted by CRITIC, MEREC and Entropy methods are shown in Figure 3. CRITIC and MEREC methods have ensured that these criteria have close values. However, in the Entropy method, while CNCI and IRW have close values, HPA criterion has a higher weight value. While CRITIC and MEREC methods gave maximum weight to CNCI, Entropy method gave maximum weight to HPA. HPA criterion has minimum values in MEREC method, CNCI criterion has minimum values in Entropy method and IRW has minimum values in MEREC method. When the average weight values are examined, HPA is the most important criterion, followed by CNCI and IRW, respectively.

Weight values of impact criteria.
Findings Regarding the Ranking of Universities
Table 1 shows the ranking results for the research performance of universities. Three different weighting methods were included in three different ranking methods and analyzed separately. A total of nine rankings were obtained for a university. The Borda score of each ranking value was calculated and these scores were summed to obtain a total score for each university. All universities were ranked according to the total scores.
Research Performance Ranking of Universities.

| University | AC | AM | AE | MC | MM | ME | TC | TM | TE | BSAC | BSAM | BSAE | BSMC | BSMM | BSME | BSTC | BSTM | BSTE | TBS | FR |
|---|---|---|---|---|---|---|---|---|---|---|---|---|---|---|---|---|---|---|---|---|
| İhsan Doğramacı Bilkent University< | 1 | 1 | 1 | 1 | 1 | 1 | 1 | 1 | 1 | 88 | 88 | 88 | 88 | 88 | 88 | 88 | 88 | 88 | 792 | 1 |
| MEF University | 2 | 2 | 2 | 2 | 2 | 2 | 2 | 2 | 2 | 87 | 87 | 87 | 87 | 87 | 87 | 87 | 87 | 87 | 783 | 2 |
| Boğaziçi University | 3 | 4 | 3 | 3 | 3 | 3 | 4 | 4 | 3 | 86 | 85 | 86 | 86 | 86 | 86 | 85 | 85 | 86 | 771 | 3 |
| Middle East Technical University | 4 | 3 | 4 | 6 | 6 | 6 | 3 | 3 | 4 | 85 | 86 | 85 | 83 | 83 | 83 | 86 | 86 | 85 | 762 | 4 |
| Bartın University | 5 | 5 | 5 | 5 | 5 | 4 | 6 | 5 | 5 | 84 | 84 | 84 | 84 | 84 | 85 | 83 | 84 | 84 | 756 | 5 |
| Adıyaman University | 6 | 6 | 6 | 4 | 4 | 5 | 8 | 7 | 6 | 83 | 83 | 83 | 85 | 85 | 84 | 81 | 82 | 83 | 749 | 6 |
| Hacettepe University | 7 | 7 | 7 | 8 | 11 | 11 | 5 | 6 | 8 | 82 | 82 | 82 | 81 | 78 | 78 | 84 | 83 | 81 | 731 | 7 |
| Yıldız Teknik University | 9 | 9 | 11 | 9 | 8 | 9 | 9 | 10 | 11 | 80 | 80 | 78 | 80 | 81 | 80 | 80 | 79 | 78 | 716 | 8 |
| Yozgat Bozok University | 11 | 8 | 9 | 11 | 10 | 10 | 10 | 9 | 9 | 78 | 81 | 80 | 78 | 79 | 79 | 79 | 80 | 80 | 714 | 9 |
| TED University | 10 | 10 | 10 | 10 | 9 | 8 | 12 | 11 | 10 | 79 | 79 | 79 | 79 | 80 | 81 | 77 | 78 | 79 | 711 | 10 |
| Selçuk University | 8 | 11 | 8 | 16 | 17 | 13 | 7 | 8 | 7 | 81 | 78 | 81 | 73 | 72 | 76 | 82 | 81 | 82 | 706 | 11 |
| Kırıkkale University | 13 | 13 | 19 | 7 | 7 | 7 | 11 | 12 | 16 | 76 | 76 | 70 | 82 | 82 | 82 | 78 | 77 | 73 | 696 | 12 |
| Başkent University | 16 | 14 | 14 | 13 | 12 | 12 | 17 | 16 | 15 | 73 | 75 | 75 | 76 | 77 | 77 | 72 | 73 | 74 | 672 | 13 |
| Ege University | 12 | 12 | 13 | 19 | 20 | 19 | 13 | 13 | 14 | 77 | 77 | 76 | 70 | 69 | 70 | 76 | 76 | 75 | 666 | 14 |
| Hasan Kalyoncu University | 14 | 15 | 12 | 23 | 24 | 17 | 14 | 14 | 13 | 75 | 74 | 77 | 66 | 65 | 72 | 75 | 75 | 76 | 655 | 15 |
| Aksaray University | 18 | 16 | 18 | 14 | 13 | 15 | 20 | 19 | 20 | 71 | 73 | 71 | 75 | 76 | 74 | 69 | 70 | 69 | 648 | 16 |
| Kırşehir Ahi Evran University | 17 | 18 | 17 | 15 | 15 | 14 | 19 | 22 | 18 | 72 | 71 | 72 | 74 | 74 | 75 | 70 | 67 | 71 | 646 | 17 |
| Yeditepe University | 22 | 23 | 23 | 12 | 14 | 16 | 16 | 18 | 21 | 67 | 66 | 66 | 77 | 75 | 73 | 73 | 71 | 68 | 636 | 18 |
| Istanbul University - Cerrahpaşa | 21 | 17 | 21 | 18 | 16 | 18 | 21 | 15 | 22 | 68 | 72 | 68 | 71 | 73 | 71 | 68 | 74 | 67 | 632 | 19 |
| Anadolu University | 15 | 21 | 22 | 17 | 22 | 23 | 15 | 20 | 24 | 74 | 68 | 67 | 72 | 67 | 66 | 74 | 69 | 65 | 622 | 20 |
| Karamanoglu Mehmetbey University | 20 | 19 | 16 | 28 | 26 | 20 | 22 | 23 | 17 | 69 | 70 | 73 | 61 | 63 | 69 | 67 | 66 | 72 | 610 | 21 |
| Eskisehir Osmangazi University | 19 | 20 | 20 | 30 | 32 | 26 | 18 | 21 | 19 | 70 | 69 | 69 | 59 | 57 | 63 | 71 | 68 | 70 | 596 | 22 |
| Kilis 7 Aralık University | 26 | 30 | 27 | 22 | 21 | 21 | 24 | 28 | 23 | 63 | 59 | 62 | 67 | 68 | 68 | 65 | 61 | 66 | 579 | 23 |
| Istanbul Aydın University | 23 | 22 | 24 | 27 | 28 | 25 | 25 | 26 | 27 | 66 | 67 | 65 | 62 | 61 | 64 | 64 | 63 | 62 | 574 | 24 |
| Atatürk University | 27 | 27 | 33 | 20 | 18 | 22 | 26 | 24 | 35 | 62 | 62 | 56 | 69 | 71 | 67 | 63 | 65 | 54 | 569 | 25 |
| Muş Alparslan University | 35 | 36 | 37 | 21 | 19 | 24 | 27 | 27 | 34 | 54 | 53 | 52 | 68 | 70 | 65 | 62 | 62 | 55 | 541 | 26 |
| Akdeniz University | 24 | 26 | 26 | 36 | 37 | 35 | 23 | 30 | 28 | 65 | 63 | 63 | 53 | 52 | 54 | 66 | 59 | 61 | 536 | 27 |
| Alanya Alaaddin Keykubat University | 28 | 33 | 32 | 24 | 27 | 27 | 29 | 34 | 32 | 61 | 56 | 57 | 65 | 62 | 62 | 60 | 55 | 57 | 535 | 28 |
| Süleyman Demirel University | 29 | 29 | 29 | 29 | 29 | 28 | 31 | 32 | 33 | 60 | 60 | 60 | 60 | 60 | 61 | 58 | 57 | 56 | 532 | 29 |
| Kocaeli University | 25 | 25 | 25 | 39 | 40 | 37 | 28 | 25 | 25 | 64 | 64 | 64 | 50 | 49 | 52 | 61 | 64 | 64 | 532 | 30 |
| Bolu Abant İzzet Baysal University | 30 | 28 | 31 | 32 | 31 | 32 | 34 | 29 | 36 | 59 | 61 | 58 | 57 | 58 | 57 | 55 | 60 | 53 | 518 | 31 |
| Trabzon University | 32 | 32 | 38 | 25 | 25 | 29 | 32 | 33 | 42 | 57 | 57 | 51 | 64 | 64 | 60 | 57 | 56 | 47 | 513 | 32 |
| Afyon Kocatepe University | 33 | 31 | 28 | 34 | 34 | 30 | 38 | 35 | 29 | 56 | 58 | 61 | 55 | 55 | 59 | 51 | 54 | 60 | 509 | 33 |
| Ufuk University | 37 | 24 | 15 | 66 | 56 | 40 | 35 | 17 | 12 | 52 | 65 | 74 | 23 | 33 | 49 | 54 | 72 | 77 | 499 | 34 |
| Artvin Coruh University | 34 | 34 | 30 | 35 | 35 | 34 | 36 | 37 | 31 | 55 | 55 | 59 | 54 | 54 | 55 | 53 | 52 | 58 | 495 | 35 |
| Giresun University | 36 | 37 | 35 | 33 | 33 | 31 | 40 | 39 | 37 | 53 | 52 | 54 | 56 | 56 | 58 | 49 | 50 | 52 | 480 | 36 |
| Uşak University | 31 | 35 | 34 | 37 | 38 | 38 | 30 | 38 | 40 | 58 | 54 | 55 | 52 | 51 | 51 | 59 | 51 | 49 | 480 | 37 |
| Amasya University | 39 | 40 | 41 | 31 | 30 | 33 | 37 | 36 | 43 | 50 | 49 | 48 | 58 | 59 | 56 | 52 | 53 | 46 | 471 | 38 |
| Erzincan Binali Yıldırım University | 51 | 51 | 59 | 26 | 23 | 36 | 33 | 31 | 51 | 38 | 38 | 30 | 63 | 66 | 53 | 56 | 58 | 38 | 440 | 39 |
| Hakkari University | 41 | 38 | 39 | 41 | 39 | 39 | 45 | 40 | 39 | 48 | 51 | 50 | 48 | 50 | 50 | 44 | 49 | 50 | 440 | 40 |
| Manisa Celal Bayar University | 45 | 42 | 48 | 38 | 36 | 41 | 43 | 41 | 47 | 44 | 47 | 41 | 51 | 53 | 48 | 46 | 48 | 42 | 420 | 41 |
| Sakarya University | 38 | 41 | 40 | 45 | 46 | 44 | 41 | 44 | 44 | 51 | 48 | 49 | 44 | 43 | 45 | 48 | 45 | 45 | 418 | 42 |
| Ordu University | 40 | 39 | 36 | 55 | 57 | 52 | 39 | 42 | 38 | 49 | 50 | 53 | 34 | 32 | 37 | 50 | 47 | 51 | 403 | 43 |
| Fırat University | 42 | 44 | 43 | 43 | 42 | 43 | 49 | 47 | 46 | 47 | 45 | 46 | 46 | 47 | 46 | 40 | 42 | 43 | 402 | 44 |
| Harran University | 43 | 52 | 45 | 47 | 50 | 47 | 44 | 52 | 41 | 46 | 37 | 44 | 42 | 39 | 42 | 45 | 37 | 48 | 380 | 45 |
| Tokat Gaziosmanpaşa University | 48 | 47 | 52 | 40 | 41 | 42 | 50 | 48 | 54 | 41 | 42 | 37 | 49 | 48 | 47 | 39 | 41 | 35 | 379 | 46 |
| Recep Tayyip Erdoğan University | 44 | 43 | 46 | 48 | 49 | 51 | 48 | 50 | 50 | 45 | 46 | 43 | 41 | 40 | 38 | 41 | 39 | 39 | 372 | 47 |
| Ağrıİbrahim Çeçen University | 50 | 46 | 47 | 50 | 48 | 53 | 53 | 43 | 49 | 39 | 43 | 42 | 39 | 41 | 36 | 36 | 46 | 40 | 362 | 48 |
| Hatay Mustafa Kemal University | 52 | 45 | 44 | 51 | 51 | 50 | 55 | 46 | 45 | 37 | 44 | 45 | 38 | 38 | 39 | 34 | 43 | 44 | 362 | 49 |
| Van Yüzüncü Yıl University | 53 | 53 | 56 | 42 | 43 | 46 | 51 | 51 | 57 | 36 | 36 | 33 | 47 | 46 | 43 | 38 | 38 | 32 | 349 | 50 |
| Gaziantep University | 54 | 54 | 55 | 44 | 44 | 45 | 52 | 53 | 56 | 35 | 35 | 34 | 45 | 45 | 44 | 37 | 36 | 33 | 344 | 51 |
| Mersin University | 47 | 48 | 51 | 53 | 55 | 54 | 47 | 56 | 53 | 42 | 41 | 38 | 36 | 34 | 35 | 42 | 33 | 36 | 337 | 52 |
| Düzce University | 49 | 50 | 53 | 52 | 54 | 55 | 46 | 55 | 52 | 40 | 39 | 36 | 37 | 35 | 34 | 43 | 34 | 37 | 335 | 53 |
| Kahramanmaraş Sütçüİmam University | 46 | 49 | 49 | 61 | 63 | 60 | 42 | 49 | 48 | 43 | 40 | 40 | 28 | 26 | 29 | 47 | 40 | 41 | 334 | 54 |
| Çanakkale Onsekiz Mart University | 55 | 55 | 58 | 46 | 45 | 48 | 54 | 54 | 61 | 34 | 34 | 31 | 43 | 44 | 41 | 35 | 35 | 28 | 325 | 55 |
| Sivas Cumhuriyet University | 63 | 61 | 60 | 49 | 47 | 49 | 58 | 57 | 55 | 26 | 28 | 29 | 40 | 42 | 40 | 31 | 32 | 34 | 302 | 56 |
| İstanbul Medipol University | 61 | 57 | 50 | 67 | 65 | 57 | 63 | 58 | 30 | 28 | 32 | 39 | 22 | 24 | 32 | 26 | 31 | 59 | 293 | 57 |
| Kastamonu University | 57 | 56 | 61 | 54 | 52 | 58 | 59 | 59 | 60 | 32 | 33 | 28 | 35 | 37 | 31 | 30 | 30 | 29 | 285 | 58 |
| Nevşehir Hacı Bektaş Veli University | 56 | 58 | 54 | 56 | 59 | 56 | 60 | 60 | 58 | 33 | 31 | 35 | 33 | 30 | 33 | 29 | 29 | 31 | 284 | 59 |
| Niğde Ömer Halisdemir University | 62 | 59 | 57 | 63 | 62 | 65 | 66 | 61 | 65 | 27 | 30 | 32 | 26 | 27 | 24 | 23 | 28 | 24 | 241 | 60 |
| Marmara University | 58 | 62 | 63 | 60 | 60 | 62 | 61 | 65 | 70 | 31 | 27 | 26 | 29 | 29 | 27 | 28 | 24 | 19 | 240 | 61 |
| Biruni University | 74 | 60 | 42 | 85 | 83 | 76 | 71 | 45 | 26 | 15 | 29 | 47 | 4 | 6 | 13 | 18 | 44 | 63 | 239 | 62 |
| Pamukkale University | 59 | 64 | 66 | 59 | 61 | 64 | 56 | 67 | 71 | 30 | 25 | 23 | 30 | 28 | 25 | 33 | 22 | 18 | 234 | 63 |
| Erciyes University | 60 | 63 | 62 | 65 | 69 | 67 | 57 | 66 | 64 | 29 | 26 | 27 | 24 | 20 | 22 | 32 | 23 | 25 | 228 | 64 |
| Kafkas University | 70 | 70 | 69 | 58 | 53 | 59 | 65 | 62 | 69 | 19 | 19 | 20 | 31 | 36 | 30 | 24 | 27 | 20 | 226 | 65 |
| Necmettin Erbakan University | 67 | 69 | 76 | 57 | 58 | 61 | 64 | 64 | 76 | 22 | 20 | 13 | 32 | 31 | 28 | 25 | 25 | 13 | 209 | 66 |
| Aydın Adnan Menderes University | 65 | 68 | 67 | 62 | 64 | 63 | 68 | 68 | 68 | 24 | 21 | 22 | 27 | 25 | 26 | 21 | 21 | 21 | 208 | 67 |
| Gazi University | 64 | 65 | 72 | 64 | 66 | 69 | 62 | 63 | 72 | 25 | 24 | 17 | 25 | 23 | 20 | 27 | 26 | 17 | 204 | 68 |
| Siirt University | 68 | 67 | 65 | 69 | 67 | 66 | 75 | 70 | 67 | 21 | 22 | 24 | 20 | 22 | 23 | 14 | 19 | 22 | 187 | 69 |
| İnönü University | 66 | 66 | 68 | 68 | 68 | 68 | 69 | 69 | 73 | 23 | 23 | 21 | 21 | 21 | 21 | 20 | 20 | 16 | 186 | 70 |
| Muğla Sıtkı Koçman University | 69 | 72 | 71 | 70 | 71 | 71 | 70 | 75 | 77 | 20 | 17 | 18 | 19 | 18 | 18 | 19 | 14 | 12 | 155 | 71 |
| Kütahya Dumlupınar University | 75 | 76 | 73 | 72 | 72 | 70 | 76 | 72 | 63 | 14 | 13 | 16 | 17 | 17 | 19 | 13 | 17 | 26 | 152 | 72 |
| Bayburt University | 76 | 71 | 64 | 78 | 77 | 74 | 79 | 74 | 59 | 13 | 18 | 25 | 11 | 12 | 15 | 10 | 15 | 30 | 149 | 73 |
| Balıkesir University | 71 | 73 | 78 | 71 | 70 | 72 | 74 | 73 | 78 | 18 | 16 | 11 | 18 | 19 | 17 | 15 | 16 | 11 | 141 | 74 |
| İzmir Demokrasi University | 77 | 77 | 70 | 81 | 82 | 80 | 67 | 71 | 62 | 12 | 12 | 19 | 8 | 7 | 9 | 22 | 18 | 27 | 134 | 75 |
| Zonguldak Bülent Ecevit University | 72 | 75 | 74 | 75 | 75 | 75 | 72 | 77 | 75 | 17 | 14 | 15 | 14 | 14 | 14 | 17 | 12 | 14 | 131 | 76 |
| Burdur Mehmet Akif Ersoy University | 73 | 74 | 77 | 73 | 73 | 73 | 77 | 76 | 79 | 16 | 15 | 12 | 16 | 16 | 16 | 12 | 13 | 10 | 126 | 77 |
| Dokuz Eylül University | 78 | 79 | 80 | 74 | 74 | 77 | 78 | 80 | 81 | 11 | 10 | 9 | 15 | 15 | 12 | 11 | 9 | 8 | 100 | 78 |
| Çukurova University | 79 | 78 | 81 | 76 | 78 | 79 | 73 | 78 | 80 | 10 | 11 | 8 | 13 | 11 | 10 | 16 | 11 | 9 | 99 | 79 |
| İstanbul Okan University | 80 | 80 | 75 | 83 | 84 | 84 | 80 | 79 | 66 | 9 | 9 | 14 | 6 | 5 | 5 | 9 | 10 | 23 | 90 | 80 |
| Sinop University | 81 | 82 | 79 | 82 | 81 | 81 | 81 | 82 | 74 | 8 | 7 | 10 | 7 | 8 | 8 | 8 | 7 | 15 | 78 | 81 |
| Ondokuz Mayıs University | 82 | 81 | 83 | 77 | 76 | 78 | 82 | 81 | 84 | 7 | 8 | 6 | 12 | 13 | 11 | 7 | 8 | 5 | 77 | 82 |
| Dicle University | 83 | 83 | 82 | 80 | 80 | 83 | 84 | 83 | 83 | 6 | 6 | 7 | 9 | 9 | 6 | 5 | 6 | 6 | 60 | 83 |
| Trakya University | 84 | 84 | 85 | 79 | 79 | 82 | 83 | 84 | 87 | 5 | 5 | 4 | 10 | 10 | 7 | 6 | 5 | 2 | 54 | 84 |
| Bursa Uludağ University | 85 | 85 | 88 | 84 | 85 | 87 | 85 | 85 | 88 | 4 | 4 | 1 | 5 | 4 | 2 | 4 | 4 | 1 | 29 | 85 |
| Maltepe University | 87 | 86 | 84 | 87 | 87 | 86 | 87 | 86 | 82 | 2 | 3 | 5 | 2 | 2 | 3 | 2 | 3 | 7 | 29 | 86 |
| İstanbul Sabahattin Zaim University | 86 | 87 | 87 | 86 | 86 | 85 | 86 | 87 | 85 | 3 | 2 | 2 | 3 | 3 | 4 | 3 | 2 | 4 | 26 | 87 |
| Fatih Sultan Mehmet Vakıf University | 88 | 88 | 86 | 88 | 88 | 88 | 88 | 88 | 86 | 1 | 1 | 3 | 1 | 1 | 1 | 1 | 1 | 3 | 13 | 88 |