
Abstract
This study aims to analyze the research performance of 38 OECD countries in the last 10 years. For this purpose, the research performance of these countries was analyzed using multi-criteria decision-making (MCDM) methods with the productivity and publication impact data of 38 countries. The analyses were conducted both normal data and also with adjusted data based on the population and income level of the countries. Firstly, the importance level of research performance criteria was determined by three different MCDM methods. Using the weight values obtained from these methods, countries were ranked by three different MCDM methods used for ranking purposes. According to the results of the study, the publications in the highest cited 1% were determined as the most important and distinctive criterion. Secondly, the criterion expressing the relative impact of publications on the world was determined as the second most important criterion. In the analyses conducted without normalizing the data, USA showed the highest research performance. In the analyses conducted by considering the population of the countries, Switzerland showed the highest research performance. In the analyses conducted by taking into account the income level of the countries, Estonia has the highest research performance. As R&D expenditures, development level of countries and international collaboration increased, research performance of countries increased. However, with the increase in domestic collaboration, there has been a decrease in research performance. In addition, this research has shown how to use MCDM in the measurement of research performance by using objective methods with different backgrounds.
Plain language summary
This study analyses the research performance of 38 OECD countries over the last 10 years. For this purpose, productivity and publication impact data of 38 countries obtained from the Web of Science database for the last 10 years and the research performance of these countries were analysed using multi-criteria decision making (MCDM) methods. MCDM is a set of methods used in solving problems with multiple criteria and alternatives. These methods can determine the level of importance of criteria and allow decision makers to select, rank, and sort alternatives. Analyses were conducted using both normal and adjusted data for the population and income levels of the countries. First, the importance level of the research performance criteria was determined using three different MCDM methods. Using the weight values obtained from these methods, the countries were ranked using three different MCDM methods. According to the results of the study, the most cited publications in the top 1% were determined to be the most important and distinguishing criterion. Second, the criterion expressing the relative impact of publications on the world was determined to be the second most important criterion. In the analyses conducted without normalizing the data, the USA showed the highest research performance. In the analyses conducted by considering the population of the countries, Switzerland showed the highest research performance. Estonia has the highest research performance in the analyses based on the income level of the countries. As R&D expenditures, development level of countries, and international co-operation increased, research performance of countries also increased. However, as domestic collaboration increased, research performance declined. In addition, this research has shown how MCDM can be used to measure research performance using objective methods with different backgrounds.
Introduction
Although there is no agreed-upon definition of research performance conceptually, there have been some studies conducted on this concept (Bazeley, 2010; Edgar & Geare, 2013). Research performance consists of two basic components. The first one is research, and the second one is performance. Research includes activities that can be considered as the foundation of performance. Performance, on the other hand, involves sharing what is learned through research with the scientific community in order to become visible. Conceptually, research performance has traditionally been based on publication outputs in various forms, citations as a measure of impact, expert assessments as a measure of the quality of work, and indicators of the reputation of researchers (Bazeley, 2010). In line with the literature, research performance refers to the evaluation of the productivity and impact of research outputs at various levels, including individual researchers, research-related institutions like universities and research centers, and even countries.
Research performance has been frequently examined in recent years. In the literature, it is evident that numerous studies have been conducted on the research performance of higher education institutions, universities, research centers, faculties, researchers, and countries. There are several reasons to examine research performance.
First, some countries rely heavily on the research performance of higher education institutions (Bazeley, 2010). Therefore, government grants to higher education institutions with high research performance increase (Geuna & Martin, 2003). This results in increased efforts by higher education institutions to improve research performance. Second, as higher education institutions face financial constraints, there is an increased demand for productivity and accountability from researchers and higher education institutions (Law & Chon, 2007). Research performance is analyzed based on higher education institutions and countries. In terms of countries, one reason for measuring research performance is that international ranking organizations focus on research performance. Ranking organizations such as THE, ARWU, and QS rank universities and countries according to certain performance criteria. Countries that are highly ranked, especially in the category of top universities, are in a more advantageous position to attract qualified students (Bowman & Bastedo, 2009), positively affecting the reputation of the institution and thus that of the country (Bastedo & Bowman, 2010). A strong academic reputation brings about social and economic advantages for both the university and the region (Fritsch & Slavtchev, 2007; Pressman et al., 1995). In addition, research performance has been shown to impact critical activities such as organizational missions, decision-making, employment, and strategy (Hazelkorn, 2007, 2008). All these factors have led universities and researchers to strive for greater productivity (Law & Chon, 2007).
In recent years, there has been a growing interest in improving research performance (Abdul-Majeed et al., 2021; Barney et al., 2022; Preut et al., 2022). This growing interest in research performance is evident in the literature. Studies have been conducted to examine research productivity and performance for various purposes, including academics (Horta et al., 2020), universities (Abdul-Majeed et al., 2021), and faculties (Khalid & Tadesse, 2022). In addition, studies have been conducted on the performance of countries focused on research in specific fields such as health (Mijumbi-Deve et al., 2021), computer science (Guan & Ma, 2004), cloud computing (Awan & Abbas, 2023), tourism (Cardoso et al., 2020), and physics (Zhang et al., 2017). However, there are few studies in the literature that address research performance holistically, based on cross-country comparisons, rather than focusing on specific fields or topics. Sedláček (2017) examined the impact of governance on the research performance of European countries. Adeyemo (2019) analyzed the research performance of ASEAN (Association of Southeast Asian Nations) countries. However, there is a lack of comprehensive and comparative studies on the research performance of countries in the literature.
One of the important issues related to research performance is the methods by which it will be measured. In a number of studies, research performance is analyzed using descriptive statistical methods (Brocato & Mavis, 2005; Holliday et al., 2014; Khan et al., 2014; Saxena et al., 2022). Moreover, research performance is measured using various methods such as data envelopment analysis (Hung & Chou, 2013; Mutz et al., 2017) and bibliometric methods (Cardoso et al., 2020).
In this study, research performance using with multi-criteria decision making (MCDM) methods, which are differ from the methods used in existing research. MCDM is a part of operations research that is used to classify, categorize, and rank alternatives. MCDM is a concept that encompasses all methods that help decision makers in dealing with multiple conflicting criteria (Ho, 2008). MCDM methods have been developed to assist decision makers in the decision process. These methods provide some techniques to find solutions to existing problems. MCDM places decision makers at the center of the decision making process (Ishizaka & Nemery, 2013). These methods, techniques and approaches improve the quality of decisions by making them more clear, efficient and rational. MCDM provides a method to tackle complex problems by breaking problems into smaller parts (Mardani et al., 2015). Many techniques have been developed in recent years for solving multi-criteria decision problems and this development is still continuing (Wallenius et al. 2008). This development is due to the need to solve different types of problems encountered (Ishizaka & Nemery, 2013). In other words, a large number of MCDM methods have been developed over the years, each with a different theoretical background, able to answer different types of questions and produce different results. MCDM is one of the most widely used decision methods in different disciplines. These methods are used in many fields such as energy, environment, economy (Mardani et al., 2015).
MCDM methods are used to solve real-world problems with multiple criteria and alternatives. MCDM methods have the capacity to evaluate multiple and even conflicting criteria. MCDM can statistically weight the criteria based on a theoretical framework instead of assuming them to be of equal importance or arbitrarily setting an importance level. It can evaluate more than one alternative by considering various criteria. Measurement of research performance is a real problem with multiple criteria and alternatives in accordance with the nature of MCDM. When evaluating the research performance of researchers, institutions, universities, and countries, many criteria such as the number of publications and the impact should be considered. Moreover, if multiple researchers, institutions, universities, or countries are considered, MCDM is capable of ranking, selecting, and sorting these different alternatives. Therefore, the problem addressed by this research is suitable for the nature of MCDM since there are both different performance criteria and the measurement of research performance across multiple countries.
This study aims to examine the research performance of 38 OECD countries over the past 10 years using multiple MCDM methods with different theoretical backgrounds to measure the research performance of countries, rank them accordingly and test the relationship between research performance and various variables. There are two main reasons for analyzing OECD countries in this study. The first reason is that the OECD includes both developed and developing countries from various continents. This has provided new information on research performance for all OECD member countries. The second reason is the availability of comparable data for OECD countries. Therefore, the following three research questions are posed and answers are sought:
(1) What are the criteria weights for research performance?
(2) What are countries in terms of research performance?
(3) Is there a relationship between research performance ranking and a country’s level of development, R&D expenditures, international collaboration rate, and domestic collaboration rate?
This study analyses the research performance of OECD countries and also examines the relationship between research performance and certain variables. Previous studies have shown that research performance increases with an increase in R&D expenditures (Gulbrandsen & Smeby, 2005; Lee, 2021; Meo et al., 2013; Solarin & Yen, 2016; Teitel, 1994; Uyar et al., 2022). Another variable related to research performance is the level of development of countries. The level of development generally refers to the economic development of countries. Previous studies have revealed that developed countries invest more in research and development activities, which has a positive impact on publication outputs (Gonzalez-Brambila et al., 2016; Man et al., 2004). This relationship between economic development and scientific productivity growth has also been proven by other studies (Cimini et al., 2014; Docampo & Bessoule, 2019; Mueller, 2016; Rahman & Fukui, 2003). Another variable associated with research performance is research collaboration. Previous studies have shown that increased international collaboration positively affects research performance (Lee & Bozeman, 2005). In addition, collaboration with researchers in different countries is positively related to the number of citations, which is an indicator of the impact of publications (Aksnes, 2003; Lancho Barrantes et al., 2012). In contrast, an increase in domestic collaboration decreases research productivity and publication impact (Goldfinch et al., 2003). This study also strengthened the existing evidence by revealing how these variables are related to research performance.
This research provides a new perspective on research performance. First, considering that there are many concepts affecting research performance, assessing research performance without considering characteristics such as the level of development and population of countries may not be accurate for countries with different sizes in many respects. Second, evaluations made with different criteria and especially without considering the importance of these criteria may lead to biased results. Finally, evaluating research performance is a real-life problem in line with the main principle of MCDM. Addressing this problem using different MCDM methods, which have their own characteristics, may allow a multidimensional and more reliable evaluation of research performance. This study provides an opportunity to consider research performance from a broad and different perspective.
This research has potential contributions, especially for researchers and policy makers. This research analyzed research performance using different MCDM methods. This may enable researchers to examine research performance from a different perspective. Second, using the methods applied in this study, researchers can analyse research institutions, academic units, universities, and countries. Finally, the methodology presented in this study is not a single and unique methodology. Apart from these methods, research performance can be analyzed using different MCDM methods that achieve the same purpose. As a result, this study will provide researchers with a new methodological perspective. This study analyses the research performance of a comprehensive group of countries using a rich methodology. The results of this study provide important information to help policymakers in policy making on research performance. First, this study analyses the research performance position of a country compared with other countries from different perspectives. Policy makers can rethink how to allocate expenditure on performance more effectively. It can also help countries produce evidence-based policies to improve competitiveness. New strategies can be developed to improve countries’ research performances. In addition, each country can analyse the current situation by taking a closer look at the research performance of higher education institutions and develop new strategies. The performance results of international ranking organizations ignore the size of the countries. This research addresses these important criteria and presents new results specific to the situation of countries.
Method
In this study, MCDM methods were used to evaluate the research performance of countries. MCDM originated as part of operations research, which uses mathematical tools to assist decision makers (Zavadskas et al., 2014).
The implementation model for how MCDM methods will be used in this research is shown in Figure 1. First, the importance level, that is, the weight values, of the research performance criteria were obtained. For this, three different objective MCDM methods were used: (1) Criteria Importance Through Intercriteria Correlation (CRITIC), (2) Method Based on the Removal Effects of Criteria (MEREC), and (3) Entropy. Objective MCDM methods are not based on expert opinions and are used when data on criteria and alternatives are available. After the weight values of the performance criteria were determined, these weight values were included in the analysis with three different MCDM methods used for ranking purposes, and the countries were ranked. The ranking methods used are Additive Ratio Assessment (ARAS), Multi-Attributive Border Approximation Area Comparison (MABAC), and The Technique for Order of Preference by Similarity to Ideal Solution (TOPSIS). The values obtained from the three different weighting methods were analyzed using these ranking methods to obtain nine ranking values for a country. To obtain a single value from the different ranking values, the final ranking of the countries was determined using the Borda function. Considering that there are numerous MCDM methods with different theoretical and statistical backgrounds and that evaluating research performance through a single method may lead to biased results, six MCDM methods were used for weighting and ranking. Another benefit of using more than one method is the diversity of methods, which allows for comprehensive and verifiable analysis.

MCDM implementation model.
After the research performance rankings of the countries were obtained, Spearman’s rank correlation analysis was conducted to determine whether there is a relationship between the research performance rankings and the development level, R&D expenditures, international collaboration rate, and domestic collaboration rate of the countries. The methods used are detailed in the following section.
CRITIC Method
CRITIC is an MCDM method developed by Diakoulaki et al. (1995) used for objective weighting of criteria. The CRITIC method examines the relationship between criteria and uses correlations between criteria. The implementation steps of this method are as follows (Alinezhad & Khalili, 2019):
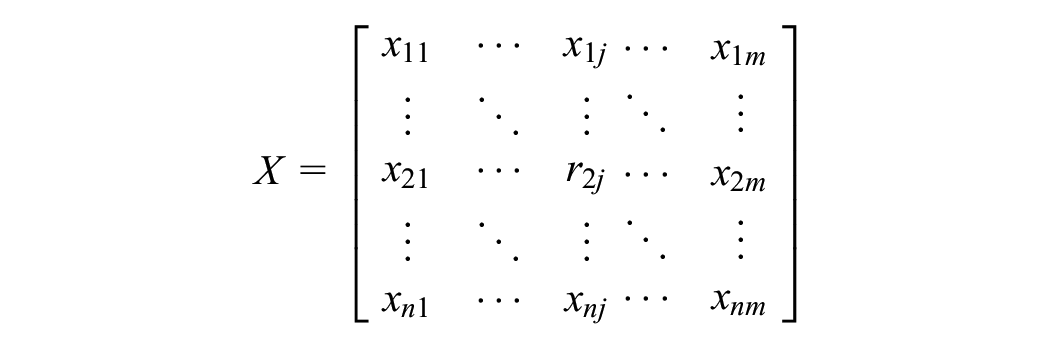
Step 1: Normalization of the Decision Matrix
The decision matrix in the CRITIC method is as follows:

The following equations are used to normalize the positive and negative values of the decision matrix, respectively.

Where xij represents the normalized value of the decision matrix for the jth attribute of each ith alternative, r i + = max (r1, r2, …, r m ), and r i −= min (r1, r2, …, r m ).
Step 2: Determination of Correlation Coefficient
The correlation coefficient between attributes is found with the help of the following equation:
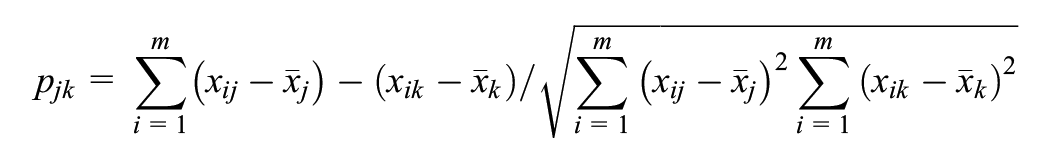
where

Step 3: Determination of C Index
The standard deviation of each attribute is estimated by the first equation below. The C index is then calculated with the second equation.


Step 4: Determination of the Weight of Attributes
The weights of the attributes are calculated with the following equation:

Step 5: Determination of Final Weighting of Attributes
The weights of the attributes are obtained by sorting them in descending order.
MEREC Method
MEREC is an MCDM method developed by Keshavarz-Ghorabaee et al. (2021). This method is an MCDM method used for objective weighting of criteria. The CRITIC method is based on the removal effect of each criterion on the overall performance of the alternatives to determine the importance of the criteria. The implementation steps of this method are as follows (Keshavarz-Ghorabaee et al., 2021):
Step 1: Creating the Decision Matrix
A decision matrix is created that shows the rating of each alternative or the values for each criterion.
Step 2: Normalization of the Decision Matrix
A simple linear normalization is used to scale the elements of the decision matrix. The following equation is used for normalization.

Step 3: Calculation of Overall Performance of Alternatives (S i )
A logarithmic measure with equal criteria weights is applied to calculate the overall performance of the alternatives. The following equation is used for this.

Step 4: Calculating the Performance of Alternatives
The performance of the alternatives is calculated by removing each criterion. The performance of the alternatives is calculated as follows:

Step 5: Calculating the Sum of Absolute Deviations
In this step, the removal effects of the jth criterion are calculated based on the values obtained in the third and fourth steps.

Step 6: Determination of the Final Weight of the Criteria
The objective weight of each criterion is calculated using the lifting effects from step five. The value wj denotes the weight of the jth criterion.

Entropy Method
Entropy is an MCDM method used for objective weighting of criteria. This method uses the magnitude of the entropy value and calculates the degree to which the criteria convey decision information, revealing the relative weight of the criteria. The implementation steps of the entropy method are as follows (Chen, 2020):
Step 1: Normalization of the Decision Matrix
M alternatives and n criteria are organized for the initial matrix of the entropy weight evaluation.

Due to the differences between units, each criterion needs to be standardized to eliminate the influence of different units on the evaluation results. At this stage, the conversion method is applied with the following formulas.

or


or

Step 2: Calculation of Entropy Value
The entropy value of ej is calculated with the following equation:

Step 3: Calculation of Information Utility
The information utility of the jth criterion is calculated with the following equation:

Step 4: Calculation of Weights of Criteria
The weights of the criteria are calculated with the following equation.

Step 5: Estimating the Measurement Value
The measurement values of the criteria are obtained with the following equation:

ARAS Method
The ARAS method is an MCDM method developed by Zavadskas and Turskis (2010) and is used to objectively identify alternatives with different attributes. In this method, the degree of contribution of each alternative is determined while ranking the alternatives (Alinezhad & Khalili, 2019). The implementation steps of the ARAS method are as follows (Zavadskas & Turskis, 2010):
Step 1: Creating the Decision Matrix
A decision matrix is created. The decision matrix is as follows:

Step 2: Normalization of the Decision Matrix
The initial values of all criteria are normalized and a normalized decision matrix is obtained.

The criteria to be maximized are normalized as follows:

The criteria to be minimized are normalized as follows:

Step 3: Defining the Normalized Weighted Matrix
In this step, the normalized weighted matrix is defined as follows.


The normalized weighted values of all criteria are calculated with the following equation:

The equation below shows the values of the optimality function.

S i denotes the value of the optimality function of alternative i. A large S i value indicates that the alternative is effective. The utility value of the alternative is obtained by comparing it with the best S0. The following equation is used to calculate the degree of benefit K i :

Step 4: Determining the Final Ranking of Alternatives
Ki values take values between 0 and 1. These values are arranged in descending order and the alternative with the largest Ki value is selected as the best alternative.
MABAC Method
MABAC is an MCDM method used to objectively rank alternatives in MCDM problems. This method, developed by Pamucar and Cirovic (2015), determines the distance of the alternatives to the boundary approximation area of the criterion function and ranks the alternatives accordingly. The implementation steps of the MABAC method are as follows:
Step 1: Creating the Decision Matrix
The decision matrix is as follows. Where xij is the value of the ith alternative according to the jth criterion, m is the number of alternatives and n is the number of criteria.


Step 2: Normalization of the Decision Matrix
The normalized version of the initial decision matrix is as follows:


The elements of the normalized decision matrix are determined by the following equations:
(a) For the utility criterion;

(b) For the cost criterion;

Step 3: Calculation of Elements in the Matrix
The elements in the matrix are calculated with the help of the following equation:

nij is the element of the normalized matrix. w i is the weighted coefficient of the criterion. The weighted matrix is obtained with the help of the following equation:

In this equation, n is the number of criteria and m is the number of alternatives.
Step 4: Determination of Border Approximation Area Matrix
The border approximation area matrix is determined by the following equation:

After calculating the g i value for each criterion, the boundary approximation area matrix is created.


Step 5: Calculating the Distance of the Alternative from the Border Approximation Area
The distance of the alternatives to the border approximation area (qij) is determined as the difference between the elements in the weight matrix and the value of the border approximation area.


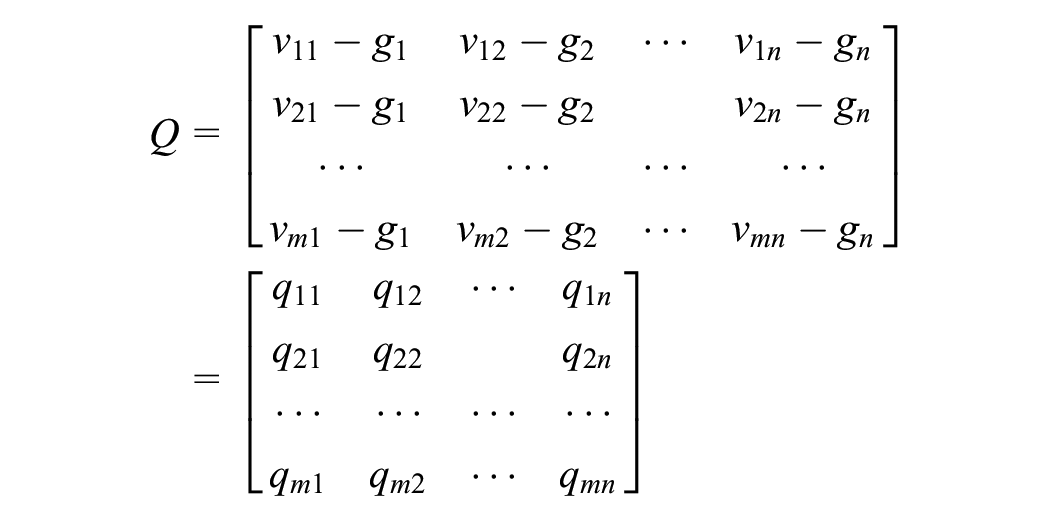
The belonging of alternative A i to the approach areas (G, G-, G+) is determined by the following equation:

Step 6: Ranking of Alternatives
The values of the criterion functions for the alternatives can be calculated as the sum of the distance of the alternatives from the boundary zoom areas (q i ). By taking the sum of the elements of the Q matrix in rows, the final values of the criteria functions of the alternatives are obtained. n is the number of criteria and m is the number of alternatives.

TOPSIS Method
TOPSIS is an MCDM method developed by Yoon (1980) and Hwang and Yoon (1981) for ranking alternatives. This method uses Euclidean distance to rank alternatives. The proximity of alternatives to the positive ideal solution and their distance from the negative ideal solution are the basis of this method (Zhang et al., 2011). The implementation steps are as follows (Tzeng & Huang, 2011):
Step 1: Creating the Decision Matrix
The decision matrix is created with n alternatives and m criteria as follows, where x is the set of performance ratings and w is the weight of the criteria.

Step 2: Normalization of the Decision Matrix
At this stage, the decision-making matrix is normalized. For this, the following equations apply:

For the utility criterion;

For the cost criterion;

Step 3: Obtaining the Normalized Decision Matrix with Weights
The weighted normalized decision matrix is obtained by the following equation:

Step 4: Determination of Positive (PIS) and Negative Ideal Point (NIS)
The following equation is used to determine the positive ideal point.


The following equation is used to determine the negative ideal point.


J1 and J2 show the benefit and cost criteria.
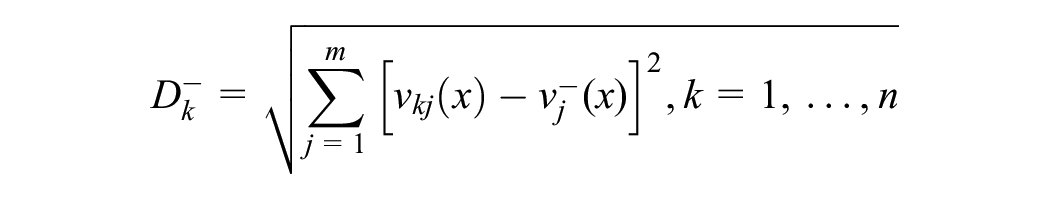
Step 5: Calculating PIS and NIS Discrimination Between Alternatives
The PIS and NIS discrimination values between alternatives are measured using Euclidean distance. The following equation is used for this purpose:

Similarities to PIS are obtained with the following equation:

Step 6: Ranking of Alternatives
The value of
Integration of Rankings: Borda Function
In this study, the Borda function was used to obtain the final ranking value from nine different rankings obtained for the research performance of countries. The Borda function is the fairest method when a single value needs to be obtained from different rankings (Dummett, 1998). By applying this method, a Borda score is obtained for each ranking. This score indicates the superiority of each alternative over the other alternatives. The Borda score is determined by the following formula (Chen et al., 2014):

Here
Research Performance Criteria
One of the most important decisions in measuring research performance is to decide which criteria to use. Research performance has characteristics such as productivity, quality, and impact. Different measurement criteria emphasize different aspects of research performance (Auranen & Nieminen, 2010). However, the measurement of research performance relies on publication outputs as a measure of productivity, citations as a measure of impact, and in some cases, quality of work assessments and the reputation indicators of researchers (Bazeley, 2010).
There is no clear and agreed set of indicators by which research performance is measured. However, research performance is generally analyzed in two dimensions. The first is productivity, which depends on publication outputs. The second is impact, which is an indicator of the quality of publications. When studies on research performance are examined, the number of publications as a measure of productivity (Bansal et al., 2022; Chang et al., 2020; Holliday et al., 2014), the ratio of publications in top publications (Craig et al, 2021), the number of publications per academic staff (Johnes & Yu, 2008), the number of publications in Scientific Journal Ranking journals (Saxena et al., 2022), h index (Lai et al., 2022; Praus, 2018; Sadeghi-Bazargani et al, 2019), g index (Ke et al., 2016), i10 index (Cvetanovich et al., 2016; Susarla et al., 2015), and the ratio of publications to total publications (Abramo et al., 2008) are all used. The number of citations (Aldieri et al., 2020; Ermatita et al., 2022), i10 index (Susarla et al., 2015), number of citations per publication, h index, and g index (Ding et al., 2020; Tahira et al., 2018) are used as indicators of impact. In addition to these indicators, the opinions of researchers and academic administrators (Izuagbe, 2021; Law & Chon, 2007; Martin-Sardesai et al., 2017; Quoc et al., 2021; Ryan, 2014) and research grants (Goldstein, 2011; Marisha et al., 2017; Valadkhani & Ville, 2010) were used.
Quantity is important measuring research performance. However, quality is as important as quantity. Therefore, evaluating quantitative and qualitative criteria together is important in measuring performance (Kao & Pao, 2009). For example, the number of publications should not be used to measure performance without considering the impact of the publications. The number of citations is not a reliable criterion without their impact. The number of citations per article is a reasonable criterion, but it is not recommended as a performance criterion because it ignores the size of the alternatives examined and thus creates a bias toward large units (Abdul-Majeed et al., 2021).
Considering all the studies in the literature, in this study, the research performance of countries was analyzed with a total of six criteria, three in the productivity dimension and three in the impact dimension, which comprise important components of research performance. The main productivity measures used are the following: (1) number of documents, (2) number of documents in the top 1%, and (3) number of documents in Q1 journals. However, these criteria may be affected by the size indicators of the units, such as the population of the country and the number of researchers, because larger units can produce more output. Comparing the performance between units by ignoring size may lead to biassed results. The contribution of a performance assessment that ignores size is that it only reveals the most influential countries that contribute the most to science. In light of these considerations, in this study, the productivity outputs of countries are divided into three sets of criteria. First, to analyse the performance of countries with raw data, the size of the countries is ignored and the following set of criteria is used:
number of documents (ND)
number of documents in top 1% (ND%1)
number of documents in Q1 journals (NDQ1)
Secondly, population was taken as a measure of the size of countries and the following criteria were used by normalizing the raw data to population:
number of documents per population (ND_P)
number of documents in top 1% per population (ND%1_P)
number of documents in Q1 journals per population (NDQ1_P)
Third, gross domestic product (GDP) was taken as a measure of the size of countries and the raw data were normalized to GDP and the following criteria were used:
number of documents per GDP (ND_GDP)
number of documents in top 1% per GDP (ND%1_GDP)
number of documents in Q1 journals per GDP (NDQ1_GDP)
The first set of criteria was used to determine the weights of the criteria. This is because these criteria are the main indicators of productivity. These criteria are used in all fields of science and form the basis for the weighting of criteria. The data in the second and third sets were included in the analysis when ranking with the criteria in the first set.
In this study, three different criteria were used as impact indicators. Each of these indicators is independent of unit size and is normalized values. For this reason, the normalization to population and GDP applied to productivity criteria is not applied here. The impact indicators are as follows:
Impact Relative to World (IRW): Demonstrates the impact of publication based on global research impact. The world average is always equal to 1. If this value is greater than 1, it means that the country under study performs above the world average (Incites, 2022).
Category Normalized Citation Impact (CNCI): It is an impact indicator calculated by dividing the citation value of publications with the same publication year, publication type, and subject area by the expected citation value (Incites, 2022).
Average Percentile (AP): The AP value is a normalized impact indicator that shows how a publication performs compared to peer publications in its field, publication type, and year. This value is determined by creating a citation frequency distribution of all publications in the field, publication type, and year, and calculating the percentage of each publication (Incites, 2022).
Table 1 presents the descriptive statistics of the productivity and impact criteria of the countries.
Descriptive Statistics on Research Performance Criteria of Countries.

Data Collection
This study focuses on the research performance of OECD countries over the last ten years. One of the reasons for this is to reveal the recent trends and developments in the research performance of the countries during this period. In this way, a current view of the research performance of the countries has been obtained. Second, in today’s rapidly increasing scientific knowledge, it is not possible for research performance to remain stable. Analyzing the rapidly evolving research environment with old data may not accurately reflect the current situation. Third, this research provides important information for policy makers to develop evidence-based policies. Research results from a recent period provide more accurate evidence for this purpose.
Data on the criteria used to measure research performance were obtained from the InCites Benchmarking and Analytics database (January 16, 2023). Performance data covers reviews and review articles for 38 OECD countries for 2013 to 2022. Documents other than these types of publications were excluded from the dataset.
Data on the population of countries were nine-year data from the World Bank (2022b), covering 2013 to 2021. Because the World Bank population data does not include 2022, population data for 2022 is excluded from the analysis.
The data on the GDP of countries are nine-year data from the World Bank (2022a) covering 2013 to 2021. As 2022 GDP data are not available, data for this year are not considered.
Data on the development levels of countries are based on the Human Development Report prepared by the United Nations Development Programme (UNDP, 2023). While this report was published every ten years from 1990 to 2010, it was published in 2015 and 2018 after 2010 and started to be published every year after 2018. Data on the level of development of countries were selected for the period 2010–2021.
R&D data of countries are taken from the OECD database (OECD, 2022). The most recent data for 2020. For this reason, the dataset was selected to cover 2013 to 2020. As these data will be used for the correlation analysis, 33 countries with complete data were analyzed and data from 5 countries were excluded from the correlation analysis.
In the correlation analysis, two types of data on countries’ collaboration were used. First, the percentage of international collaboration and second, the percentage of domestic collaboration were used. These data are from the InCites Benchmarking and Analytics database (as of January 16, 2023).
Among the data used in this study, data on research performance, population data, GDP data, and data on the development levels of countries are complete for all countries and all years. The R&D data of the countries end in 2020, which is the most recent data year. However, some countries have been missing R&D data for some years. To overcome this problem, only 33 countries with complete data sets for all years were included in the correlation analysis.
Results
Findings Regarding the Weights of the Criteria
To answer the first research question, three MCDM methods were used to objectively weight the productivity criteria. The weighting results of the criteria are given in Figure 2. Figure 2 shows that the CRITIC method gave the highest weight to ND 1%. The lowest weight belongs to NDQ1. In the MEREC method, NDQ1 has the highest weight, while ND has the lowest weight. In the Entropy method, all three criteria have close weight values. When the weighting results of the three methods are analyzed together, it is seen that ND%1 is the most important criterion, while ND is the least important criterion.

Weight values of productivity criteria.
The weight values of the impact criteria weighted by the three different MCDM methods are given in Figure 3. According to the findings, there are differences between the weight values of the three methods. The AP criterion has the highest weight in the CRITIC method, whereas the IRW criterion has the highest weight in the MEREC and Entropy methods. When the results of the three methods are evaluated together, the IRW criterion is the most important.

Weight values of impact criteria.
Findings on Research Performance of Countries
After the criteria weights to be used in the measurement of research performance were determined by three different MCDM methods, the values obtained from these methods were analyzed separately by ARAS, MABAC, and TOPSIS methods, and the research performance rankings of the countries were obtained. The analyses were conducted first with raw data, then with data normalized to population, and finally with data normalized to GDP.
Table 2 shows the ranking values of countries in terms of research performance because of the analyses conducted using three different weighting and ranking methods. In the analysis made with raw data, the country with the highest research performance was the USA, followed by the UK, Germany, Australia, and the Netherlands. These countries have the highest research performance when various size indicators are neglected.
Research Performance Rankings of Countries.

Note. ac = ARAS-CRITIC; am = ARAS-MEREC; ae = ARAS-Entropy; mc = MABAC-CRITIC; mm = MABAC-MEREC; me = MABAC-Entropy; tc = TOPSIS-CRITIC; tm = TOPSIS-MEREC; te = TOPSIS-Entropy; tbs = Total Borda Score; fr = Final Rank; 1 = Results with raw data; 2 = Results with values normalized to population; 3 = Results with values normalized GDP. Bold values indicate the combined ranking values from multiple methods.
The second analysis for measuring research performance is based on the population of countries. Because of the analysis made with data normalized according to the population size of the countries, the research performance results of the countries change. According to this analysis, Switzerland has the highest research performance, followed by Iceland, Denmark, Sweden, and the Netherlands.
The final analysis for the measurement of research performance was conducted with data normalized by the GDP of the countries. According to this analysis, the country with the highest research performance is Estonia, followed by Iceland, Denmark, Netherlands, and Slovenia.
When the three findings on research performance are evaluated together, the Netherlands draws attention. The Netherlands is the only country ranked in the top five in all three assessments. While USA had the highest performance in the first analysis, its ranking dropped considerably in the other analyses. Meanwhile, Mexico and Colombia are in the bottom five in all three rankings. Countries that ranked high in the first analysis showed further declines in the second and third analyses. However, the ranking of countries that were at the bottom in the first analysis did not change much in the other analyses. This suggests that the advantage of normalizing population and GDP does not apply to poorly ranked countries.
Factors Related to Research Performance
Table 3 shows the results of Spearman’s rank correlation analysis conducted to determine whether there is a relationship between different rankings of countries’ research performance and the level of development, R&D expenditures, international collaboration rate, and domestic collaboration rate of the country.
Correlation Analysis Results of Factors Related to Research Performance.

Note. RR = ranking with raw data; RP = ranking with normalized to population; RGDP = ranking with normalized to GDP; R&D = R&D expenditures; DI =Development Index, IC = percentage of international collaboration; DC = percentage of domestic collaboration. Values in parenthesis represent the significance value.
**Correlation is significant at the.01 level (two-tailed), *Correlation is significant at the.05 level (two-tailed).
When the results of the correlation analysis are analyzed, the R R variable has a moderate positive and significant relationship with RP and a low positive and significant relationship with RGDP. The R&D variable has a moderate negative relationship with R R , whereas it has no significant relationship with R P and RGDP. The DI variable has a high negative correlation with R R and R P , while it has a moderate negative correlation with RGDP. The IC variable does not have a significant relationship with R R , whereas it has a moderate negative relationship with RP and a low negative relationship with RGDP. The DC variable does not have a significant relationship with RR, whereas it has a low positive relationship with R P and RGDP.
Discussion
This study aimed to analyze the research performance of 38 OECD countries using the MCDM methods. For this purpose, three research questions were proposed: (1) What are the weights of the criteria for research performance? (2) What are the research performance rankings of countries? (3) Is there a relationship between research performance ranking and the level of development, R&D expenditures, international collaboration rate, and domestic collaboration rate of the country?
In this study, the research performance of countries was analyzed using multiple MCDM methods. The results of the weighting of the criteria revealed that publications in Q1 journals and publications in the top 1% are an important and distinguishing criterion in the research performance of countries. The number of publications has a lower weight than the other two criteria. An important implication of this finding is that countries should focus on high quality productivity rather than on the number of publications to increase their research performance.
In the measurement of research performance, the data were first analyzed without normalization. The combined results of different MCDM methods revealed that USA, UK, Germany, Australia, and Netherlands are the countries with the highest performance. This result is independent of the various sizes of countries. The reason behind the high performance of these countries is the high number of publications and the higher quality of publications compared with other countries. In addition, the number of scientific journals affects productivity (Basu, 2010). The high performance of the USA, in particular, may be related to the number of USA-based journals indexed in the WOS. Moreover, as shown in this study, countries that engage in international collaborations are more productive (Aksnes, 2003; Goldfinch et al., 2003; Lee & Bozeman, 2005; Wagner et al., 2019). The reason behind the high research performance of these countries is their high level of international research collaboration.
In the performance analysis with data normalized according to the population and GDP of the countries, the performance ranking of the countries changed significantly. Switzerland, which ranked seventh in the first analysis, became the highest performing country when normalized by population. Estonia, which ranked 15th in the first analysis, ranked first when normalized to GDP. The main reason for these changes is that these analyses have different perspectives. Analyses based on raw data ignore the size of the countries. Therefore, the first analysis may reveal a result in favor of countries with more researchers or universities. In the analysis with data normalized to population, the reason for the high performance of high-performing countries may be the high number of researchers compared to the total population, thus contributing to productivity. World Bank data on the ratio of researchers in R&D to the total population confirms this finding. All the top 10 countries in the analysis normalized to population in this study are among the top 18 countries with the highest ratio of researchers in R&D to total population (World Bank, 2022c).
The results of the correlation analysis of the factors associated with research performance revealed interesting findings. There is a positive correlation between the ranking results based on raw data and those normalized to population and normalized to GDP. However, the correlation between the raw data and the ranking normalized to population is stronger than the correlation based on GDP. This suggests that country population is a better criterion to for normalizing unit sizes. The second important result is that as R&D expenditures increase, the performance of countries also increases. This result supports the research of Gulbrandsen and Smeby (2005), Solarin and Yen (2016), Lee (2021), Teitel (1994), Meo et al. (2013), and Uyar et al. (2022). Another important result obtained from the correlation analysis is that research performance increases with the increase in the level of development of countries. Developed countries have higher R&D expenditures. Research has shown a positive relationship between R&D expenditures and publication output (Gonzalez-Brambila et al., 2016; Man et al., 2004). In addition, studies have confirmed the relationship between economic wealth and scientific productivity (Cimini et al., 2014; Docampo & Bessoule, 2019; Mueller, 2016; Rahman & Fukui, 2003). Another important result obtained from the correlation analysis is that research performance decreases with increasing domestic collaboration, whereas research performance increases with increasing international collaboration. This result supports the results of other studies in the literature. The positive correlation between international collaboration and scientific productivity (Lee & Bozeman, 2005), the positive effect of collaboration between researchers from different countries on the number of citations (Aksnes, 2003; Lancho Barrantes et al., 2012), and the negative correlation between the increase in the number of domestic authors and the number of citations (Goldfinch et al., 2003) have been revealed.
In this study, more than one MCDM method was used to weight the criteria. The main reason for this is that MCDM methods have different theoretical and statistical backgrounds. The different criteria weights obtained from the methods in this study justify this decision. In addition, different weighting methods add methodological diversity to the research. Methodological diversity gives countries the opportunity to take advantage of the diversity of methods without being tied to a single method for evaluating research performance. The same applies to the ranking methods. Although the aim of the MCDM methods used for ranking in this study is to rank countries in terms of research performance, each method has a different theoretical background. The fact that the rankings of countries’ research performance vary across methods confirms this idea.
The criteria sets used in this research focus on two important components: research performance-productivity and publication impact. However, research performance can be measured using different criteria. Different measurement criteria emphasize different aspects of performance (Auranen & Nieminen, 2010).
In this research, different MCDM methods were used to weight the criteria; these methods are objective and are not based on expert opinion. Measuring performance based on subjective judgments in determining research performance may cause the results to be questioned (Kao & Pao, 2009). Despite this criticism, subjective MCDM methods based on expert opinion can be used to weight and rank criteria. In addition, a new performance measurement can be made by examining research performance using hybrid MCDM methods that use both objective and subjective methods. In recent years, MCDM methods and approaches have received considerable attention from researchers (Mardani et al., 2015). This interest has led to the emergence of different MCDM methods. Therefore, the methods used in this research are not unique. Apart from these methods, the performance results can be compared using different methods.
This study has some limitations. Research performance data are based on the WOS database alone. Research performance can be measured using databases other than the WOS database or by combining data from multiple databases. Although there are comprehensive other than the WOS database, this database is considered to be a sufficiently comprehensive database for international performance measurement (Auranen & Nieminen, 2010). The second limitation of the study is that the data used in this research are from the last 10 years. However, this period was chosen by the researcher to examine the current research performance of the countries. When using data based on a longer time period, changes in the research performance of countries can be observed. Third, criteria weights may change when the MCDM methods used for weighting criteria change or when different data sets for different universities, countries, or researchers are used. In addition, the inclusion or exclusion of countries other than the 38 countries examined in this study may change the rankings. However, despite these limitations, it can be said that the comparative research performance of countries using different methods will give an idea to researchers and the countries under study. In future research, the performance of countries can be evaluated with different research performance criteria and compared with the results of this study.
Conclusion
Research performance is important because of issues such as the distribution of funds, the productivity and accountability of higher education institutions, the determination of government grants, and institutional and national reputation. Due to this importance, studies on research performance based on researchers, academic units, universities, and countries have gained momentum in recent years. This study aimed to analyse the research performance of 38 OECD countries over the last 10 years using MCDM methods. To ensure methodological diversity and take advantage of methods with different theoretical backgrounds, several MCDM methods were used to assess the research performance of countries. The findings revealed that the number of publications in the top 1% and the IRW impact indicator is important and distinguishing criteria in the research performance of countries. In the analysis with raw data, USA, UK, Germany, Australia, and the Netherlands are the countries with the highest performance. When the data are normalized to population, Switzerland, Iceland, Denmark, Sweden, and the Netherlands show the highest performance. When the data are normalized to GDP, Estonia, Iceland, Denmark, the Netherlands, and Slovenia are the countries with the highest performance. The findings of the study show that as R&D expenditures, countries’ levels of development, and international collaboration increase, research performance also increases. However, with the increase in domestic collaboration, there has been a decrease in research performance. In addition, this study shows how to use MCDM, a part of operations research, to measure research performance using various objective methods.
Footnotes
Declaration of Conflicting Interests
The author declared no potential conflicts of interest with respect to the research, authorship, and/or publication of this article.
Funding
The author received no financial support for the research, authorship, and/or publication of this article.
Data Availability Statement
The data used to support the findings of this study are available from the corresponding author upon request.