
Abstract
As computer-based testing becomes more prevalent, the attention paid to response time (RT) in assessment practice and psychometric research correspondingly increases. This study explores the rate of Type I error in detecting preknowledge cheating behaviors, the power of the Kullback-Leibler (KL) divergence measure, and the L person fit statistic under various conditions by modeling patterns of response accuracy (RA) and RT using a joint hierarchical model. Four design factors were manipulated: test length, the difficulty level of compromised items, the ratio of compromised items, and variations in the RTs for these compromised items. The results indicate that the KL measure consistently exhibits higher power and Type I error rates than the person fit statistics
Plain language summary
This study aims to reveal the rate of Type I error in the detection of preknowledge cheating behaviors, and the rate of power of response time based on Kullback–Leibler divergence (KL) measure, and L person fit statistic under different conditions via modeling patterns of response accuracy (RA) and response time (RT), using a joint hierarchical model. 200 data sets were generated with 50 iterations that item responses were modeled with three parameter logistic model and RTs were modeled with the log-normal RT model under the conditions of test length and difficulty level of the compromised items for obtained means of Type I error rate of methods. In order to obtain the means power rate of the methods, 1,800 data sets were generated with 50 iterations under the conditions of test length, the difficulty level of the compromised items, the ratio of compromised items, changing in RT of the compromised items. Gibbs sampling algorithm is used as a Monte Carlo Markov Chain (MCMC) approach in estimating model parameters for each data set. In the cheating scenario, where item preknowledge examinees were selected from those with low ability level, the rate of fraudulent data was created as 5% of the 1,000 sample size. As a result of the study, it was found that the KL measure has a high power and Type I error rate mean values than person fit statistics L and L(l^t ) for RA and RT patterns under all conditions. In addition, it is seen that the KL measure for RA and RT patterns show the highest power rate mean values at medium test length, and when the RTs of the compromised items which have difficult and medium difficulty level fixed at 20 s and the ratio of compromised items is high.
Computer-based large-scale, in-class speed-tested applications have become widespread. In computer-based tests, the responses of examinees to test items also provide more detailed information, such as the moment of seeing the test item on the computer screen, time information, such as the solving time, and the moment of viewing response to the item. Thus, in computer-based testing (CBT), the examinee's recorded time information across the test items is used to support or define aberrant testing behaviors (such as preknowledge cheating, answer copying, and rapid guessing) and aberrant response patterns. In recent studies, in computerized adaptive and computer-based test applications, measuring examinees’ response times (RTs) to items is considered an important variable in determining examinees who have item preknowledge, are copying answers, and are rapid guessing (Bolsinova et al., 2017; Boughton et al., 2017; Cizek & Wollack, 2017; De Boeck et al., 2017; Eckerly et al., 2018; Fox & Marianti, 2016, 2017; Gorney & Wollack, 2022; Guo et al., 2016; Kasli & Zopluoglu, 2018; Kasli et al., 2023; Lee & Jia, 2014; Lee & Wollack, 2017; Lee, 2018; Lu et al., 2020; Man & Harring, 2021; Man et al., 2018; Man, Harring, Jiao et al., 2019; Marianti et al., 2014; Meng et al., 2015; Qian et al., 2016; Ranger et al., 2021; Sinharay & Johnson, 2020; Toton & Maynes, 2019; Ulitzsch, 2019; van der Linden & Guo, 2008; van der Linden & van Krimpen-Stoop, 2003; van der Linden et al., 2010; van der Linden, 2006; van Rijn & Ali, 2017; Wang et al., 2018; Wise & Kong, 2005; Zhan et al., 2018; Zhan et al., 2021). Thus, various psychometric models for RTs have been developed to investigate topics such as speed–accuracy relationships, speed tests, testing strategies (e.g., rapid guessing behavior), and subgroup differences (Fox et al., 2007; Klein Entink et al., 2009; Meijer & Sotaridona, 2006; van der Linden & Guo, 2008; van der Linden, 2006, 2007; Wise & DeMars, 2006; Wise & Kong, 2005).
Several response time (RT) models have been developed, such as loglinear RT model, effective RT model, Bayesian lognormal RT model, a model that combines a RT model with an Item Response Theory (IRT) model (e.g., 1PL, 2PL, 3PL) model for purposes of simultaneously modeling responses and RTs, and the mixture model (Lee & Wollack, 2017; Meijer & Sotaridona, 2006; van der Linden et al., 1999; van der Linden et al., 2010; van der Linden, 2006, 2007; von Davier & Rost, 2006; Wang & Xu, 2015; Wang et al., 2018; Zhan et al., 2018). The RTs do not contain any information about the examinees’ abilities. Thus, the integration of RTs with item responses will contribute to the investigation of response behaviors. Additionally, the integration of RTs with item responses may help determine the type of aberrant response behavior (Lee, 2018). A joint model in which the response accuracy (RA) and RT data are modeled using a hierarchical latent variable model called H-IRTRT has been proposed (van der Linden, 2007). At the first level, the responses and RTs are modeled using a model that associates the distribution of the responses with the examinees’ latent ability and the distribution of the RTs with the examinees’ latent speed. The two models are not linked but are conditional on ability and speed and that the responses and RTs are independent (Fox & Marianti, 2017; van der Linden, 2011). On the second level model, population of the potential test takers distributions are defined for the latent variables speed and ability, and for the item parameters in the RT model and the IRT model (Lee, 2018).The covariance matrix for the item parameters defines the correlation between the parameters in the first stage of modeling and the item parameters. Thus, the covariance structures defined in both stages of modeling reveal the relationship between item responses and RTs (Fox & Marianti, 2017; van der Linden, 2009).
Several studies have applied H-IRTRT (Bolsinova et al., 2017; Boughton et al., 2017; Fox & Marianti, 2016, 2017; Fox et al.2007; Klein Entink et al., 2009; Lee & Wollack, 2020; Man & Harring, 2021; Man et al., 2018; Man, Harring, Jiao et al., 2019; Molenaar et al., 2015a, 2015b, 2016; Qian et al., 2016; Ranger et al., 2020, 2021; Sinharay & Johnson 2020; van der Linden & Guo, 2008; van Rijn & Ali, 2017; Wang & Xu, 2015; Wang et al., 2013, 2018; Zhan et al., 2021). Bayesian person-fit approach is used for detecting aberrant testing behavior based on latent-variable models and both responses and RTs. The standardized residuals, mixture models, data mining methods, and the
A Bayesian person-fit approach was used to detect preknowledge cheating (Fox & Marianti, 2017; Man et al., 2018). Fox and Marianti (2017) investigated the performance of
Purpose of the Study
When related studies are examined, it can be observed that few have investigated aberrant testing behaviors via H-IRTRT modeling. Additionally, because the KL measure is a non-parametric measure that can evaluate the RA and RT patterns of the test-taker directly from the test scores, it appears that calculating the KL measure values is an effective approach for evaluating the test-taking behavior of examinees (Man et al., 2018). Studies have shown that person-fit statistics, which are based on the log-likelihood of RA and RT patterns, are more powerful than other person-fit statistics in detecting aberrant behavior in educational testing (Dimitrov & Smith, 2006; Karabatsos, 2003). Moreover, to our knowledge, no study has been conducted in which
Research Question
What are the Type I error and power rates of KL measure, and
Sub-questions
Following are the sub-questions:
What is the main and common effect of test length and the difficulty level of compromised items on the Type I error rates of KL measure, and person fit statistics
What is the main and common effect of test length, the difficulty level, the ratio and changing in RTs of compromised items on the power rates of KL measure, and person fit statistics
Method
In Table 1, the variables and changing levels of research are presented, taking into account studies in the relevant literature.
Simulation Design Conditions and Levels.

fixed variable
The sample size was changed to 500, 1,000, 10,000, and 50,000, and the test length was changed to 15, 20, 25, 30, and 50 in related studies, in which preknowledge cheating was determined through RT models (Fox & Marianti, 2017; Lee, 2018; Man et al., 2018; Marianti et al., 2014; Shu et al., 2013; Sinharay, 2020; van der Linden & Guo, 2008; van der Linden & van Krimpen-Stoop, 2003). In this study, the sample size factor did not change, and was fixed at 1,000 because of the long iterations of the Markov Chain Monte Carlo (MCMC) algorithm, in which Bayesian estimations of the joint model parameters were performed. In addition, in the cheating scenario, examinees who had item preknowledge were selected from those with low ability levels, and the rate of fraudulent data was created as 5% of the 1,000-sample size who were examined in the methods of performance of preknowledge cheating to reduce parameter estimation errors during the analysis. In the relevant literature, test length is seen as an important factor in determining preknowledge of cheating. As a result of the increase in the probability of observing cheating behavior as the number of items in the test increases, the length variable was changed to 15 and 50 to be short and medium test lengths, respectively.
When the studies on answer copying are examined, it is observed that the difficulty level of the compromised items is considered an important factor, but it is seen that the difficulty level of the compromised items does not change when determining preknowledge cheating by H-IRTRT. In his study examining the relationship between item statistics and RTs, Altuner (2019) stated that item RTs vary according to the difficulty level of the items. Thus, in this study, to determine preknowledge cheating, the difficulty level of the compromised items was changed to medium or difficult. Sunbul and Yormaz (2018) varied the difficulty levels of the items in the test, and discussed the intervals such as (−2.50–0.00) for easy items and (0.01–2.50) for difficult items, for the b parameter. In this study, intervals such as (−1.50–1.50) for items of medium difficulty and intervals such as (1.51–3.00) for difficult items were considered for the b parameter.
The ratio of the compromised items is an important factor because it affects the performance of person-fit statistics for the RA and RT patterns. Marianti et al. (2014) varied the number of aberrant responses by 5, 10, and 20%. Fox and Marianti (2017) varied the number of aberrant responses by 10% and %20. Lee (2018) varied the ratio of compromised items at three levels: 20% (low), 40% (medium) and 60% (high) of the total test items. Considering the varying ratios of compromised items in related studies, the ratios of the compromised items adopted were 20% (low), 40% (medium), and 60% (high) of the total test items in this study.
When designing a simulation study, one of the major decisions is to simulate the difference in RT between examinees without item preknowledge and those with item preknowledge. Meijer and Sotaridona (2006) varied the RTs of compromised items to reduce RT by half and a quarter. Van der Linden and Guo (2008) fixed the RT of compromised items to 10, 20, and 30 s. Fox and Marianti (2017) simulated aberrant RTs from a lognormal distribution with a mean equal to the average RTs and a standard deviation three times the mean standard deviation of the RTs. Lee (2018) drew the RTs of compromised items from a uniform distribution between 20 and 30 s. Man et al. (2018) simulated the RTs of compromised items by drawing from a uniform distribution in the range of 10 to 15 seconds for preknowledge cheating. Kasli and Kasli and Zopluoglu (2018) concluded that preknowledge may increase the latent speed parameter for examinees by approximately 0.45 standard deviation. In this study, the RTs of the compromised items were simulated by drawing randomly from a uniform distribution in the range of 10 to 15 seconds (U (10,15)) and fixed at 20 and 30 s. Considering the observed RTs of the examinees with preknowledge from a large-scale assessment, these time range intervals where the time express elapsed between remembering the compromised item and reacting was chosen, as stated by Qian et al. (2016) and van der Linden and Guo (2008).
Data Simulation
This study manipulated four design factors: test length (15 and 50 items), difficulty level of compromised items (medium and high), ratio of compromised items (20, 40, and 60%), and variations in the RTs for these compromised itemsvariations in the RTs for these compromised itemsvariations in the RTs for these compromised items (U (10,15), fixed at 20 s, and fixed at 30 s). The four factors were fully crossed, resulting in 36 conditions. Fifty iterations were simulated for each condition. In line with the purpose of the study, 200 datasets were generated with 50 iterations, which were modeled with 3PLM, and RTs were modeled with the Bayesian lognormal RT model under the conditions of test length and difficulty level of the compromised items for the obtained means of the Type I error rate of the methods. To obtain the mean power rate of the methods, 1,800 datasets were generated with 50 replicates under the conditions of test length, difficulty level of the compromised items, ratio of compromised items, and change in RTs of the compromised items. Each dataset consisted of simulated RA and RT data for 15 and 50 items of 1,000 examinees according to the H-IRTRT model. The H-IRTRT model parameters were simulated using the prior distributions for each simulated dataset. The item parameters were simulated from the multivariate prior with a mean vector of
MCMC Estimation
The Gibbs sampling algorithm developed by Fox et al. (2007) and Klein Entink et al. (2009) in the LNIRT package program was used as an MCMC approach to estimate the RA and RT patterns using joint hierarchical model parameters for each dataset. Parameter estimates were obtained as the posterior means of 10,000 iterations after the initial 1,000 iterations of the burn-in period. Studies that used the Gibbs sampling algorithm as an MCMC approach to estimate the model parameters (Fox & Marianti, 2017; Marianti et al., 2014; Qian et al., 2016) were considered to determine the initial value of 10,000. Before investigating the convergence of the model parameters, 10 data files were randomly selected to check whether the data of 1,000 examinees, produced in accordance with the 3PLM consisting of 15 items, were unidimensional. The dimensionality analysis of the data in the selected files were examined using the “sirt” (Robitzsch, 2020) and “paran” (Dinno, 2018) packages in the R software. The convergence of the model parameters (item difficulty, item discrimination, time discrimination, and time intensity) for 10,000 MCMC iterations for 15 test items was monitored by visual inspection of trace and posterior probability density plots and autocorrelation graphs. The Geweke convergence test was used for convergence diagnostics. Convergence investigations were conducted using the “R2OpenBUGS” (Thomas, 2020) and “coda” (Plummer et al., 2020) packages in the R software. When the trace plots of the model parameters were examined, it was observed that there were no extreme fluctuations; that is, the chain reached a posterior distribution quickly, and were strong throughout the iterations, each parameter converged, and the predicted values of the estimations in the parameters gradually stagnated and did not take extreme values. When the posterior probability density plots for the model parameters were examined, it was observed that the distributions were normal. Thus, the chains converge, and a posterior distribution is reached. In a Markov chain, the values obtained by simulation are not independent of each other, and the relationship between these values is measured by autocorrelation (Hosmer & Lemeshow, 2013). When the autocorrelation graphs for the model parameters were examined, the autocorrelation values generally approached zero; that is, there was no relationship between the parameter values, and thus, convergence was achieved. The Geweke diagnostic test examines convergence in two-way Markov chains based on the Z-test statistic, which determines whether the mean estimates converge by comparing the means of the previous 10% and the next 50% parts of the Markov chain. In the model, since the hypothesis tests were set at α = .05 level, it is seen that the Geweke convergence test statistic values of all parameters were less than 1.96, thus convergence was achieved (Santos et al., 2009).
Cheating Scenario
In the cheating scenario, the abilities of 1,000 examinees obtained from the multivariate normal distribution were drawn for each generated data file. In the cheating scenario, in which item preknowledge examinees were selected from those with low ability levels, the rate of fraudulent data was set at 5% of the 1,000 sample size. The RTs for the medium- and high-difficulty level items of the examinees with item preknowledge changed. After this process, the responses of the examinees who had item preknowledge of items whose RTs were changed were corrected. In this study, fraudulent data were created with the simulation codes written by the researcher in the R software to observe the effect of the changing factors and their levels on the performance of the methods of preknowledge cheating. The codes were shared in an additional file.
Type I Error and Power Analysis
In this study, the person-fit statistics
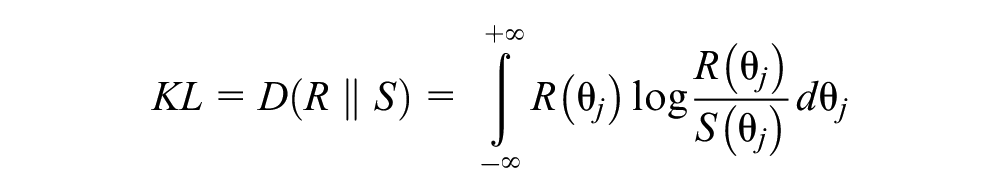
Large values of the KL measure may indicate copying or item preknowledge (Kullback & Leibler, 1951). Therefore, the KL measure has been used to detect answer copying and preknowledge cheating when we have prior knowledge of the examinees’ abilities (Balta et al., 2019; Belov, 2013, 2014; Cizek & Wollack, 2017; Man et al., 2018; Ucar & Dogan, 2020).
The person-fit statistic

where

I value of
A person-fit statistic, based on the likelihood of RT patterns derived from a model for the logarithm of RTs, was introduced (Marianti et al., 2014). Probability of the response pattern (
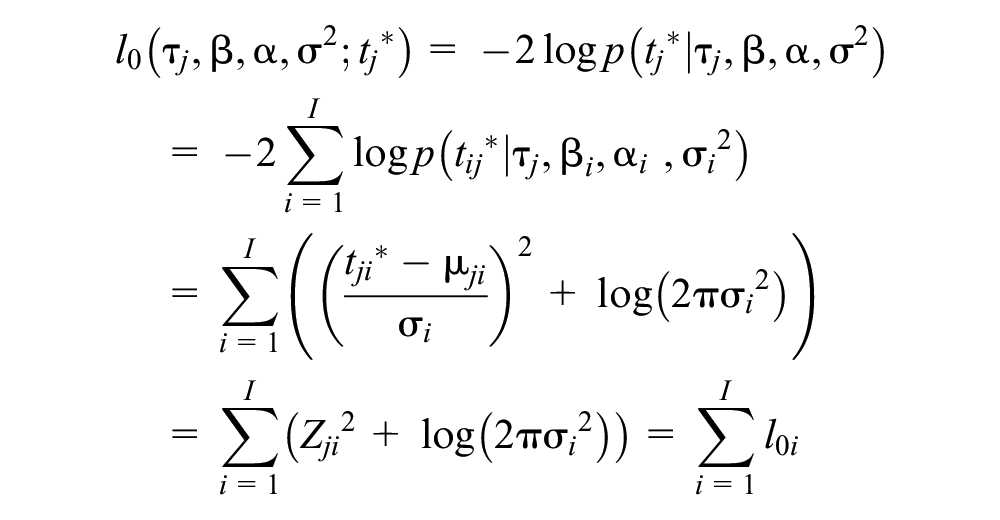
where

where

The posterior probability that the RT pattern of test taker j will be flagged is given by

where in MCMC iteration m,
In order to obtain the value of the KL measure function and Bayesian posterior probability values of person fit statistics
We obtained the KL measure values for the examinees and used the cutoff score to identify whether they had item preknowledge. The receiver operating characteristic (ROC) curve method was used to determine the cutoff points for the KL measure function values. The KL method’s performance in detecting copiers was higher when the cutoff scores by evaluating the performance of the classification rule of the ROC analysis according to the minimum score p-value approach, and the Youden index displayed a balancing approach (Krzanowski & Hand, 2009; Ucar & Dogan, 2021). Thus, the cutoff scores for the KL measure function values were calculated using the Youden Index. To obtain cut scores at an ‘=0.05, Bayesian significance level using the Youden Index, we employed the “OptimalCutpoints” package (Raton-Lopez et al., 2014) in the R software.
To obtain the Type I error rate mean values of the KL measure for RA, the posterior probability values obtained from the KL measure function and person fit statistics
Findings
Type I Error Rates of Methods
The main effects of methods on Type I error rate mean values of the test length and the difficulty level of the compromised items factors are shown using tables. Table 2 shows the Type I error rate mean values of the KL measure and person-fit statistics
Type I Error Rate Mean Values of KL Measure and Person Fit Statistics

The common effects of methods on Type I error and rate mean values of the test length and the difficulty level of the compromised items factors are shown using graphs. Figure 1 shows that the conditions’ common effects for Type I error rate mean values of KL and person fit statistics

The conditions’ common effects for Type I error rate mean values of KL measure and person fit statistics
Figure 2 shows that the conditions’ common effects for Type I error rate mean values of KL and person fit statistics

The conditions’ common effects for Type I error rate mean values of KL measure and person fit statistics
The KL measure had a higher Type I error rate mean value than the person-fit statistic
Power Rates of Methods
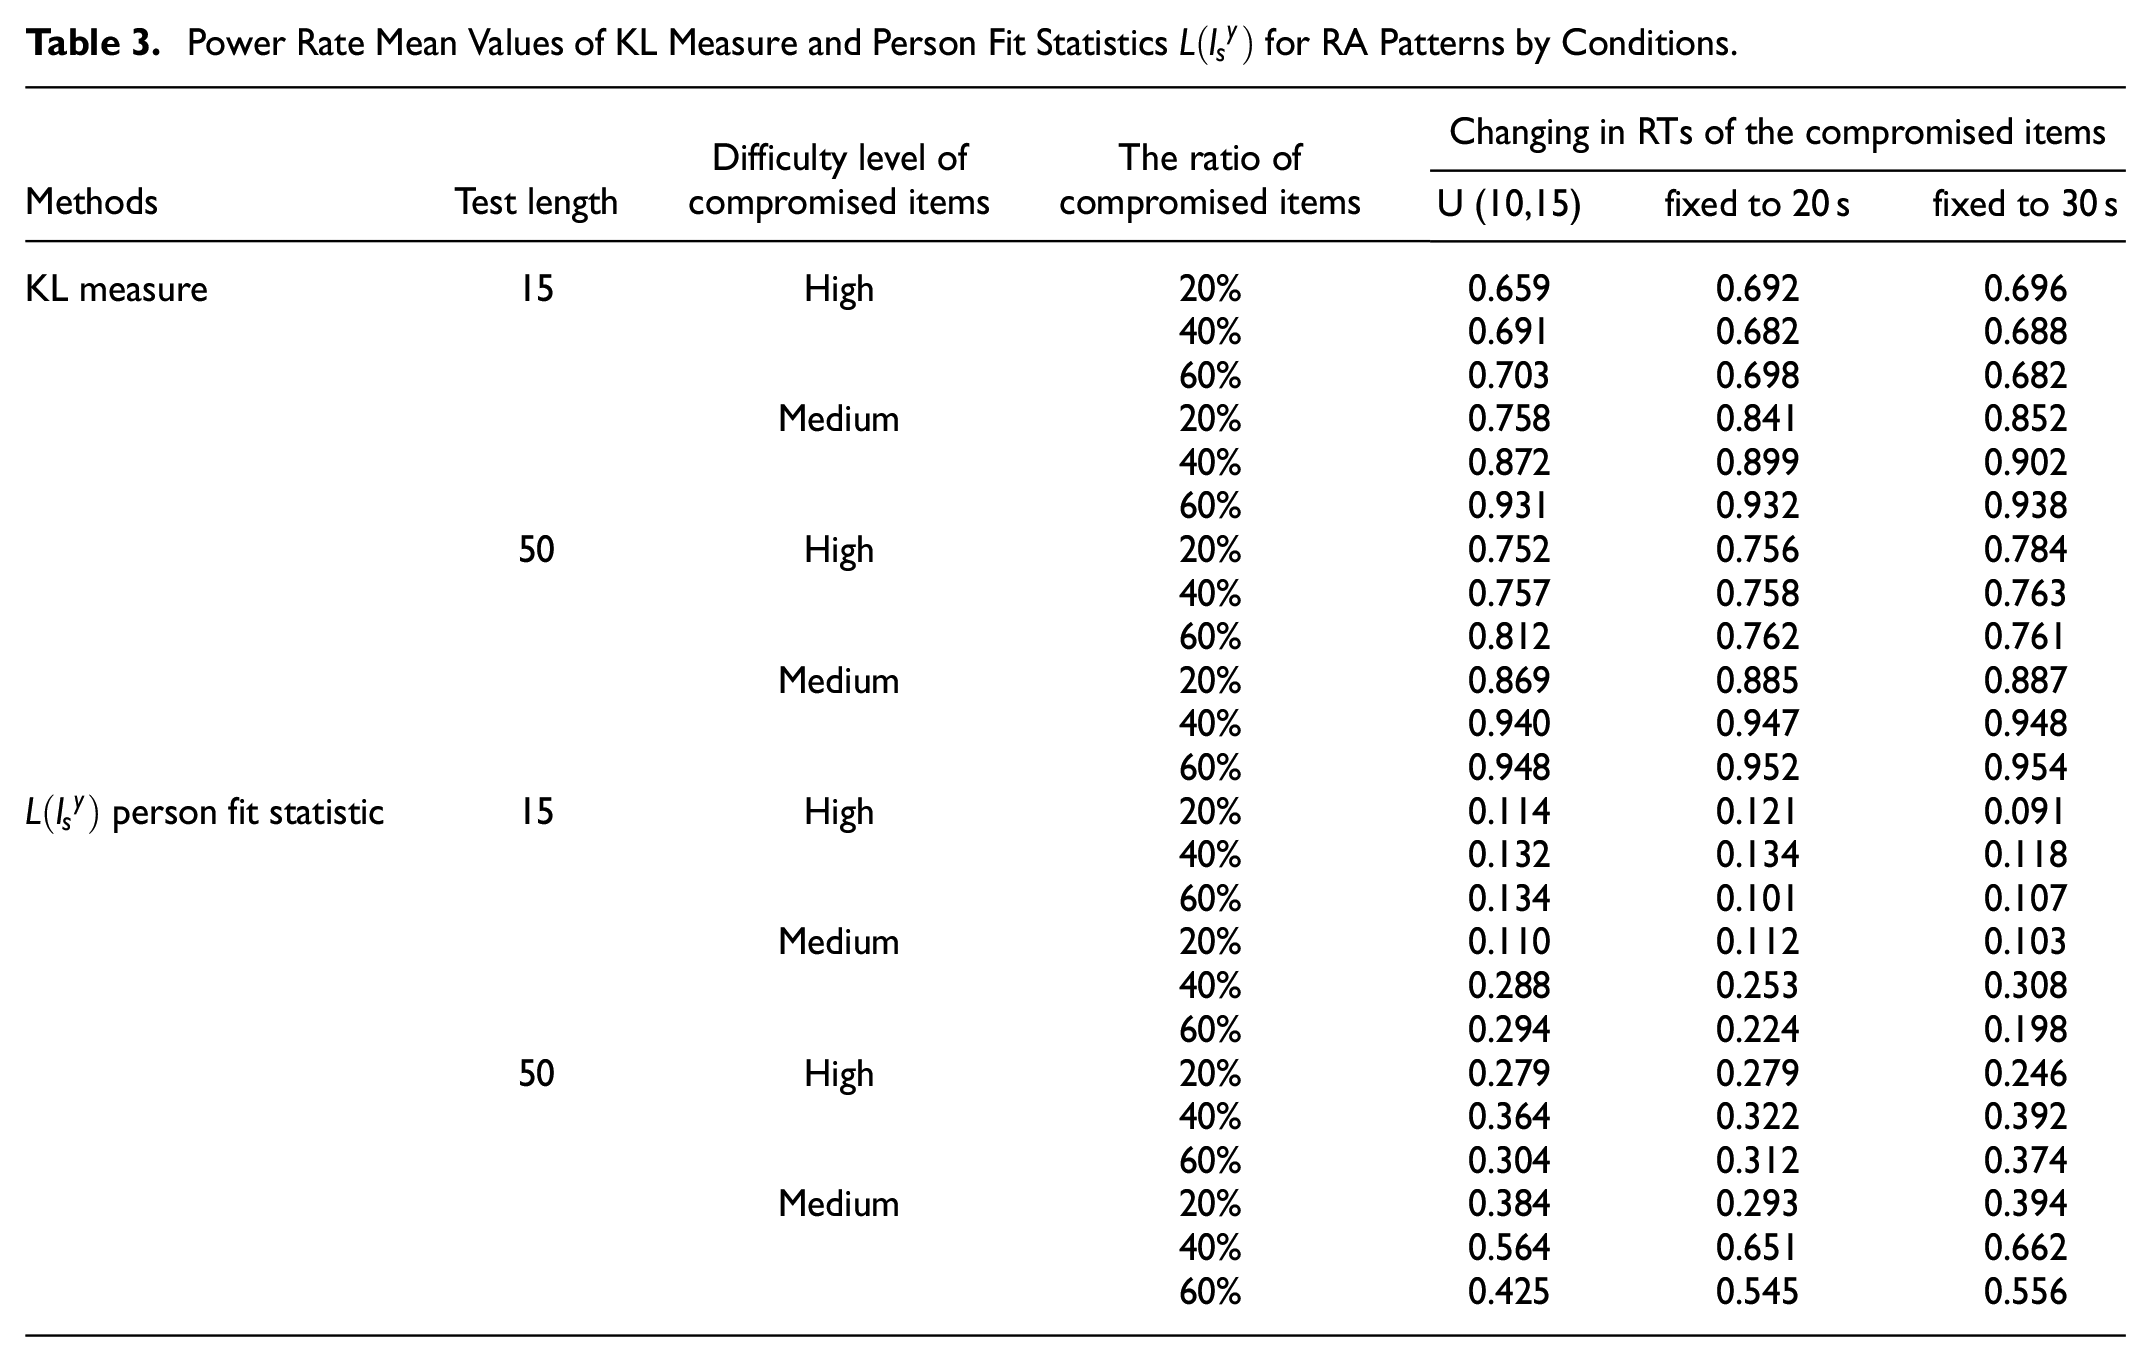
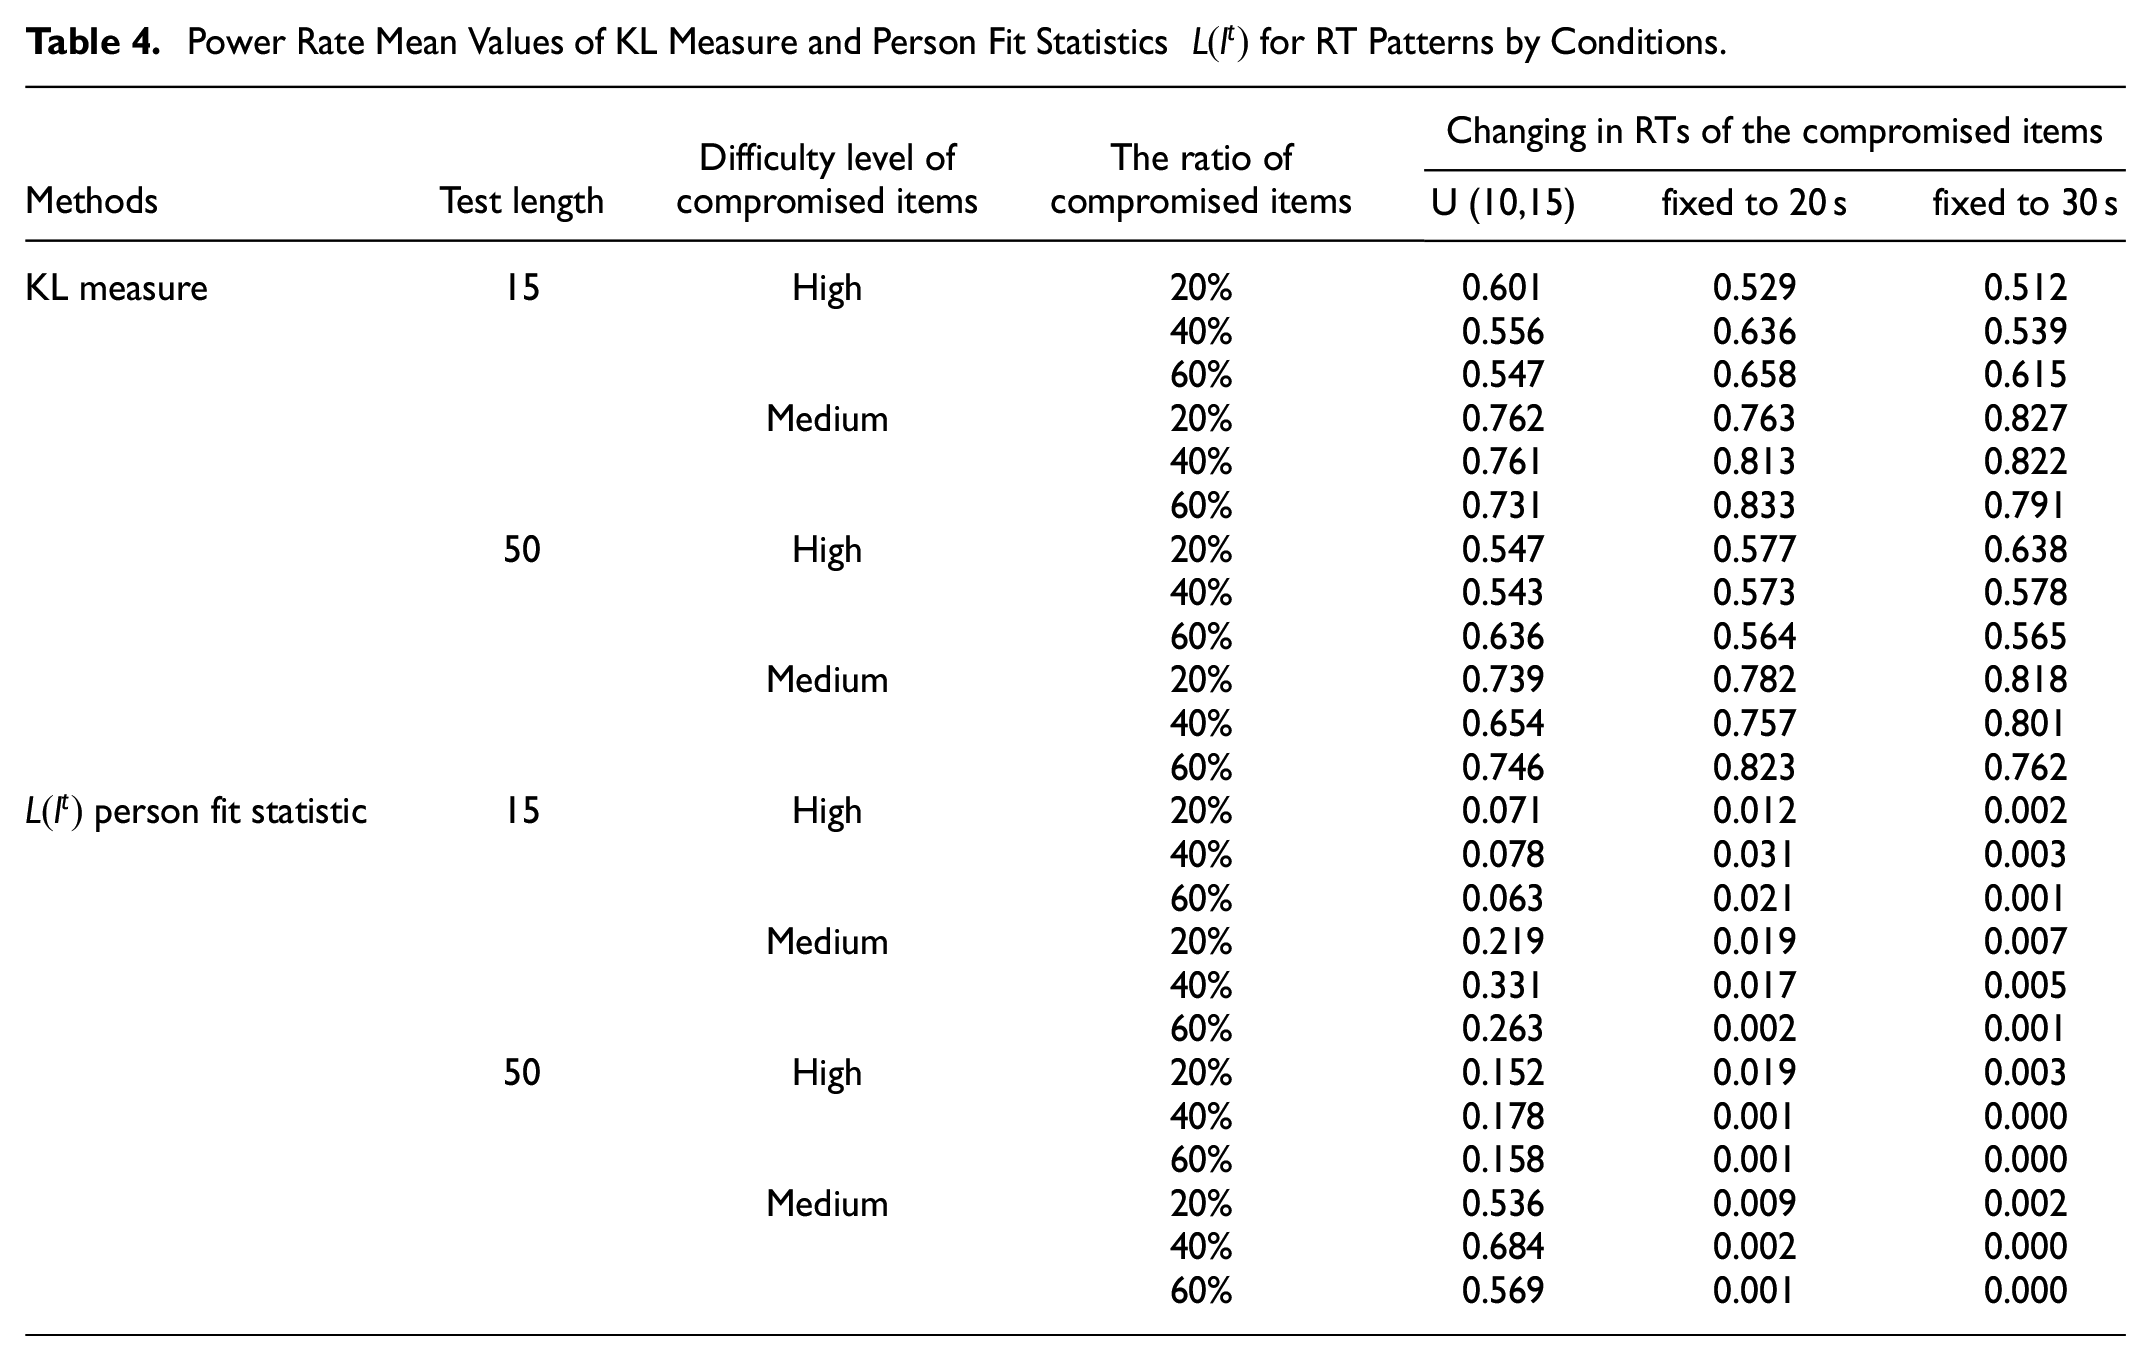
Tables 3 and 4 show the power rate mean values and of the KL measure and person fit statistics
Power Rate Mean Values of KL Measure and Person Fit Statistics
Power Rate Mean Values of KL Measure and Person Fit Statistics
The common effects of methods on power rate mean values of the test length, difficulty level of the compromised items, ratio of compromised items, and changes in RTs of the compromised item factors are shown in the following figures. Figure 3 shows that the conditions' common effects for power rate mean values of KL measure and person fit statistics for RA patterns.Figure 4 shows that the conditions' common effects for power rate mean values of KL measure and person fit statistics for RT patterns.

The conditions’ common effects for power rate values of KL measure and person fit statistics

The conditions’ common effects for power rate values of KL measure and person fit statistics
The KL measure had higher power rate values than the person-fit statistics
Although the power rate mean values of the person fit statistics
Discussion and Conclusions
The application of large-scale and high-risk exams, which play an important role in making important decisions by examinees, and the necessity of using online applications for exams in the distance education process, measurement, and evaluation are gaining momentum. In computer-based testing, which is widely used to provide more evidence for the validity and reliability of test scores, and in fraud-detection studies to ensure test security, it is important to obtain more detailed information, such as the moment of seeing the test item on the computer screen, the time to solve the test item, and the response of examinees to the item, in addition to the response of the examinees to the test items. The hierarchical model for responses and RTs (H-IRTRT) is becoming more common, owing to an increase in computer-based testing in educational and psychological assessments. In computer-based testing, responses are recommended to determine aberrant response behaviors together with RTs, as RTs provide information about working speed and time intensity, and the responses provide information about the examinees’ abilities.
This study applied the H-IRTRT to detect aberrant testing behavior by simulating preknowledge cheating. Person-fit statistics and divergence measures were developed to identify aberrant RA and RT patterns using H-IRTRT. In this study, the power rate mean value of the KL measure for the RA and RT patterns was directly proportional to the test length and the ratio of the compromised items and inversely proportional to the difficulty level of the compromised items. Fixing the RTs of the compromised items at 20 s increased the power rate mean values of the KL measure for the RT pattern, and fixing them to longer time values increased the power rate mean values of the KL measure for the RA pattern. In addition, the KL measure showed the highest Type I error rate mean value for medium test length and difficult items. This showcases that the KL distance, which is calculated as the difference between the a priori and posterior probability distributions of the examinees' ability parameters, is highly sensitive to the differences owing to the ability parameter estimation, and that the cutoff point method used in determining aberrant RA and RT patterns is quite conservative because of the uncertainty of the distribution under the null hypothesis. Using the Youden Index, one of the ROC analysis methods to calculate the cut score used in determining aberrant response and RTs patterns due to the unknown sample distribution under the null hypothesis of the KL measure, is one of the limitations of this study. As Uçar and Doğan (2021) stated, the KL measure shows a high Type I error rate mean value because the Youden Index, which is used to determine the cut-off score, tends to make the classification more appropriate by balancing the sensitivity and specificity amounts. In addition, the KL measure for RA and RT patterns had the highest performance when the RTs of the compromised items with difficult and medium difficulty levels were fixed at 20 s. Further, the use of the KL measure with a sample size of 1,000 is not recommended for sample sizes less than 1,000 because Type I error rate control cannot be achieved under all conditions. Thus, using the KL measure for identifying aberrant RA and RT patterns in cases where the RTs of compromised items are less than 20 seconds is not advisable. Moreover, simulation studies are recommended to determine the performance of the KL measure for RA and RT patterns in determining answer copying under various conditions by creating copy and source pairs under conditions in which the Type I error rate is controlled. Thus, conducting multidimensional studies is recommended by evaluating the detailed information (recording examinees’ eye movements and posture positions, etc.) obtained with the developed software, in addition to the use of approaches such as the KL measure, which may include false positive rates in identifying examinees with preknowledge, especially in large-scale and high-risk computer-based test applications. In light of the research findings obtained from this study, the conditions under which the Type I error rate was controlled by calculating the threshold value of the KL distance with different cut-off points in determining preknowledge cheating by using responses and RTs.
The power rate mean value of the person-fit statistics
It was shown in a simulation study that the KL measure has higher power and Type I error rate mean values than the person fit statistics
Supplemental Material
sj-txt-1-sgo-10.1177_21582440241297946 – Supplemental material for Investigation of Preknowledge Cheating via Joint Hierarchical Modeling Patterns of Response Accuracy and Response Time
Supplemental material, sj-txt-1-sgo-10.1177_21582440241297946 for Investigation of Preknowledge Cheating via Joint Hierarchical Modeling Patterns of Response Accuracy and Response Time by Ebru Balta and Celal Deha Dogan in SAGE Open
Supplemental Material
sj-txt-2-sgo-10.1177_21582440241297946 – Supplemental material for Investigation of Preknowledge Cheating via Joint Hierarchical Modeling Patterns of Response Accuracy and Response Time
Supplemental material, sj-txt-2-sgo-10.1177_21582440241297946 for Investigation of Preknowledge Cheating via Joint Hierarchical Modeling Patterns of Response Accuracy and Response Time by Ebru Balta and Celal Deha Dogan in SAGE Open
Footnotes
Declaration of Conflicting Interests
The author(s) declared no potential conflicts of interest with respect to the research, authorship, and/or publication of this article.
Funding
The author(s) received no financial support for the research, authorship, and/or publication of this article.
Data Availability Statement
All relevant data that support the findings of this study are available from the corresponding author upon reasonable request.
Supplemental material
Supplemental material for this article is available online.
References
Supplementary Material
Please find the following supplemental material available below.
For Open Access articles published under a Creative Commons License, all supplemental material carries the same license as the article it is associated with.
For non-Open Access articles published, all supplemental material carries a non-exclusive license, and permission requests for re-use of supplemental material or any part of supplemental material shall be sent directly to the copyright owner as specified in the copyright notice associated with the article.