
Abstract
The Hierarchical Diagnostic Classification Model (HDCM) reflects on the sequences of the presentation of the essential materials and attributes to answer the items of a test correctly. In this study, a foreign language reading comprehension test was analyzed employing HDCM and the generalized deterministic-input, noisy and gate (G-DINA) model to determine and compare respondents’ mastery profiles in the test’s predefined skills and to illustrate the relationships among the attributes involved in the test to capture the influence of sequential teaching of materials on increasing the probability of getting an item a correct answer. Furthermore, Differential Item Functioning (DIF) analysis was applied to detect whether the test functions as a reason for the gender gap in participants’ achievement. Finally, classification consistency and accuracy indices are studied. The results showed that the G-DINA and one of the HDCMs fit the data well. However, although the results of HDCM showed the existence of attribute dependencies in the reading comprehension test, the relative fit indices highlight a significant difference between the G-DINA and HDCM, favoring G-DINA. Moreover, results indicate that there is a significant difference between males and females in six items in favor of females. Besides, classification consistency and accuracy indices specify that the Iranian University Entrance Examination holds a 71% chance of categorizing a randomly selected test taker consistently on two distinct test settings and a 78% likelihood of accurately classifying any randomly selected student into the true latent classes. As a result, it can be concluded that the Iranian University Entrance Examination can be considered as a valid and reliable test.
Keywords
Introduction
In educational settings, there has always been a range of statistical techniques and assessments such as factor analysis, item response theory (IRT), and so on used to construct and assess tests and surveys, to estimate and interpret the test’s results, and to compute participants’ strength and performances. For example, a researcher might assume that the differences between strongly agree and agree is the same as the differences between agree and disagree, and disregards the fact that strongly agree signifies more agreement than agree, and that agree shows more agreement than disagree, and so on. In addition, it is obvious that all of the items of a test or survey cannot be considered to illustrate the same level of difficulty or to be equally agreeable, that is, a strongly agree in response to Item 5 of a survey cannot be considered to show the same level of agreement as answering a strongly agree to Item 10 of the survey. Moreover, researchers asserted that using raw data alone cannot help them in interpreting the results of a test perfectly. For example, if a researcher just compares the sum of the scores of the learners, she or he may state that the knowledge differences between Student A and Student B (20 − 15 = 5) and between Student C and Student D (15 − 10 = 5) are the same, and ignores the differences in difficulty across the items (Student A was able to answer a number of the highly difficult test items whereas the other students were unlikely to have successfully answered them).
However, as one of the world’s educational challenges, it is vital to have more specific information about tests and more formative feedback on respondents’ certain abilities or attributes (master/non-master) rather than just scaling respondents on a continuous scale based on a parameter or some scores (DiBello & Stout, 2007). Therefore, following the above-mentioned aim and to compensate for the weaknesses of the traditional assessments, Diagnostic Classification Models (DCMs), also well-known as Cognitive Diagnostic Models (CDMs) have emerged.
DCMs assess abilities, attitudes, or other attributes in light of student growth and change, with respect to the constructs that are going to be measured. Therefore, DCMs have been receiving more attention because of the fact that in many assessment situations, a simple overall score does not serve researchers and teachers’ purposes in classroom teaching, designing remedial courses, and material development (because respondents with the same overall scores do not necessarily have the same strengths and weaknesses and might have different mastery profiles). DCMs can maximize the chance of learning by “pinpointing why students perform as they do” (Leighton & Gierl, 2007, p. 5). Leighton and Gierl (2007) decode test tasks into tactics, procedures, and information which are essential to effectively perform in the tasks, thus assist teachers to understand learner’s faulty strategies (Baghaei & Ravand, 2015; Embretson, 1983) by providing comprehensive analytical feedback on why a given respondent may succeed or fail on any given test. In other words, rather than placing respondents on a continuous ability scale (which is appropriate for ranking and estimating test-takers’ general abilities), DCMs assign mastery/non-mastery classifications to individual testees who have the same total scores but not necessarily the same strengths and weaknesses and might have different mastery profiles.
Types of DCMs
DCMs illustrate the connection between psychometrics and cognitive science which encourage assessment for learning as opposed to the more traditional role of the assessment of learning outcomes. DCMs are classified under two major categories of specific and general (Table 1) which are different in showing the association between the likelihood of giving the right answer to an item and the mastery of the subskills needed for answering that item correctly (Ravand & Baghaei, 2020). If the mastery of one or more than one of these prerequisite traits to answer an item can make up for non-mastery of other attributes, Compensatory models (Disjunctive) are in use. It means that having great knowledge of one trait can compensate for a low level of competency in other traits. However, non-compensatory models (Conjunctive), specify that for correctly answering an item, all the needed attributes for the item should be mastered. Therefore, having a high level of knowledge on one skill cannot compensate for a low level of competence in another skill. Unlike compensatory models, in which the number of mastery of attributes does not have any effect on the increase of the probability of responding an item accurately, additive DCMs credit respondents for the number of traits mastered. Finally, when the model can be utilized to find out the two kinds of interactions within the same test and hypothesizing varying relationships among the traits across the items, General DCMs (Saturated) can be applied. Moreover, the hierarchical log-linear CDM (HLCDM; Templin & Bradshaw, 2014), which is a very recent extension of the generalized deterministic-input, noisy and gate (G-DINA), can test hierarchical relationships as well as compensatory versus non-compensatory relationships among the attributes.
CDM Categorization.

Source. Ravand (2016, p. 3).
Note. CDM = Cognitive Diagnostic Models; DCM = Diagnostic Classification Models.
Hierarchical Diagnostic Classification Model (HDCM)
HDCMs, categorized as hierarchical versus non-hierarchical and known as a set of models that effectively estimate and accurately test attribute hierarchies, model the relationships among the needed attributes and the impact the order of teaching materials (where learning a skill is prioritized upon other skills) has on increasing the likelihood of getting an item a correct answer. For instance, it seems reasonable that understanding sentences follows understanding vocabulary. Thus, HDCM can illustrate model attribute hierarchies/dependencies (Templin & Bradshaw, 2014), a feature that is not applicable using other types of DCMs. In contrast to other conventional DCMs, HDCM also consists of a smaller number of attribute profiles (a set of 0s and 1s showing the mastery/non-mastery of the attributes) and items’ parameters (Ravand, 2018). For example, using conventional DCMs, respondents of this study could have 32 (i.e., 25) skill profile patterns or attribute profiles due to the five skills involved in the test. However, because of attributes’ dependencies in HDCM, some of these attribute profiles or latent classes cannot exist. Therefore, in this model, instead of having 2A attribute profiles, the number of attribute profiles lessens to A + 1 (i.e., 5 + 1 = 6). Consequently, the item response function includes one intercept [00000] which means the probability of getting an item a correct response when none of the requisite attributes has been mastered, one main effect [10000] which refers to the increase in the likelihood of getting each item a correct answer when just one of the attributes has been mastered, and four interaction effects [11000], [111000], [11110], and [11111], which indicate the increase in the probability of the likelihood of getting each item a correct answer when a combination of the attributes has been mastered.
Differential Item Functioning (DIF)
DIF, as stated by Holland and Wainer (2012), is interested in studying the “behavior of tests items and their variation across ethnic, cultural, and linguistic groups and across groups that differ as a function of nationality, geography, time, sex, age, and educational disability” (p. 24). DIF in CDMs analysis is defined by Hou et al. (2014) as an effect where the probabilities of correctly answering an item are different for examinees with the same attribute mastery profile but who are from different observed groups. In other words, the item responses are not independent when conditioned on the attribute profiles alone. (p. 99)
Accordingly, gender DIF analysis is considered to be one of the vital parts of test development as it supports test developers to discover and reduce the unfair items and those that favor one group over the other groups.
According to (Huang, 2014), in DIF analysis, a reference group (usually the majority) is compared with a focal group (usually the minority). For instance, a study searching for bias against experienced teachers would use inexperienced teachers as the focal group and experienced teachers as the reference group. When more than one underlying latent trait is measured by an item, DIF occurs (Ackerman, 1992) which results in the multidimensionality of the items. It means that DIF signifies the presence of a secondary latent trait along with the primary latent trait which refers to one’s true understanding or knowledge of the construct being measured. Consequently, it is expected when reading comprehension is going to be assessed, the items only measure students’ understanding of reading comprehension questions, not cultural knowledge, for example. As a result, when items do not show the same response function for groups, unidimensionality, which is one of the important assumptions of latent trait analysis, is violated.
While literature shows that there are a vast number of DIF studies on international examinations such as IELTS (International English Language Testing System) and TOEFL (Test of English as a Foreign Language; Bailey, 1999; Liu et al., 2009; Wall & Horák, 2008) and Scholastic aptitude test (Bridgeman & Wendler, 1991; Curley & Schmitt, 1993) and Iranian National test such as University of Tehran’s English Proficiency Test (Amirian et al., 2014; Fidalgo et al., 2014), the Iran University Entrance Examination has not received much attention. Barati et al. (2006) studied DIF in the Entrance Examination of Iranian National University and reported the existence of general gender DIF patterns. Ravand and Firoozi (2016) also studied DIF across gender in the University Entrance Examination for applicants of English Master’s Programs in Iran. Their findings showed invariance of item calibrations across males and females. In addition, Kohút et al. (2016) focused on gender DIF in intelligence grammar test and reported that specific content of verbal intelligence items can probably be a source of gender DIF. However, the most recent studies by Ravand (2018) and Ravand et al. (2020) revealed no gender DIF patterns in the Iranian University Entrance Examination (IUEE) for applicants of English Bachelor’s Programs. Furthermore, Appelbaum et al. (2019) investigated gender DIF for attention deficit disorder and showed no gender DIF patterns among girls and boys.
Classification Consistency and Accuracy
Evaluating how well a participant’s response behavior is described by CDM is another focus of this study. CDMs are known to be supportive for teachers in planning effective diagnostic mediations for test-takers by providing comprehensive information within a specific content area about individuals’ skills and knowledge. However, the classification results which are provided by CDM must be validated (de la Torre & Douglas, 2004; Hartz, 2002; Junker & Sijtsma, 2001; Templin & Henson, 2006; von Davier, 2007). Two of the very current significant measures to evaluate and validate the participant’s response behavior and describe the quality of the scores are the classification accuracy and classification consistency (Effatpanah, 2019; Effatpanah et al., 2019).
Classification accuracy (Pa) is defined as the possibility that the probable classification corresponds to a randomly selected respondent’s correct mastery profile, whereas, classification consistency (Pc) refers to the probability that the probable attribute mastery classifications correspond across two parallel administrations of a test (Cui et al., 2012; W. Wang et al., 2015). Therefore, they provide an overall picture of the accuracy and consistency of the classifications. On the contrary, attribute-specific indices are supportive in providing researchers, teachers, and test developers a way to select the most suitable test based on different qualities they aimed at measuring with better consistency and accuracy (Cui et al., 2012).
The Present Study
Considering valid and reliable scores, assessment and measurement of students’ understanding of different concepts seem to be very important especially for high-stakes tests. One of these concepts, as one of the main language skills, is reading comprehension which is a skill to process text, comprehend its meaning (Grabe, 2009).
In both first-language and second-language learning, reading comprehension is considered as one of the most significant and challenging skills which involves a multidimensional process that requires complex interaction among a number of different levels of ability and attributes (Harding et al., 2015; Shin et al., 2018). In other words, as stated by Alptekin and Ercetin (2011), students interact with the text to different degrees, and may come across challenges while reading whether they are learning to read or reading to learn.
According to Alderson (2000) and Khalifa and Weir (2009), the complexity of testing reading comprehension depends on some main issues such as the connection between the needed attributes to answer the items as well as the extent to which particular reading comprehension subskills can be measured in different kinds of tests or with respect to items formats. Accordingly, there are numerous studies done on these attributes and cognitive aspects of reading comprehension (Goh & Aryadoust, 2015; Grabe & Stoller, 2002; Lumley, 1993; Shin et al., 2018); however, much efforts and considerations are needed to have a comprehensive understanding of attributes and variables involved in successful comprehension of a reading passage (Alderson, 2005) and investigating the effect of hierarchical and sequential correlations among different attributes, which might increase the likelihood of providing an item a correct answer.
Thus, the most significant aim of this study is to compensate for the weaknesses of the traditional assessments and provide researchers with detailed information about the items and participants by testing hypotheses on the hierarchical correlations among different attributes using HDCM. In addition, according to Lee and Sawaki (2009b), Li et al. (2016), and Ravand and Robitzsch (2018), the relationships among reading comprehension’s attributes can be a blend of conjunctive, disjunctive, and additive, thus G-DINA (i.e., a general DCM that allows for all the three kinds of relationships) was also applied. Moreover, as understanding the groups’ performances are important for equity, which means testing and evaluating should not differentiate against individuals, DIF which is known as a method to ensure that the tests do not favor one sub-group of examinees over the others, is utilized by the researchers with respect to participants’ gender. Besides, classification consistency and accuracy, which are referred to the consistency of classification and how accurately participants are classified in their correct skill profiles, were assessed to validate the CDMs’ provided information regarding students’ skills and knowledge within the content of reading comprehension using CDM package (Robitzsch et al., 2015) in R.
Participants and Setting
The data of the present study, which were analyzed by the DCM package in R (Robitzsch et al., 2015), consists the responses of 10,000 IUEE candidates (69% females and 31% males, aged between 22 and 25) in 2012 to 20 items measuring knowledge of (a) Identifying word meaning from the context, (b) Identifying pronominal references, (c) Extracting explicit information, (d) Evaluating response options, and (e) Making inferences.
The IUEE is held annually in a four-option multiple-choice test, designed for students who are willing to study foreign languages in state universities of Iran. The IUEE is only used to evaluate the overall language scores of the students to make pass/fail decisions. However, considering the sample size and the representativeness of the sample, a great wealth of diagnostic information is included in the data that the researcher aims to shed light on them.
The test consists of 70 four-option multiple-choice items in six different parts: 10 sentence structure items, 15 lexicon items, five sentence structure items, 10 language function items, 10 cloze items, and 20 reading items. The reading comprehension items, including three 425- to 495-word passages is the part which is going to be analyzed in this study.
Q-Matrix Construction
The loading structure of a DCM, which is known as a Q-matrix, illustrates the required hypothetical skills for answering each item correctly (Li, 2011) and consists of rows and columns that represent test items and underlying traits for performing the test. As the latent trait in DCMs is considered as categorical and because of the confirmatory nature of DCMs (Ravand et al., 2013), a Q-matrix is hypothesized (Table 2).
The Final Q-Matrix.
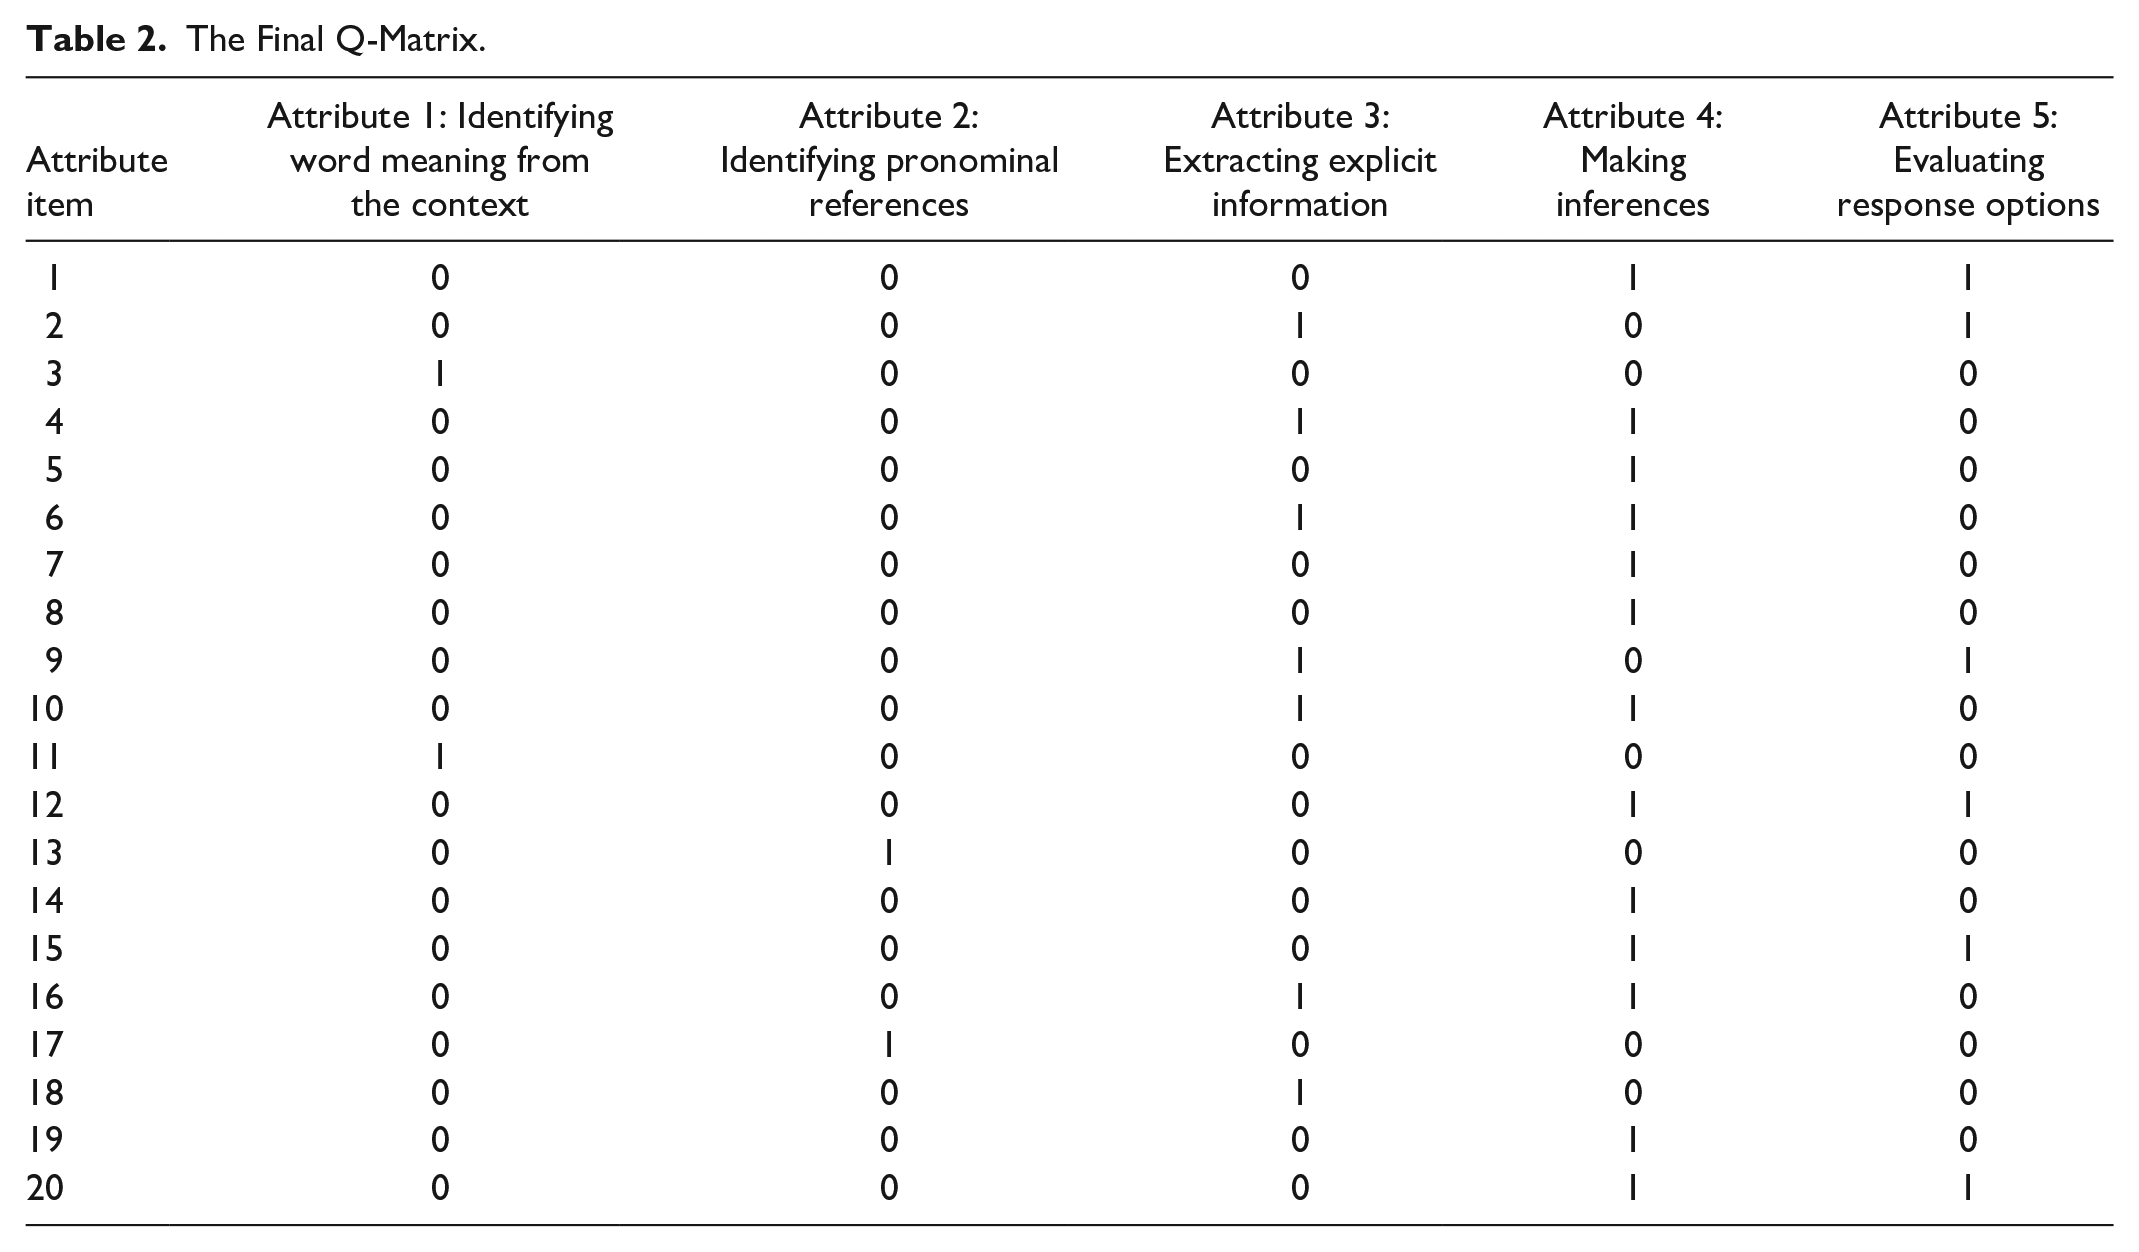
The Q-matrix shows hypothesized mapping between skills and test items to clarify various required traits to answer each item correctly. To identify these traits, different sources like think-aloud protocol, test specifications, as well as test items’ content analysis (Leighton & Gierl, 2007) can be used.
Accordingly, to determine the traits and attributes of reading comprehension, the present study used reading comprehension’s earlier research (Clark, 2013; Jang, 2005; Kim, 2015; Lee & Sawaki, 2009a; Ravand, 2016; Sheehan, 1997; Svetina et al., 2011; Zheng & De Jong, 2011) and different language ability models such as Hughes’s (2003) model, which is known as a widespread model that identified all the possible reading traits. This model consisted of 20 attributes including the following: (1) Identify pronominal references, (2) Identify discourse markers, (3) Interpret complex sentences, (4) Interpret topic sentences, (5) Outline logical organization of a text, (6) Outline the development of an argument, (7) Distinguish general statements from examples, (8) Identify explicitly stated main ideas, (9) Identify implicitly stated main ideas, (10) Recognize writer’s intention, (11) Recognize attitudes and emotions of the writer, (12) Identify addressee or audience for a text, (13) Identify what kind of text is involved (e.g. editorial, diary, etc.), (14) Distinguish fact from opinion, (15) Distinguish hypothesis from fact, (16) Distinguish fact from rumor or hearsay, (17) Infer the meaning of an unknown word from the context, (18) Make propositional informational inferences answering questions beginning with who, when, what, (19) Make propositional explanatory inferences concerned with motivation, cause, consequence, and enablement, answering questions beginning with why and how, and (20) Make pragmatic inferences. (Hughes, 2003, p. 139)
Moreover, Farhadi et al.’s (1994) model was checked. This model consists of the following attributes: Guess the meaning of words from context, Understand the syntactic structure of the passage, Get explicit and implicit ideas, Grasp the main idea of the passage, Recognize the tone, mood, and purpose of the writer, Identify literary techniques of the writer, and Draw inferences about the content of the passage. (Farhadi et al., 1994, p. 223)
After brainstorming on the probable attributes, five attributes (Table 2) were chosen from the pool of reading comprehension subskills and attributes including (a) Recognizing word meaning from the context, (b) Identifying pronominal references, (c) Extracting explicit information, (d) Evaluating response options, and (e) Making inferences (the integration of five other attributes including “understanding the author’s intention,” “synthesizing and connecting information,” “identify the main ideas,” “extracting implicit information,” and “using background knowledge”).
Meanwhile, two teachers from the field, with at least 5 years’ experience of teaching reading comprehension at the BA level were invited to individually identify the traits assessed by each of the 20 reading items. Then, the researchers and the two teachers agreed on the required attributes in a session. For the final step, to come to an agreement about the Q-matrix, two experts were requested to separately assign the attributes to individual items.
According to the validation procedure (de la Torre & Chiu, 2016) that offers guidelines for adjustment of the Q-matrix by either turning 0 items into 1s or vice versa, 11 of the 0s in the final Q-matrix had to be converted to 1. However, the researcher converted only those which had also been proposed by at least one of the coders when they individually code the items. Therefore, only six modifications were implemented (in three cases, 0s turned into 1s, and in three cases, 1s turned into 0s). In a nutshell, 10 items measured one attribute, 10 items two attributes. Thus, the average attribute per item was 30 / 20 = 1.5.
Specifying Attribute Dependencies
To specify the relationship among the required attributes, four experts in the field were asked to think of the probable correlational arrangements among the attributes according to the four types of Leighton et al.’s (2004) attribute hierarchies (Figure 1).
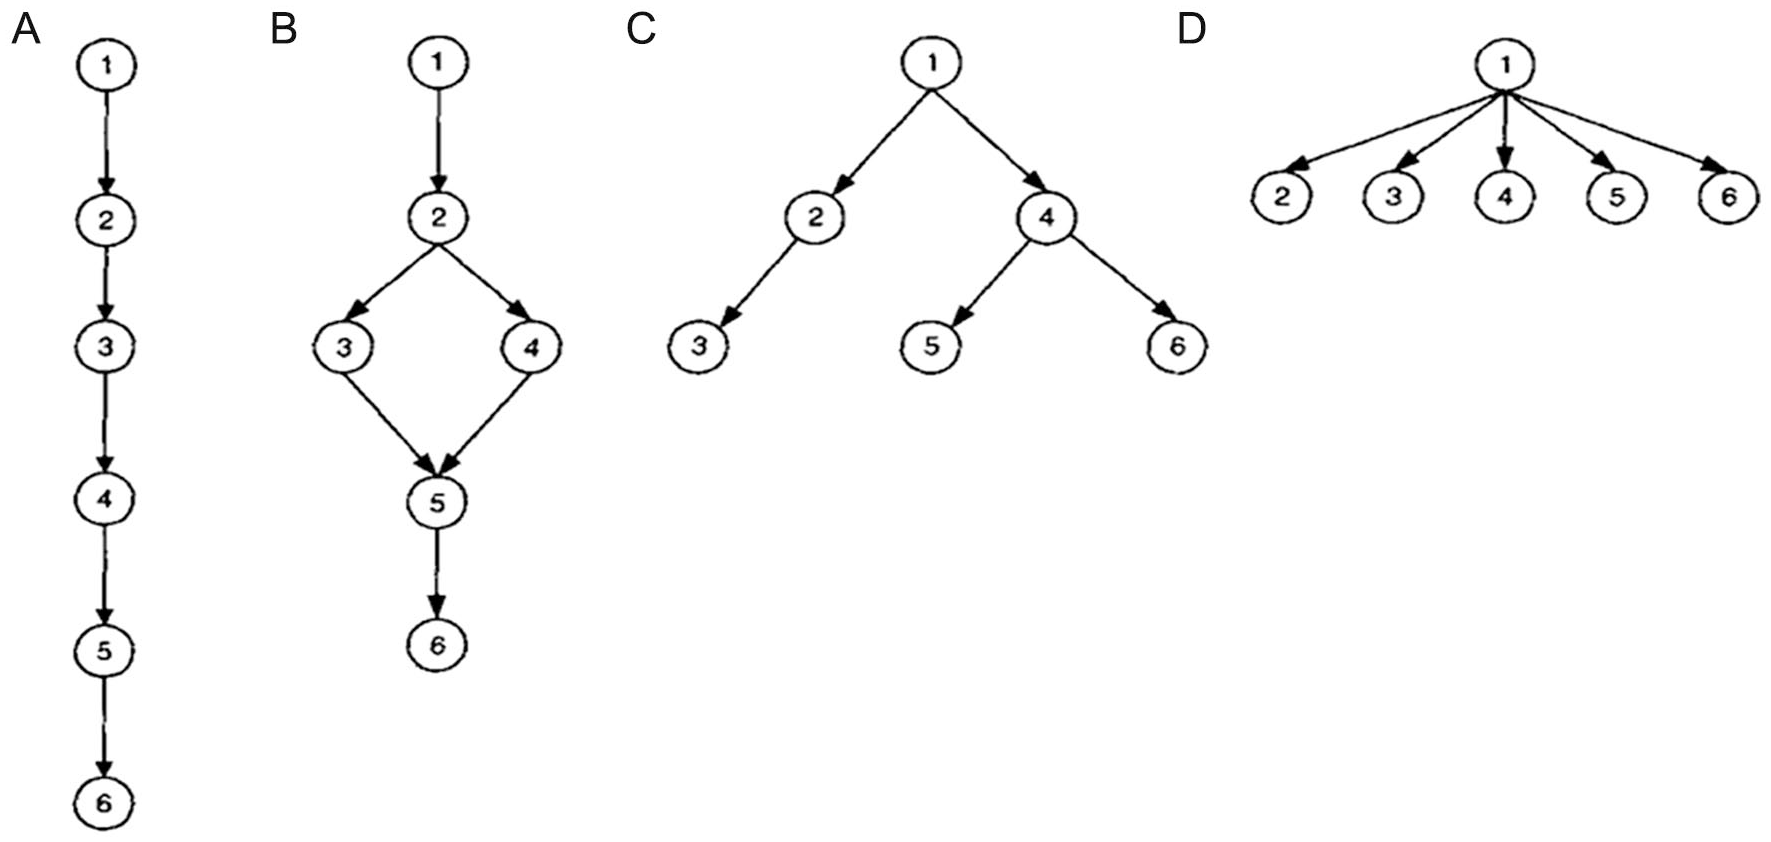
Possible attribute hierarchies: (A) Linear, (B) Convergent, (C) Divergent, and (D) Unstructured.
Linear hierarchy illustrates the order of the attributes in one branch. Convergent hierarchy shows that an attribute in a branch could have several prerequisites whereas multiple branches are derived from the identical trait in a divergent hierarchy. Finally, many different branches can be linked to the same attributes but not linked to each other in unstructured hierarchy.
From the four experts, two judges identified two linear hierarchy models as HDCM1 and HDCM2 in Figure 2. And two other judges identified a divergent pattern of attributes as in HDCM3.

Hypothesized hierarchies.
Analysis
The data of the study were subjected to statistical analysis running the DCM package (Robitzsch et al., 2015) in R. In addition, G-DINA package (de la Torre, 2011) was applied to validate the Q-matrix and DIF and classification analysis.
Thus, the three proposed HDCMs in Model 2 and the G-DINA were compared in case of the absolute fit indices. Then, the relative fit indices of the fitted models were studied using the likelihood ratio (LR) test, which examines whether the relative fit indices’ observed differences were different statistically and significantly. Moreover, the attribute profiles’ prevalence, which shows the hierarchical nature of the attributes, was checked.
Results
HDCM Results
Fit of the data to DCMs shows the amount of accuracy in the relationship between attributes and items. There are two kinds of model fit indices in DCMs. Absolute fit (Table 3) shows the fit of models to data whereas Relative fit (Table 4) compares the model’s results with other models (Ravand & Robitzsch, 2015).
Absolute Fit Indices.
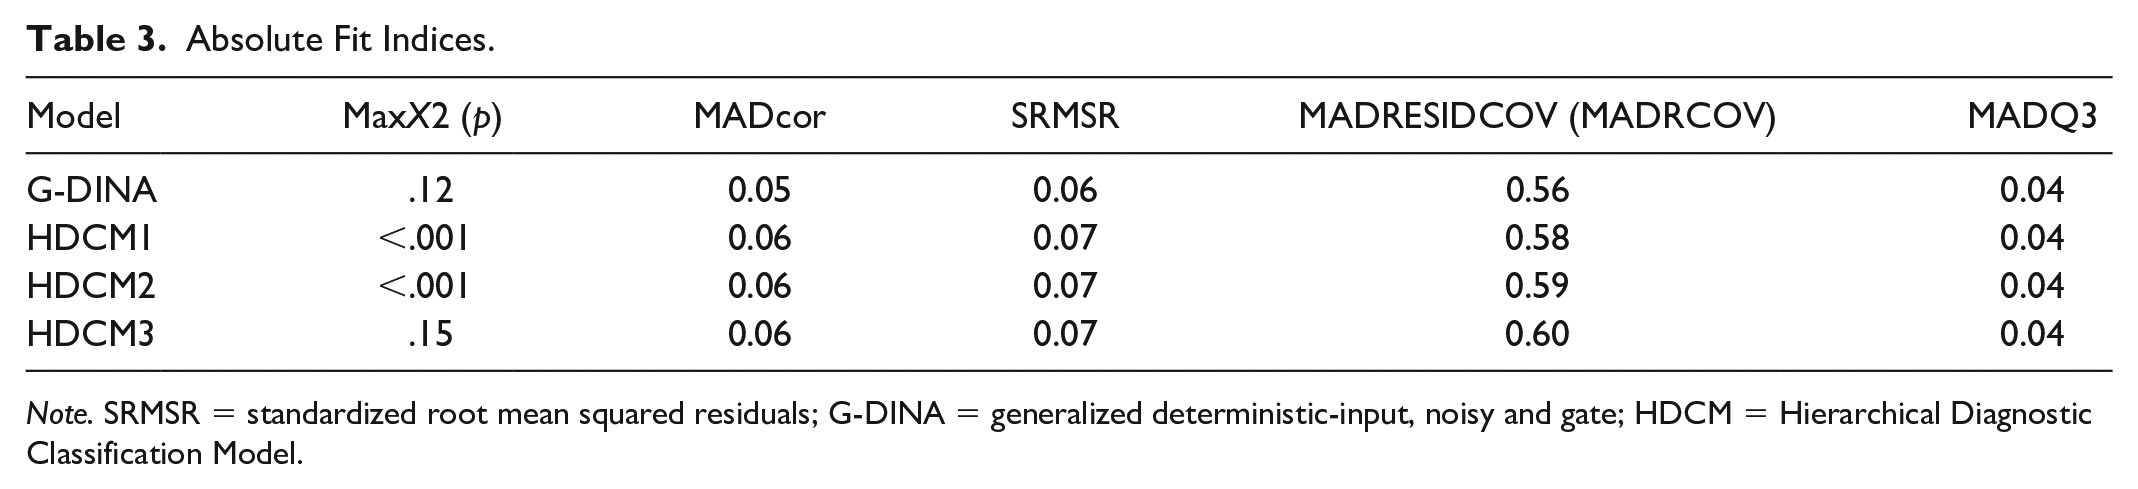
Note. SRMSR = standardized root mean squared residuals; G-DINA = generalized deterministic-input, noisy and gate; HDCM = Hierarchical Diagnostic Classification Model.
Relative Fit Indices.
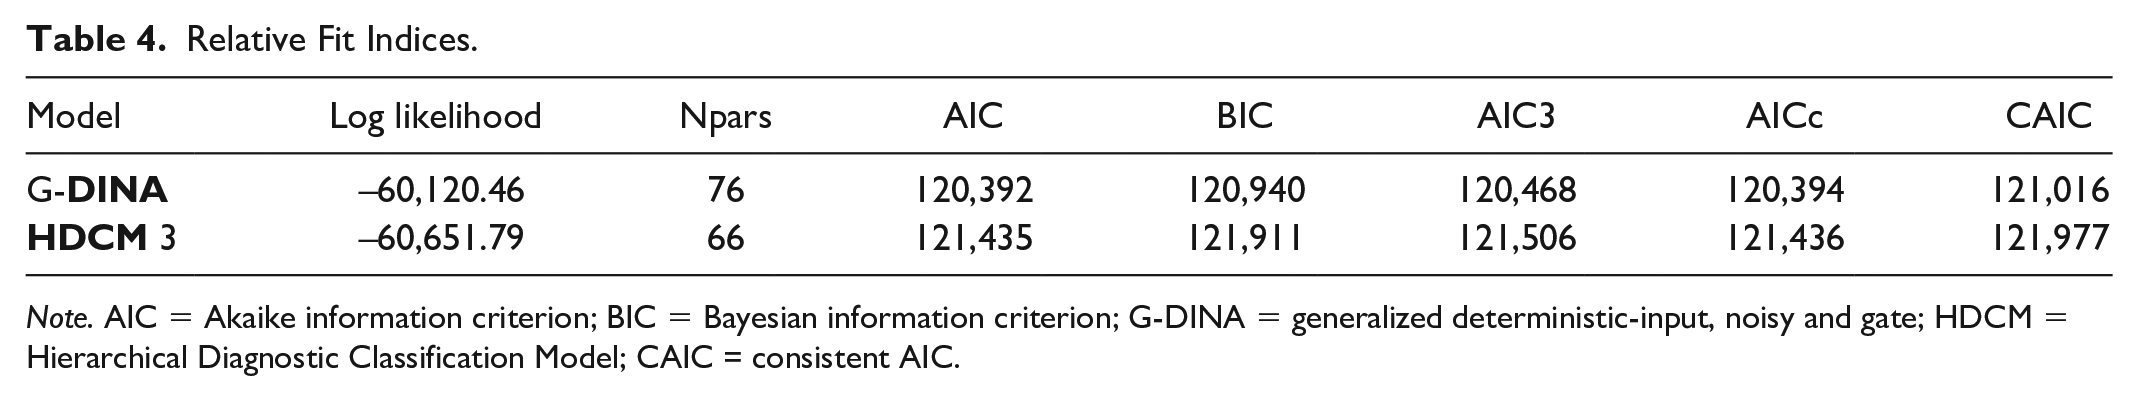
Note. AIC = Akaike information criterion; BIC = Bayesian information criterion; G-DINA = generalized deterministic-input, noisy and gate; HDCM = Hierarchical Diagnostic Classification Model; CAIC = consistent AIC.
Due to quite new development, there is no controversial basis for the absolute fit indices of DCMs. However, there are proposed effect sizes for MADcor, SRMSR, and MADRESIDCOV which indicate that the slighter an effect size, the better a model fits (Robitzsch et al., 2015). Maydeu-Olivares (2013) proposes that SRMSR values (standardized root mean squared residuals) smaller than 0.05 specifies a good model fit. Jang (2005) also suggests a MADcor value of 0.049 signifies a good model fit. DiBello et al. (2007) stated that MADcor shows the variance between the model-predicted and the observed item associations. MADRESIDCOV (mean residual covariance) illustrates the mean variance between observed and reproduced item correlation values (McDonald & Mok, 1995). MADQ3 is analyzed by deducting the model predicted from the observed respondents’ answers and calculating the mean of the pairwise correlations of residuals (Yen, 1984). According to Table 3, although the non-significant MX2 values show that the G-DINA and HDCM3 fit the data, it is evident that the G-DINA model is the finest fitting model. Thus, for the rest of the analyses, the results of the HDCM 1 and HDCM 2 are not considered.
Table 4 shows the models’ relative fit indices and the number of item parameters. The model with the smallest indices is the most preferable. Therefore, lower Akaike information criterion (AIC) and Bayesian information criterion (BIC) used to compare both nested and non-nested models are preferred. Moreover, to compare log-likelihood values of nested models against those of a model with more parameters, the LR test can be applied (Ravand, 2016). As the HDCM is nested in the G-DINA, the LR test was run to check and compare the HDCM and the G-DINA’s log likelihood. A significant variance in the log-likelihood indices specifies that the nested model fits the data (Table 4).
According to the indices, the G-DINA model, then HDCM 3, fit the data best. Therefore, the G-DINA model, which is illustrated to have the lowest value for all three relative fit indices of LL, AIC, and BIC, has the best fit.
Attribute dependencies can also be shown through the attribute profiles according to the G-DINA (Table 5). It should also be noted that from the 32 attribute profiles only A + 1 (i.e., 5 + 1 = 6) attribute profiles can be possible according to the assumptions of HDCM.
Attribute Profile Prevalence.

Note. Skill profiles where all the prerequisite attributes have been mastered are written in bold.
Table 5 displays the 25 = 32 attribute profiles as well as the probability of each attribute profile. The order of the attributes in the attribute profiles is the same as their order in the Q-matrix in Table 2 (i.e., Identifying word meaning from the context, Identifying pronominal references, Extracting explicit information, Making inferences, and Evaluating response options). Attribute profiles with probabilities <.05 are not considered significantly and sizably populated because they are shown to possess less than 5% of the respondents. Accordingly, Table 5 shows that only five of the latent classes generated by the G-DINA contained an ample number of examinees.
The table also illustrates that the attribute profile of [00000] has the highest class probability, 57%, which means approximately 58% (5,668 candidates out of 10000) of the candidates of the IUEE are categorized in this latent class. Latent class 32 with the attribute profile of [11111] and with the probability of approximately 12% is the second latent class with the highest probability. Therefore, these attribute profiles which are called flat profiles, are shown to have the highest probability and the most frequency, which is in accordance with the results of Lee and Sawaki (2009b), Li (2011), Ravand et al. (2013), and Ravand (2016) DCM studies. The high frequency of the flat profiles, which show the mastery profiles of non-masters of all traits [00000] and the mastery profiles of all five traits [11111], signifies the unidimensionality of the test.
Regarding the HDCM 3 model (Figure 2), there are two branches in the hierarchy of attributes that connect “Identifying word meaning from the context” to both “Extracting explicit information” and “Evaluating response options.” Thus, attribute profiles where the “Identifying word meaning from the context” has not been mastered (e.g., [01111], [01000], [01011], [00100], [01010], [00111], [01100]) should not exist in the sample of respondents as “Identifying word meaning from the context” is the requisite of all the other attributes in the hierarchy. As Table 5 shows, most of these latent classes are insignificantly populated.
Moreover, as “Extracting explicit information” is a prerequisite for “Identifying pronominal references,” which is, in turn, a prerequisite for “Making inferences,” attribute profiles such as [10101], [10111], [11010], and [00010] are not possible in the sample of the respondents. It means that “Extracting explicit information” should be mastered before “Identifying pronominal references” and “Making inferences.”
DIF Results
Table 6 displays the results of the DIF analysis. The fourth column, which illustrates the differences between slipping and guessing parameters with respect to gender, showed that there is a difference between slipping and guessing parameters in six items (Items 2, 3, 5, 6, 17, and 19; p < .05), favoring the females. Slipping parameters show the likelihood of giving a wrong response to the item despite having mastered all the needed attributes, and guessing parameters refer to the probability of giving a correct answer to the item in spite of not having mastered all the prerequisite attributes. Considering the study’s large sample size that might affect the significance of the small differences, the effect size (the last column [unsigned area (UA) which is defined as the weighted absolute difference of item response functions] in Table 6) is estimated to show the significance of differences among parameters. According to Jodoin and Gierl (2001), values of .059 discriminate small from moderate DIF and .088 differentiate moderate from the large DIF. As Table 6 illustrates, the effect sizes for all the six items are below .059. Consequently, the effect size evaluations of DIF specified that across all the six items, the size of DIF was small to moderate and so considered as negligible. As a result, it can be concluded that the IUEE can be considered as a valid test.
DIF Results.
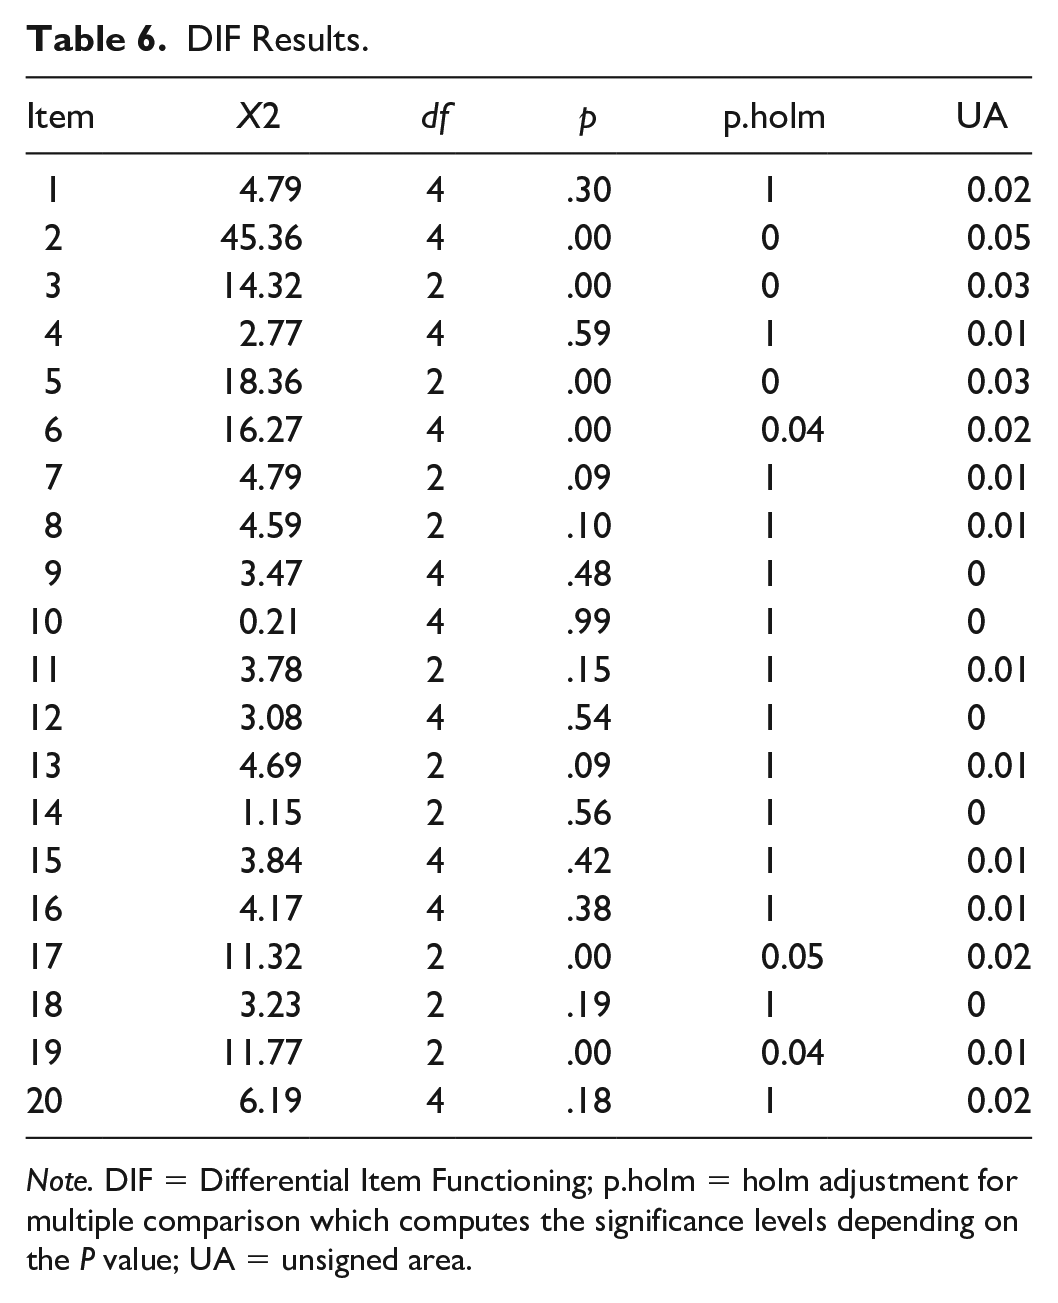
Note. DIF = Differential Item Functioning; p.holm = holm adjustment for multiple comparison which computes the significance levels depending on the P value; UA = unsigned area.
According to the proposed Q-matrix, among these six items, three were supposed to be engaged with the first attribute “Making inferences,” and two were involved in “Extracting explicit information.” In the second, third, fourth, and fifth questions, students were invited to answer items according to a passage on “ecotourism.” Thus, it seems that among the three passages, the first one differentiates between males and females more than the others. This might be because of the defined attributes. It could be possible that another attribute other than the predefined ones in the study’s Q-matrix might be used by the respondents. To understand and solve this gap, using a think-aloud protocol could be beneficial. Reading passages and topic familiarity can be considered as another reason as Curley and Schmitt (1993), Lawrence et al. (1988), and Maller (2001) stated that females can get a higher score on humanities reading texts but lower than males on science texts.
Classification Consistency and Accuracy Results
Table 7 illustrates the pattern-level and subskill-level Pc and Pa indices based on the maximum a posteriori (MAP) which is the value of a person’s attribute mastery that is the same as the scores on the item response. The classification consistency is, in fact, the probability of the uniformity and consistency of a test taker’s MAP for the attribute across the two forms of the test, that is, equal to the probability of getting the same X scores on the two forms by the test taker (Johnson & Sinharay, 2018). Estimation (the first row) shows that the sample level Pc and Pa are .71 and .78, respectively, specifying that, generally, the IUEE holds a 71% chance of categorizing a randomly selected test taker consistently on two separate test settings or test forms. Moreover, the test was shown to have a 78% likelihood of precisely classifying any randomly chosen student into his or her true latent classes. These study’s values which are significantly high indicate a very good general reliability and validity of the classifications (Cui et al., 2012).
Classification Consistency (Pc) and Accuracy (Pa).

Moreover, Table 7 illustrates the extent to which the examinees were consistently and accurately classified as masters and non-masters for each attribute. There are no agreed-upon criteria for Pc and Pa indices; however, the indices for all the attributes were shown to be significantly high. Therefore, the study’s classifications reliability and validity can be considered to be highly acceptable.
Discussion
The HDCM, which aimed at illustrating test performance in areas where a hierarchical ordering of skills is essential for calculating and organizing test takers’ responses, can be utilized to assess the required cognitive processes in a higher-level thinking task such as a second-language reading comprehension. Therefore, the present study aimed at examining hypotheses on the hierarchical correlations among different attributes using the HDCM and comparing the results with G-DINA. The study can be considered as one of the rare studies in Iranian settings that apply HDCM to test attribute dependencies. Thus, a DCM (G-DINA) and three different HDCMs, each signifying a different hypothesis as to attribute dependencies, were fitted to the reading comprehension data.
Moreover, as developing an unbiased test is very important in educational settings, the participants’ gender as a source of test bias was subjected to DIF analysis. Finally, to examine the reliability of classification and how well individual participants are properly classified in their true skill classes, accuracy and consistency of the CDMs were addressed by measuring the model’s classification accuracy and consistency.
Absolute fit indices displayed that the G-DINA and HDCM 3 fitted the data. In terms of the relative fit indices, a significant difference between the G-DINA and HDCM 3 was shown regarding the LR test and the AIC and BIC values, favoring G-DINA.
The prevalence of attribute profiles also supports the Model fit results by illustrating that under the G-DINA, only five of the attribute mastery profiles’ patterns were significantly populated. The results also support the hypothesis that “Identifying word meaning from the context” is a prerequisite to all the other attributes as the attribute profiles such as [01111], [01000], [01011], [00100], [01010], [00111], and [01100] contain very few participants. In addition, the existence of a very few examinees in the attribute profiles such as [10101], [10111], [10010], and [00010] proposes that “Extracting explicit information” should be mastered before “Identifying pronominal references” which is, in turn, a prerequisite for “Making inferences” which means “Extracting explicit information” should be mastered before “Identifying pronominal references” and “Making inferences.” The results are in accordance with Alptekin and Ercetin (2011) that stated to get implicit and explicit information, students have to use some logical and pragmatic strategies across sentences.
Generally, although the G-DINA fitted the model best, the results of HDCM 3 showed the existence of attribute dependencies in the reading comprehension test. These attribute dependencies, which highlight the fact that attributes might be dependent on each other, reflect on the amount of emphasis put on and the order of presentation of the reading comprehension subskills in educational syllabi (Ravand, 2016).
In accordance with the results of this study, Grabe and Stoller (2002), Lumley (1993), and Kim (2015) also investigate the hierarchy of reading comprehension attributes. In their hierarchies, Inferencing and Summarizing stood higher than the Paragraph Knowledge, Cohesive Meaning, and Lexical meaning. Ravand (2018), who also works on the attribute dependencies in a reading comprehension test, reported lexical knowledge as the prerequisite to all the attributes.
The results of DIF analysis also showed that although six out of 20 items of the reading comprehension exam display gender differences, the magnitude of DIF was very small. Therefore, the test is considered to be a gender DIF-free test and hence a valid and reliable test. Nevertheless, these small differences could be explained by the notion of “topic familiarity” (Rezaee & Shabani, 2010; Salehi & Tayebi, 2012). Besides, the measures of accuracy were shown to be significantly high which signifies the overall classifications’ reliability and validity.
Conclusion
In this study, a foreign language reading comprehension test was subjected to DCM analysis by applying G-DINA and HDCM to determine and compare respondents’ strengths, weaknesses, and mastery profiles in the test’s predefined skills and to illustrate the relationships among the attributes involved in the test to capture the consequence of hierarchical teaching of skills and attributes on increasing the likelihood of providing an item with a right answer. The results showed although the G-DINA fits the model better than HDCMs, some attributes of reading comprehension are mastered only when the prerequisite attributes have been mastered which highlights attribute dependencies among subskills. However, researchers should be notified that assuming hierarchical relationships among attributes needs longitudinal-design studies, and a one-shot study like the present is not sufficient to hypothesize the presence of a hierarchy of relationships among attributes.
The study’s findings can be helpful for test-takers, educators, syllabus designers, and curriculum developers as they can compare test-takers performance on a test and study their skill mastery profiles and emphasize more on the attributes whose mastery might lead to correct responding to the reading items more than other subskills. Moreover, remediation plans can concentrate on getting test-takers to work on the non-mastered subskills in sequential order.
An interesting line of further research should focus on think-aloud protocol for Q-matrix construction. Also, some other test-takers biodemographic features such as age, as well as the test’s format (e.g., comprehension question, matching question, multiple-choice items) can be considered using DIF.
Footnotes
Declaration of Conflicting Interests
The author(s) declared no potential conflicts of interest with respect to the research, authorship, and/or publication of this article.
Funding
The author(s) received no financial support for the research, authorship, and/or publication of this article.