
Abstract
Energy poverty, defined as the inability of households to afford adequate heating or cooling, is worsened by anthropogenic climate change, leading to increased energy demand and indoor comfort challenges. This study addresses a gap in summer fuel poverty research by focusing on overheating concerns and energy subsidies. This study defines the indoor temperature and overheating risk of low-income households compared with general dwellings based on field measurements and walkthrough surveys. The difference in indoor temperature and overheating risk according to the provision of energy subsidy is analyzed. We evaluate the impact of energy subsidies on indoor temperature and the adequacy of current subsidy programs. Findings show that households without energy vouchers experience indoor temperatures around 29°C, while voucher recipients see a 2°C decrease. During Tropical Night periods, households with energy vouchers maintain similar indoor temperatures to the overall period, while those without vouchers tend to experience a 2°C increase. Although energy vouchers significantly mitigate overheating risks by approximately 95% during the summer, they are not as effective in fully eliminating summer overheating risks compared to previous winter results. This highlights the persisting issue of traditional policies providing integrated electricity subsidies. Hence, addressing indoor overheating during hot summers requires improvements in alternative subsidy distributions or cooling strategies warrants change to the energy voucher payment method or the cooling method.
Introduction
The world is facing extreme weather events as a result of climate change; in particular, several countries have been experiencing more frequent and intense heatwaves (Füssel, 2017; Thomson et al., 2019; Robine et al., 2018). The increased outdoor air temperatures and heatwaves are elevating air-conditioning demands, resulting in increased energy consumption. Low-income households that cannot afford air conditioning are vulnerable to heat-related challenges, one of which is energy poverty. Thermal discomfort experienced by those living in energy poverty can negatively affect physical and mental health (Galvin, 2015; Grey et al., 2017; Liddell & Morris, 2010; Marmot, 2011; Oreszczyn et al., 2006; Paravantis & Santamouris, 2016; Rudge & Gilchrist, 2005; Santamouris et al., 2014; Webb et al., 2013), and exacerbate medical conditions such as respiratory and cardiovascular diseases (Jevons et al., 2016; Marmot, 2011; Rudge & Gilchrist, 2005, 2007; Webb et al., 2013). Research on cooling-related energy poverty is in its infancy (Thomson et al., 2019), as fuel poverty disputes tend to dominate discussions on adequate heating (Choi et al., 2022; Galvin, 2015; Milne & Boardman, 2000; Santamouris et al., 2014; Thomson et al., 2019). Therefore, recent studies (Kim, 2015; Moore, 2012; Park et al., 2019) have defined energy poverty in a broader scope, encompassing households lacking sufficient energy to maintain their homes (e.g., for heating, cooling, cooking, and lighting) and to fully participate in societal activities and practices. This study chose Korea as the study area as 10% of Korean households are classified under fuel poverty (Galvin, 2015; Thomson et al., 2019).
Various subsidies and home retrofitting support (energy efficient refurbishment) programs for low-income households have been broadly adopted in many countries (Lee et al., 2019; Yoon et al., 2019), and building retrofit programs (Park et al., 2019), bill discounts (cooling and heating energy vouchers) (Kim, 2015; Yoon et al., 2019), and free installation of cooling systems are frequently used as energy welfare policies for energy poverty in Korea. The value of the energy voucher is included in the energy bills during the heating and cooling seasons. The deductions are determined based on the family size. An approximate subsidy amount of US$5 for the summer season is applied for a person living alone, US$8 for a household with two persons, and US$11 for a family of three or more persons (Korea Energy Agency, 2022).
In our previous research, heating energy subsidies for low-income households through energy vouchers succeeded in maintaining an appropriate indoor temperature during winter; and the energy consumption increased owing to prolonged usage of heating systems (Choi et al., 2022). For households receiving subsidies through energy vouchers, the conflict between improvement in the indoor thermal environment and energy savings is highly likely to exist at similar levels in both winter and summer.
This study analyzes the indoor temperature of low-income households in summer using field measurements and the effect of energy vouchers on the summer indoor thermal environment. The indoor temperatures of low-income households was compared with those of general households. The indoor temperature and risk of overheating with or without the energy subsidy for low-income households were evaluated. The results of this study will help evaluate the adequacy of the current energy subsidy program.
Methodology
Field Measurement
The summer indoor temperature characteristics of low-income and general households in the same region were analyzed using field measurements and personal in situ surveys for the same period. The analyzed apartment complex is a government owned rental apartment for low-income households located in the Gyeonggi region in Korea. Based on the eligibility criteria for occupancy of apartments mandated by the Korean government for low-income households (Jin & Lee, 2013), the residents of the target apartment complex are facing energy poverty. The apartment complex was constructed in 1993 with 1,240 households. Two-hundred-and-twenty additional units were built in 2013 (Choi et al., 2020). An apartment complex constructed in 2003 in the same region was considered the general apartment unit. These complexes were built in accordance with the building design code for energy saving in Korea (Korea Energy Agency, 2017). The thermal performance of building envelopes is illustrated in Table A.1 (Korea Energy Agency, 2017). All households of one dwelling type had the same floor plans (Figure 1).

Floor plan and measurement configurations of the target (a) low-income households, and (b) general dwellings.
Field measurements were conducted during the summer season from August 3rd to September 4th, 2019. Outdoor and indoor temperatures of each unit were measured at 10 minute-intervals. A data logger, with an accuracy of ±0.4°C, was used to simultaneously record the indoor and outdoor air temperature. Field measurements were performed, without controlling the real living conditions under which people resided, to investigate the indoor thermal characteristics of the analyzed households in summer. Sensors are usually installed at the center of the room; however, loggers were installed on a shelf, approximately 1,100 mm above the floor to avoid disturbing the occupants and prevent the direct heating or cooling effect, which can trigger the rapid temperature changes.
Among the 27 households that consented to the field measurement and survey, four were excluded from the analysis as they had different lifestyle patterns, such as occupancy or ventilation schedule, energy subsidy, and air-conditioning usage characteristics. Consequently, field measurements and surveys were performed for 23 households in 13 low-income and 10 general dwellings. The proportion of households receiving energy voucher benefits in the analyzed low-income apartment complex, which consists of approximately 1,460 households, is around 40%. Additionally, among all low-income households participating in this study, the percentage of those receiving energy vouchers is also approximately 40%, indicating a similar distribution. Trained surveyors regularly visited the households to retrieve the recorded data sets and survey the information influencing indoor temperature of low-income households. A brief on-site questionnaire was conducted to gather information on the cooling method, age of the residential buildings, Thermal Sensation Vote (TSV)—measured on a scale from −3 (cold) to +3 (hot)—and the effectiveness of cooling energy vouchers during the measurement period (Figure A.1). Personal and private information of the occupants, such as number per household, age, occupancy, and ventilation schedule, was also gathered. To analyze the impact of households' dwelling characteristics on indoor average temperature, T-test from analysis of variance (ANOVA) was performed.
Overheating Criteria
Adaptive Approach
The two types of approaches for quantifying the overheating risk of free-running homes are fixed and adaptive. An adaptive approach was selected for analyzing the monitored data, because the fixed approach did not consider the acclimation of building occupants to warm climates; that is, the upper temperature limit for overheating remained constant and did not change with the ambient temperature (Craig & Butcher, 2005, 2006; Laouadi et al., 2020; Lomas & Porritt, 2017).
The adaptive approach led to the development of two primary standards related to it: the European Standard EN15251 (British Standards Institute Staff and British Standards Institution, 2007) (renamed EN16798 (EN 16798-1:2019, 2019) in 2017) and ANSI-ASHRAE 55 (ANSI/ASHRAE Standard 55, 2024) adaptive standard. The adaptive approach was developed for naturally ventilated conditions, where the thermal environments of the space were controlled by the occupants by opening and closing the window. Adaptive standards were frequently applied for free-running homes and mixed-mode indoors, such as residential buildings that intermittently operated air conditioners (De Dear, 2007; Pfafferott et al., 2007; Wagner et al., 2007).
ASHRAE 55 and EN 16798 employ a similar form of equation with marginally different coefficient values to predict the comfort temperature limits in relation to outdoor conditions. However, databases of the two standards differ in terms of geographical scope, building type, and estimation of neutral temperature. The ASHRAE 55 (ANSI/ASHRAE Standard 55, 2024) database covers various countries including Australia, East Europe, and Southeast Asia. In contrast, the EN 15251 standard (British Standards Institute Staff and British Standards Institution, 2007) is based on data sets from the European Smart Controls and Thermal Comfort (SCAT) project. Questionnaires for the ASHRAE standard were conducted in various naturally ventilated buildings, including residential buildings, whereas the SCAT project focused only on office buildings. The ASHRAE database has an adequately wide scope to establish statistically significant regression models. In contrast, EN 15251 employs Griffiths’ model, which has several limitations (Sánchez et al., 2017).
Based on this theoretical background, we selected the adaptive approach to quantify overheating. In addition, we employed ASHRAE 55 as the analysis criteria because the investigated building is for residential purposes and is in Asia (Republic of Korea).
Threshold Temperature: ASHRAE 55:2017
The input variable of the adaptive model in ASHRAE 55 (American Society of Heating, Refrigerating and Air-Conditioning Engineers, Inc., 2017) is the prevailing mean outdoor air temperature

where
Based on the calculated


where

where
Differences between the
Assessment of Overheating Risk: CIBSE TM 52
The assessment approach on ASHRAE 55—based simply on the percentage of occupied hours outside a certain benchmark—does not include the intensity of occupants’ discomfort. Moreover, it prescribes no limits to the acceptable deviation (Lee & Steemers, 2017; Nicol et al., 2009; Rahif et al., 2021; Spires, 2011). As an additional criterion, CIBSE TM 52 (Nicol, 2013) was selected to consider the severity of overheating among the standards proposed thus far and clearly define the acceptability of overheating (Rahif et al., 2021). CIBSE TM 52 (Nicol, 2013) introduced a method consisting of three criteria. These criteria, when combined, regulate a relatively holistic approach for assessing the overheating risk. A space or building that fails on any two criteria is classified as overheated. The first criterion is hours of exceedance (

where the weighting factor
CIBSE TM 52 (Nicol, 2013) provides the daily absolute maximum air temperature of a space, beyond which the level of overheating is unacceptable.
Results and Research Findings
Surveyed Results
Survey of Basic Information
Table 1 lists the basic information of the low-income households that participated in the field measurement and survey. Among the analyzed low-income households, approximately 38.5% received energy vouchers and 61.5% did not. This is similar to the proportion of households that received vouchers across all households of target low-income apartment complex. Approximately 84.6% of low-income households are defined as a small size family consisting of two or fewer family members. Approximately 92.3% of low-income households consist of family members older than 60 years. Having a family member older than 60 years significantly increases eligibility for low-income rental households run by the Korean government. Conversely, in the case of general dwellings, 50% of households consist of four or more members, and none of the households surveyed received energy vouchers. This is because they did not qualify for energy vouchers and do not have difficulty paying bills for cooling and heating energy.
Overview of the Surveyed Basic Information.

Note. N = No; Y = Yes.
The results indicate that approximately 30.8% of surveyed low-income households live without an air conditioner (cooling system). Even low-income households equipped with cooling systems rarely used air conditioners. However, all surveyed general households had air conditioners. Furthermore, approximately 60% of general households owned two or more air conditioners.
The TSV of low-income households was surveyed with an average of 2.42. That is, residents of low-income households informed that their houses were hot. The average TSV of low-income households receiving vouchers was 2.0. This is marginally lower than the TSV of households that did not receive vouchers (2.38). However, the residents of general households provided an average TSV of 0.6, demonstrating that they lived in a relatively cool indoor environment. Two out of ten households voted that the indoor environment was cold.
In summary, the energy subsidy contributes to the indoor environment of low-income households in summer but does not provide thermally satisfactory conditions.
Survey on Occupancy and Ventilation Schedule
In our previous research (Choi et al., 2022), it was reported that the tendency of the occupants’ schedule (low-income dwellings) appeared to be relatively constant compared to the proposed occupancy schedule in ASHRAE (ASHRAE Project Committee 90.1, n.d.), and its fraction was consistently higher. This means that the residents of low-income households spend a relatively high proportion of their time at home because residents of public low-income rental apartments are not engaged in full-time economic activities.
Similar to the survey results from the winter season, the results from the summer season show that the occupancy schedule of low-income households is different from that of general households (Figure 2a). Low-income residents spend more time indoors than the residents of general dwellings. Furthermore, low-income residents mostly ate lunch outdoors and visited the social welfare center in the apartment complex to escape the extreme heat. Table 1 contains information on the use of welfare centers by low-income households, confirming that approximately 53.9% of the surveyed households visit welfare facilities.

Low-income households versus general dwellings. (a) Occupancy schedules. (b) Ventilation schedules.
Ventilation schedules also significantly differed with the dwelling type (Figure 2b). As few low-income households had air conditioning, most of them opened windows and doors for ventilation. However, the ventilation schedule for general households is significantly sparser than that of low-income dwellings. This may be because of the operation of cooling systems. Therefore, low-income and general households have distinct occupancy and ventilation schedule characteristics.
Field Measurement results
Analysis of the Outdoor Temperature
The average outdoor temperature for the measurement period was approximately 26.56°C. The highest temperature was approximately 36.5°C, which is more than the reference outdoor temperature (31.2°C) calculated for the cooling load provided in the building code for energy saving in Korea (Ahn et al., 2014). The measurement duration corresponds to hot days in Korea, and the measurement results are suitable for analyzing the indoor temperature characteristics and overheating risk of low-income households in summer.
We focused on room temperature in extreme weather conditions, such as tropical nights (TN), as nighttime temperatures in summer affect sleep comfort (Ha et al., 2012). TN is generally defined as the minimum nighttime temperature exceeding the critical range (Alexander et al., 2006; Trenberth et al., 2007). In Korea, TNs occur when the daily minimum and maximum outdoor air temperatures exceed 25°C and 30°C, respectively (Heo & Kwon, 2007). Five days corresponded to a TN during the measurement period.
Figure 3 illustrates the indoor temperature threshold of 80% of the upper and lower limits for the daily average outdoor air temperature and prevailing mean outdoor air temperature during the measurement period based on ASHRAE 55 (American Society of Heating, Refrigerating and Air-Conditioning Engineers, Inc., 2017). Comfort indoor operative temperature is based on the prevailing mean outdoor air temperature and is defined as a maximum and minimum of 20.80°C and 29.53°C, respectively.
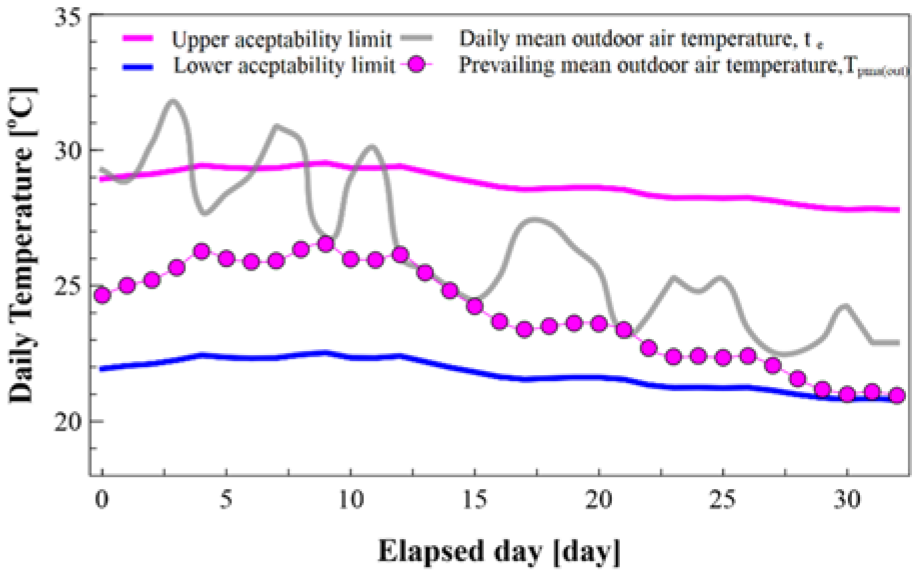
Daily basis average outdoor air temperature, exponentially weighted running mean outdoor air temperature, and thresholds for comfortable indoor temperature.
Comparison of the Indoor Temperature by Dwelling Characteristics
The indoor thermal environment analysis of energy poverty of an existing study measured and discussed the temperatures of the bedroom and living room separately (Choi et al., 2022; Oreszczyn e al., 2006). In addition, the data sets (indoor temperature and relative humidity) were analyzed and discussed by dividing them into two periods; day- and nighttime (Oreszczyn e al., 2006). In the case of general dwellings, the measurement results were divided into daytime (8:00–20:00) and nighttime (20:00–8:00). The results from the living room during the daytime and the bedroom during the nighttime were analyzed. However, in the analyzed low-income households, living rooms and bedrooms were integrated into an open-plan type. Therefore, the results measured at one point of the room throughout the day were used for the indoor temperature analysis of low-income households.
The hypothesis testing for the average temperature results monitored during the summer months are reported in Table 2. The variation in the indoor temperature for each house during the measurement period is depicted in Figure 4. The significance level was set at 0.05. Therefore, if the p-value was above .05, the association or effect was found to be statistically significant (Ghahramani et al., 2016). If the p-value was in the range from 0.05 to 0.001, the evidence was weak (Gui et al., 2020). If it was below 0.001, the evidence was strong.
Relative Changes in Indoor Temperatures and p-Values According to the Dwelling Characteristics.

Energy voucher-unsubsidized dwellings.
p < .05, **p < .001.
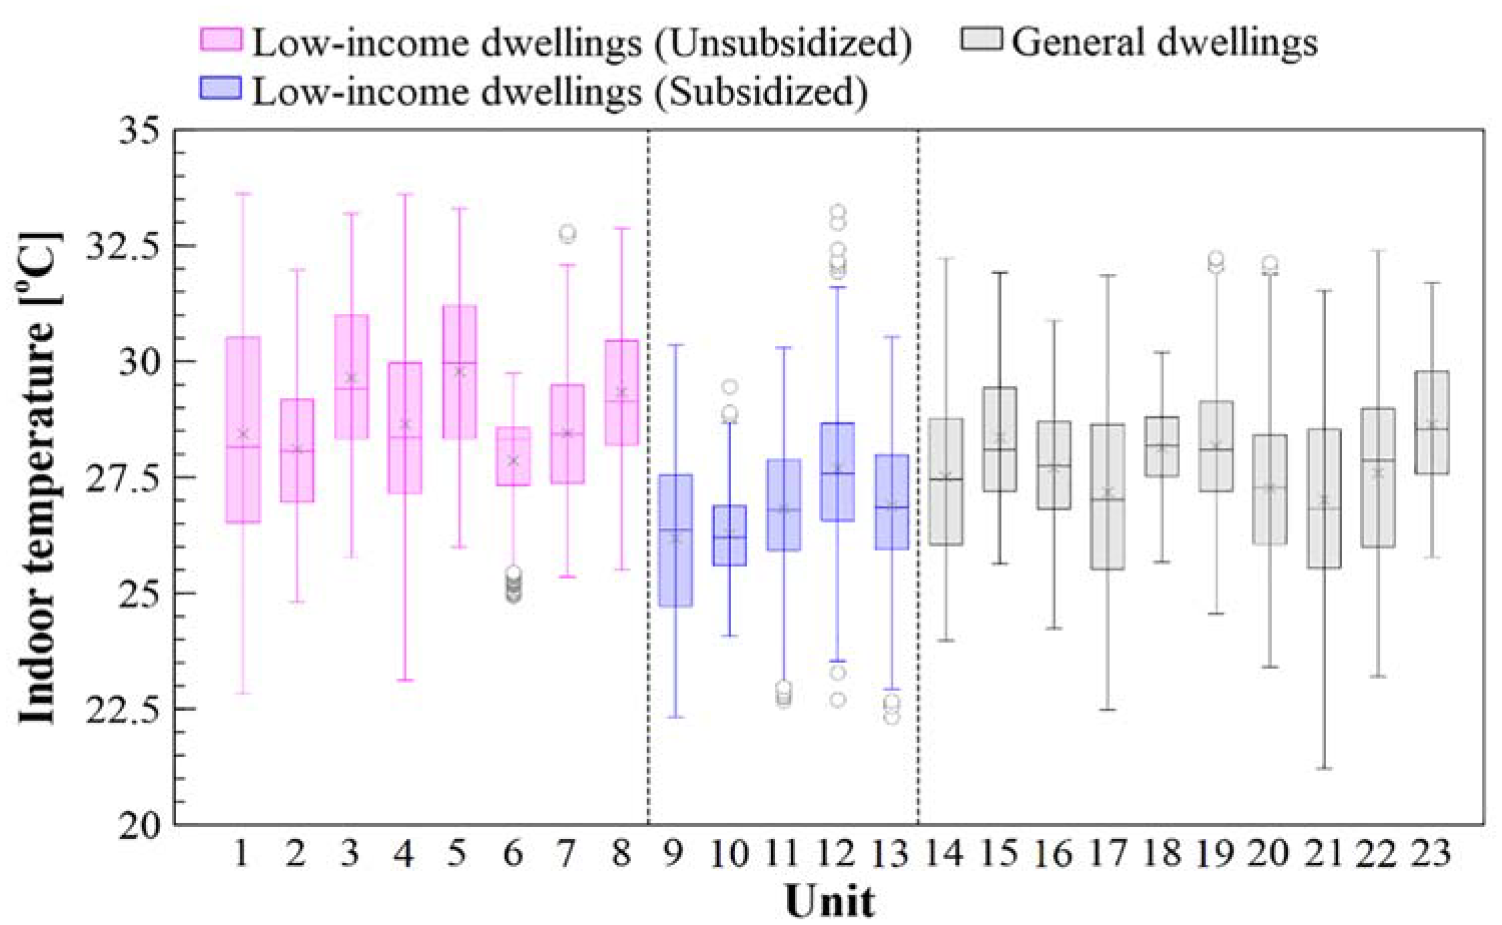
Box plot of indoor temperature of the analyzed households.
As illustrated in Figure 4, although the temperature distribution range by household is large, the temperature is higher in the following order: low-income households not receiving energy vouchers, general households, and low-income households receiving energy vouchers. In the case of low-income dwellings, households that were not recipients of energy vouchers were found to have statistically significantly higher mean daily temperatures (approximately 2.01°C) than those that did (p < .001). This could be interpreted in the same context as the research findings of our research group's previous study (Choi et al.,2022), suggesting that the subsidy for energy vouchers among low-income household residents has a significant impact on the increase in indoor temperatures during the winter season. The daily average indoor temperature slightly increased with the number of occupants in low-income households (p < .05). This is because the internal gain increased with the number of family members. In addition, these households were mostly free-running. In contrast, the indoor temperature was approximately 0.59°C lower in general households with a low resident density (p < .001) because the air conditioners were operated. In addition, the property age, which is directly related to the thermal performance of a building, did not affect the indoor temperature change by household, because many households kept windows and doors open 24 hours. Therefore, the effect of indoor temperature on the age of the buildings in low-income households was excluded from the analysis.
Moreover, the comparison of the indoor temperatures of low-income households that did not receive energy vouchers and general households, revealed a significant difference between the two (p < .001), demonstrating an average temperature difference of approximately 1.05°C. Among the dwelling characteristics examined, the cluster exhibiting the lowest indoor average temperature is not general households but low-income households receiving energy vouchers
As depicted in Figure 5, the temperature distribution status is compared for three groups: low-income households that do not receive the energy subsidy, low-income households that receive the energy subsidy, and general households. The results of the measurement period and the 5 days corresponding to a TN are described separately.

Indoor temperature distribution during the measurement period and the 5 days corresponding to the tropical night for all defined groups.
Those low-income households that did not receive energy vouchers had an average indoor temperature of 28.78°C. During the TN, the indoor temperature was distributed at a relatively high level, with an average of 30.52°C and a maximum of 33.62°C. In this group, the indoor temperature was the highest in summer among the households participating in the experiment.
Conversely, in the case of low-income households receiving energy vouchers, the average indoor temperature during the entire measurement period was maintained at 26.77°C, and the indoor temperature only increased by 0.1°C during the TN. The average indoor temperature of general households was maintained at approximately 27.76°C during the measurement period and was marginally higher than that of low-income households receiving energy vouchers.
Assessment of Overheating Risk
Figure 6 illustrates the temperature difference (indoor temperature–upper 80% threshold line) for each unit. When the indoor temperature exceeds the acceptable level (indicated by the 80% threshold line), the temperature difference becomes negative, indicating overheating. On the contrary, if the temperature difference exceeds the 7°C range indicated by equations (2) and (3), which represents the difference between the upper and lower levels, it can be considered as overcooling. In addition, the cumulative distribution of temperature difference by dwelling type is illustrated in Figure 7 for comparing the degree of overheating by dwelling type. In the case of low-income households that did not receive energy vouchers, most of the temperature difference appeared in the negative section, that is, overheating (Figure 6). In addition, the cumulative frequency of overheating in these households was approximately 29.57% of the occupied hours (Figure 7).

Comparison of temperature differences between indoor temperature and upper threshold temperature by unit.

Comparison of the degree of overheating risk by dwelling type.
However, the frequency of indoor overheating was significantly reduced to 1.48% with the benefit of the energy voucher (Figure 7). In addition, the temperature differences of subsidized low-income households were located far from the point at which the difference was zero, indicating that the indoor thermal environment was relatively cool. In low-income households receiving energy vouchers, most of the summer months are spent maintaining adequate indoor temperatures, with a sparse occurrence of overcooling, estimated at about 2%. Through this, it was revealed that the provision of energy vouchers contributes to maintaining relatively adequate indoor temperatures during the summer months, but it does not lead to excessive operation of cooling devices. This exhibits somewhat different characteristics compared to the excessive operation of heating devices observed in previous study (Choi et al., 2022) on energy voucher provision in low-income households. This discrepancy is attributed to differences in the heat sources of cooling/heating devices. In the case of Korean apartments, heating is predominantly powered by gas, allowing for separate pricing on heating bills. In contrast, for cooling, electricity serves as the heat source, and usage is aggregated with various electric appliances such as TV, refrigerator, and rice cooker, each with varying power consumption, leading to combined charges. Consequently, it is speculated that residents may find it challenging to actively use air conditioning system, as the usage of cooling devices is grouped with other electric appliance usage, even with discounted electricity charges.
For general households, most proportions were distributed on a point at which the indoor temperature difference was less than 0, and the possibility of overheating was approximately 5.23%. Therefore, per the energy voucher payment, the possibility of indoor overheating in low-income households could be reduced by approximately 94.99%. In addition, the possibility of overheating in low-income households without subsidies was approximately 82.31% more than that of general dwellings.
Overheating by dwelling type was assessed based on CIBSE TM 52 (Table 3). Seven out of eight low-income households without energy vouchers were classified as overheated. Particularly, in the case of units 3 and 5, more than half of the occupied time corresponded to overheating (Criterion 1). In the case of low-income households receiving energy vouchers, most households passed the overheating criterion of TM 52. However, one unit (unit 12) among the five households was classified as overheated, despite receiving an energy subsidy. The maximum daily weighted exceedance (TM criterion 2), which describes the degree of overheating in unit 12, was 8.85. This exceeds the maximum daily weighted exceedance among general households (unit 2 = 8.21).
Overheating Assessment of Studied Households Using the Three Criteria of CIBSE TM 52.

P/F: Pass/Fail.
In summary, while energy subsidies can effectively mitigate most of the overheating issues in low-income households during the summer season, some households may remain vulnerable to a heightened risk of overheating. These trends reflect a chronic problem in the current energy subsidy programs. As summer energy vouchers discount the total electricity consumption, the subsidized low-income households may not desire to turn on the air conditioner to reduce the indoor temperature, while they may extensively use other electronic devices (e.g., televisions, refrigerators, and computers). Another possibility is that the cooling subsidies may have been insufficient for addressing energy poverty. Thus, the current energy welfare policy, in the traditional way of discounting electricity bills, cannot entirely solve the summer overheating problem of low-income households. Therefore, the current policies to prevent indoor overheating in low-income households must be reviewed.
Conclusions and Discussions
Existing research on fuel poverty has primarily focused on winter heating-related studies, with summer-related research often overlooked (Steadman, 1979). However, the summertime indoor temperature of low-income households is directly related to the mortality rate of humans (overheating). This study highlights the issues related to overheating and the energy subsidies implemented for combating energy poverty. Moreover, fuel poverty is a complex issue involving indoor temperature, energy subsidies, and energy-saving practices, necessitating a comprehensive approach to subsidy policies (Choi et al., 2022). However, existing research related to low-income households tends to focus on independent topics such as investigating the indoor thermal environment of energy poverty (Lee et al., 2017), energy policy (Kim, 2015; Lee et al., 2017; Podesta et al., 2021), or improving indoor thermal conditions through energy refurbishment programs (Kim et al., 2020). Overall, there is a gap in summer fuel poverty research that fails to comprehensively investigate the impact of cooling energy subsidies on indoor temperature and energy consumption in summer season. This study aims to fill that gap. Field measurements and in situ surveys were conducted to evaluate the indoor temperature of low-income households in summer, improvement in indoor temperature, and overheating according to the payment of energy vouchers. Twenty-three households comprising 13 low-income and 10 general dwellings were analyzed to evaluate the indoor temperature and risk of overheating.
Field measurements revealed that the indoor temperature of low-income households in summer showed a strong relationship with energy subsidies. For the low-income households that did not receive energy vouchers for the entire summer period, the average indoor temperature was 28.78°C. On a TN, the average indoor temperature increased by 1.74°C, highlighting the hottest indoor temperature among those of the investigated dwellings.
The average indoor temperature of households receiving energy vouchers decreased to 26.77°C. The average temperature increase was only 0.10°C during the TN, owing to the operation of the air conditioner. The general households maintained their indoor temperatures 1°C above that of the low-income households with energy subsidies.
The frequency of indoor temperatures exceeding the upper threshold was approximately 29.57% among low-income households without an energy voucher, approximately 1.48% among low-income households with an energy voucher, and approximately 5.23% among general households. This indicates that energy vouchers can significantly reduce the risk of overheating, with a potential reduction of approximately 94.99%. Consequently, the implementation of energy voucher subsidies effectively led to cooler indoor temperatures in low-income households during the summer.
However, despite receiving energy vouchers, one household was still classified as overheated at a level that cannot be dismissed for low-income households. Furthermore, unlike the characteristics observed during the winter season (Choi et al., 2022), where households receiving energy vouchers exhibit indoor overheating due to excessive operation of heating devices, during the summer months, patterns of overcooling were rarely observed. This is because the total amount of electrical energy deducted from the energy voucher includes electricity for other purposes in addition to cooling. Low-income households are less likely to turn on their air conditioners and are likely to tolerate high indoor temperatures but would use other electrical appliances.
The current energy welfare policy method, which defines the energy voucher amount by the number of family members and discounts heating (gas)/cooling (electricity) costs, causes challenges such as overheating in winter and summer. To guarantee the thermal comfort of low-income households—the original purpose of the energy voucher—their cooling systems or methods must be innovated rather than simply deducting the energy cost.
Supplemental Material
sj-docx-1-sgo-10.1177_21582440241290967 – Supplemental material for A Study of the Unexplored Aspect of Energy Poverty: Overheating Risk Analysis
Supplemental material, sj-docx-1-sgo-10.1177_21582440241290967 for A Study of the Unexplored Aspect of Energy Poverty: Overheating Risk Analysis by Younhee Choi, Doosam Song, Akihito Ozaki and Seungyun Baek in SAGE Open
Footnotes
Acknowledgements
Not applicable.
Declaration of Conflicting Interests
The author(s) declared no potential conflicts of interest with respect to the research, authorship, and/or publication of this article.
Funding
The author(s) received no financial support for the research, authorship, and/or publication of this article.
Data Statement
Data sharing not applicable to this article as no datasets were generated or analyzed during the current study.
Supplemental Material
Supplemental material for this article is available online.
References
Supplementary Material
Please find the following supplemental material available below.
For Open Access articles published under a Creative Commons License, all supplemental material carries the same license as the article it is associated with.
For non-Open Access articles published, all supplemental material carries a non-exclusive license, and permission requests for re-use of supplemental material or any part of supplemental material shall be sent directly to the copyright owner as specified in the copyright notice associated with the article.