
Abstract
This study examines regional price elasticities in electricity consumption to offer valuable insights for policymaking in electricity demand-side management in Japan. By employing a partial adjustment model and utilizing data from regional electric utilities, the study estimates regional electricity demand functions. The analysis reveals that, within the residential sector, the size of houses plays a significant role in explaining regional variations in price elasticity. Likewise, in the industrial sector, the presence or absence of private power generation facilities in firms significantly influences regional disparities in price elasticity. These findings hold substantial implications for enhancing the cost-effectiveness of electricity consumption regulations and policies.
Keywords
Introduction
Demand-side management (DSM) of electricity plays a pivotal role in realizing a decarbonized society. It serves as an initiative to enhance the stability and efficiency of an electricity system by empowering consumers to adjust the amount and timing of their electricity consumption, thereby mitigating peaks in electricity demand. This, in turn, alleviates strain on the power grid and curbs energy wastage. Additionally, DSM actively promotes the utilization of renewable energy sources while contributing to a substantial reduction in carbon dioxide emissions. The significance of DSM has garnered recognition from various international organizations, leading them to incorporate it into their energy policies (IEA, 2018; IRENA, 2019).
Controlling electricity prices constitutes a critical factor in effectively implementing DSM strategies (Galvis & Costa, 2016). Electricity prices serve as pivotal indicators influencing consumer electricity usage and timing. Higher prices incentivize consumers to adopt energy-saving behaviors and adjust their demand, making them more inclined to actively participate in DSM, particularly during peak periods. Conversely, lower electricity prices might lead consumers to increase their electricity consumption, undermining the effectiveness of DSM efforts. Therefore, careful management of electricity price fluctuations is crucial to facilitate demand shifting, alleviate power grid overloading, and reduce wasteful electricity usage.
To achieve successful DSM implementation, meticulous pricing strategies are necessary, necessitating the implementation of various policy measures. Consequently, the price elasticity of electricity demand emerges as a fundamental piece of information, forming the bedrock for informed DSM policymaking. This study specifically delves into this aspect from the perspective of regional science.
Electricity consumption patterns exhibit significant regional variations. Notably, electricity demand characteristics diverge across regions, with industrial and commercial areas experiencing higher daytime demand, while residential areas exhibit peak demand during nighttime hours. To effectively implement DSM strategies, a thorough analysis of demand characteristics in each region becomes essential, leading to the formulation of region-specific measures.
In industrial and commercial areas, the introduction of energy management systems proves prudent to curtail power consumption during peak hours. On the other hand, in residential areas, implementing a reward system becomes fitting to incentivize electricity usage during nighttime hours. Moreover, diverse factors such as economic conditions, climate, and electricity supply in each region interact uniquely with electricity demand, necessitating a nuanced approach. Successful DSM implementation in regional electricity markets mandates regional demand forecasting and demand response simulations, requiring policymakers to grasp the distinct regional electricity demand characteristics.
By accurately understanding regional intricacies, policymakers can anticipate shifts in electricity demand, facilitating the development of appropriate supply planning and pricing policies. In summary, a regionally tailored approach is pivotal to achieve effective DSM outcomes and foster sustainable electricity management.
Despite the significance of regional differences in electricity markets, most electricity economic analyses have historically overlooked this aspect. Prior studies have often pooled data from numerous regions and sectors to enhance analytical reliability, neglecting the consideration of regional variations in price and income elasticities (Burke & Abayasekara, 2018; Ros, 2017). However, considering the inherent diversity in electricity demand, it is logical to expect that price elasticity of electricity demand would indeed vary across regions.
Urban consumers, who utilize electricity for various purposes like transportation and building climate control, might display limited decreases in consumption in response to price increases. In contrast, rural consumers, who primarily use electricity for agricultural activities, might exhibit substantial reductions in consumption when faced with price increases. Regional characteristics, such as climate, culture, and price structures, are likely to influence price elasticity differently, thus warranting a deeper investigation, which this study aims to provide.
The novelty of this study lies in its specific focus on regional differences in price elasticity, an area often overlooked in previous research. By identifying regional characteristics of price elasticity, the study aims to furnish policymakers with practical information to inform decision-making processes.
To explore these regional differences in the electricity market, this study conducts an empirical analysis of Japan. Japan’s electricity system was regionally monopolized until 2016, with each electric power company holding a monopoly on electricity supply within its designated area. However, in 2016, deregulation measures eliminated voltage classifications, leading to the complete liberalization of the electricity market. Consequently, the regional monopoly status of existing electric power companies was dissolved. The period under examination in this study corresponds to the period when regional monopolies were in place. Hence, this unique historical context offers the opportunity to identify significant regional differences in the electricity market, enabling a precise examination of price and income elasticities and their influencing factors.
The paper’s subsequent sections are organized as follows. Section 2 provides a summary of previous research findings pertaining to the price elasticity of electricity demand. Section 3 outlines the model and data employed for the analysis. Section 4 presents the estimation outcomes of electricity demand functions and thoroughly analyzes the regional characteristics of price elasticity within both the residential and industrial sectors. Lastly, Section 5 presents the conclusions drawn from the study and discusses its policy implications.
Previous Research
Extensive analyses of electricity demand have been undertaken within the realms of economics and engineering. Beginning with seminal works by Fisher and Kaysen (1962) and Mont et al. (1973), researchers have primarily concentrated on discerning the intricate relationship between electricity prices and electricity consumption. These investigations often encompass pertinent variables like electricity prices, alternative goods’ prices, income levels, and climate conditions. In the field of energy engineering, a plethora of research findings have emerged concerning the variability of demand for renewable energy sources (Bhuiyan et al., 2022; Candila et al., 2021; Dincer et al., 2022; Goto et al., 2023; Li et al., 2022; Saqib et al., 2021). The empirical studies in electricity economics yield two key findings.
First, the price elasticity of electricity demand tends to be low. This is attributed to electricity being an essential commodity with limited substitutes. Particularly in the context of households and firms, finding complete substitutes for electricity consumption proves challenging, thereby constraining the extent of demand reduction in response to price increases. Although variations may arise in the results of previous studies due to differing subjects analyzed, time periods, and models employed, a meta-analysis generally confirms the prevailing low price elasticity of electricity demand (Espey & Espey, 2004; Zhu et al., 2018).
Second, the price elasticity of electricity demand exhibits variations based on consumers’ perceptions over time. For instance, if consumption remains relatively unchanged despite a price increase, price elasticity may decrease as consumers adapt to the higher prices. Conversely, if consumers explore alternative measures and the consumption decline for a certain period, this could increase the price elasticity. According to the outcomes of meta-analysis, long-term price elasticity tends to be more pronounced than short-term elasticity (Espey & Espey, 2004; Zhu et al., 2018).
The measurement of price elasticity of electricity demand employs both static and dynamic models. Static models ascertain price and income elasticities while assuming a long-run equilibrium. These models are often estimated using methods such as least squares (OLS), fixed effects (FE) models, or random effects (RE) models. These techniques have found widespread application in studies conducted in Europe and the United States (e.g., Azevedo et al., 2011; Cebula, 2012; Eskeland & Mideksa, 2010).
The dynamic model offers the flexibility to calculate short- and long-run price elasticities by relaxing the long-run equilibrium assumptions made in the static model (Houthakker, 1980; Houthakker et al., 1974). Two primary methods are commonly employed to estimate this model.
The first method involves utilizing a cointegration technique within an autoregressive distributed lag (ARDL) framework. In recent decades, this model has gained popularity in many countries because of increased access to reliable data over extended periods. Notable applications in the Asia-Pacific region include examples by Holtedahl and Joutz (2004), Narayan (2005), Narayan and Smyth (2005), and Nakajima (2010). Additionally, studies conducted in Europe by Hondroyiannis (2004), Halicioglu (2007), and Zachariadis and Pashourtidou (2007), as well as those carried out in the United States by Dergiades and Tsoulfidis (2008) and Nakajima and Hamori (2010), have demonstrated the applicability of this model. Furthermore, Ziramba (2008) has conducted a study in Africa utilizing the same approach.
One concern with the ARDL framework is its reliance on long time-series data to achieve accurate estimation results. As Baltagi (2013) states, this method demonstrates effectiveness primarily when applied to macro data, where a large number of samples (N) and a long time series (T) are available. Although the minimum required time series length has not been precisely defined, Pesaran et al. (2001) suggest that the ARDL framework performs well with an observation period of at least 30 years. Additionally, Pedroni (2001) and Costantini and Martini (2010) highlight that the ARDL framework might not yield robust outcomes with time series spanning approximately 20 years or less.
An alternative approach to ARDL analysis is the partial adjustment model (PAM), which proves effective when dealing with large cross-sections but relatively few observation periods. Several empirical studies have successfully utilized the PAM method. For instance, Bernstein and Griffin (2005), Kamerschen and Porter (2004), Paul et al. (2009), and Alberini and Filippini (2011) employed this technique to estimate electricity demand functions for various U.S. states. In the context of Japan and Korea, Okajima and Okajima (2013), Otsuka (2015), Otsuka and Haruna (2016), and Ryu et al. (2021) have also applied the PAM methodology to their analyses.
However, these previous studies have predominantly focused on analyzing the price elasticity of electricity demand using pooled and aggregated data for entire countries, regions, or sectors. To truly furnish practical insights to policymakers, an empirical analysis based on disaggregated regional data becomes imperative. Despite this need, empirical studies on regional electricity markets remain scarce in the existing literature. An apparent drawback of these prior studies is the lack of consideration for regional variations.
Thus, this study seeks to address this gap by analyzing the price elasticity of electricity demand at the regional level, utilizing data specifically from different regions in Japan. By employing regional data, this research endeavors to uncover significant regional disparities in price elasticities within both the residential and industrial sectors. Through a comprehensive discussion of the analysis results, this study aims to provide policy implications conducive to the effective implementation of DSM in regional electricity markets.
Material and Methods
Partial Adjustment Model (PAM)
This study employs a conventional partial adjustment model (PAM) to identify the electricity demand function. The formulation of the PAM in this study is rooted in the energy economy theory proposed by Nordhaus (1979). The energy demand good, denoted as X, is derived using Equation 1:

where
Equation 1 depicts a structure whereby the desired level of demand is determined based on prices and income (production) levels. However, the realized demand may not immediately match the desired level due to the adjustment process. For example, when electricity prices increase, consumers may choose to replace their appliances with more energy-efficient ones, leading to a time delay in the change of electricity demand due to consumer behavior. Similarly, in offices and factories, higher electricity prices may prompt firms to operate their power-generation facilities or adopt energy-saving production equipment, introducing a time lag in the process of achieving the desired demand level. The PAM accounts for this adjustment process.
The desired level of demand

Assuming that this adjustment to the desired demand level follows the Koyck-distributed lag, Equation 3 holds:

Substituting Equation 3 into Equation 2 yields Equation 4:

where
Taking the logarithm of Equation 4 yields the PAM in Equation 5:

where
Hence, the PAM serves as a valuable tool for understanding electricity demand dynamics as it moves toward a long-term equilibrium state. This facilitates the forecasting of future demand and enables the formulation of policies concerning demand changes. The model’s strength lies in its ability to shed light on the impact of electricity prices on demand in both the short and long terms. Moreover, it facilitates the evaluation of the overall impact of changes in electricity prices on demand, providing insights into the intricate relationship between prices and electricity consumption.
The empirical model employed in this study is defined by Equation 6, which builds upon Equation 5:
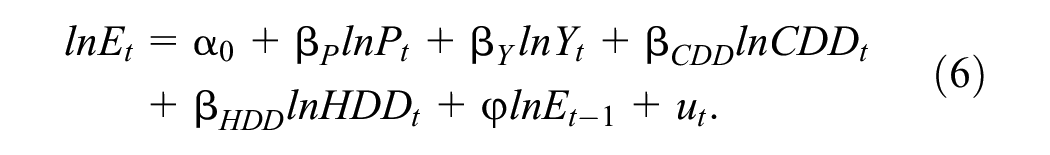
where
Data
The data utilized to estimate the electricity demand function comprised time-series data from 10 electric utilities collected between 1990 and 2015. Data on the electricity demand function can be found in Otsuka (2023a, 2023b, 2023c).
Table 1 presents the mean values and annual growth rates by region for the main variables in the electricity demand function. Notably, Hokuriku exhibited the highest residential electricity consumption, with the most substantial annual growth rate observed. Additionally, Hokuriku also recorded the highest industrial electricity consumption, primarily attributed to its significant concentration of energy-intensive pulp industry facilities. Across all regions, electricity consumption witnessed an overall increase in both residential and industrial sectors. Particularly noteworthy is the remarkable growth in electricity consumption in rural areas, surpassing that of metropolitan regions like Tokyo and Kansai.
Descriptive Statistics on Electricity Demand Function by Region (1990–2015).

Note. 1) Figures in the table are calculated per consumer unit. Figures for the residential sector are per household, and those for the industrial sector are per company.
2) CAGR is the compound annual growth rate.
3) Regional classifications are organized as follows: Hokkaido (Hokkaido); Tohoku (Aomori, Iwate, Miyagi, Akita, Yamagata, Fukushima, and Niigata); Tokyo (Saitama, Chiba, Tokyo, Kanagawa, Ibaraki, Tochigi, Gunma, and Yamanashi); Hokuriku (Toyama, Ishikawa, and Fukui); Chubu (Nagano, Gifu, Shizuoka, Aichi, and Mie); Kansai (Shiga, Kyoto, Osaka, Hyogo, Nara, and Wakayama); Chugoku (Tottori, Shimane, Okayama, Hiroshima, and Yamaguchi); Shikoku (Tokushima, Kagawa, Ehime, and Kochi); Kyushu (Fukuoka, Saga, Nagasaki, Kumamoto, Oita, Miyazaki, and Kagoshima); and Okinawa (Okinawa).
In terms of residential electricity prices, no significant regional differences were observed. Residential electricity prices experienced a decline across all regions throughout the observation period, with the most substantial decrease noted in Hokuriku.
Conversely, considerable regional differences were apparent in industrial electricity prices. While industrial electricity prices increased in Hokkaido, Tohoku, Tokyo, Chubu, Kansai, and Okinawa, they declined in Hokuriku, Chugoku, Shikoku, and Kyushu. The noteworthy decreases in electricity prices within both sectors likely played a role in the augmented electricity consumption observed in Hokuriku.
Regarding income trends, income levels exhibited a decline in all regions, with relatively significant decreases observed in Hokkaido and Kansai. Consequently, it is unlikely that income played a substantial role in contributing to increased electricity consumption. However, there was an upsurge in production value across all regions. Notably, the Tohoku and Chubu regions demonstrated relatively high rates of increase in production activity, likely explaining the concurrent rise in electricity consumption in these regions.
Results and Discussion
Results
In this study, the PAM was employed to estimate Equation 6. However, given that the PAM incorporates the lagged electricity demand as an explanatory variable, potential endogeneity issues arise. To address this concern, the instrumental variable (IV) method was adopted for the estimation of the PAM.
For the residential sector, the instrumental variables used comprised the one-period lags in the explanatory variables. Conversely, for the industrial sector, the instrumental variables consisted of the one-period lags of the explanatory variables, the number of firms, and the capital-labor ratio. These instrumental variables were carefully selected to mitigate endogeneity and enhance the robustness of the estimation process.
Table 2 presents the estimation results for the residential sector. The price and income variables fulfill the expected sign conditions across all regions. Notably, the price coefficients exhibit inelasticity, with absolute values below one in all regions. Similarly, the income coefficient also demonstrates inelasticity, with absolute values below one in all regions. This finding corroborates the notion that electricity is indeed a necessary good for consumers.
IV-Estimation Results of Electricity Demand Function in the Residential Sector.
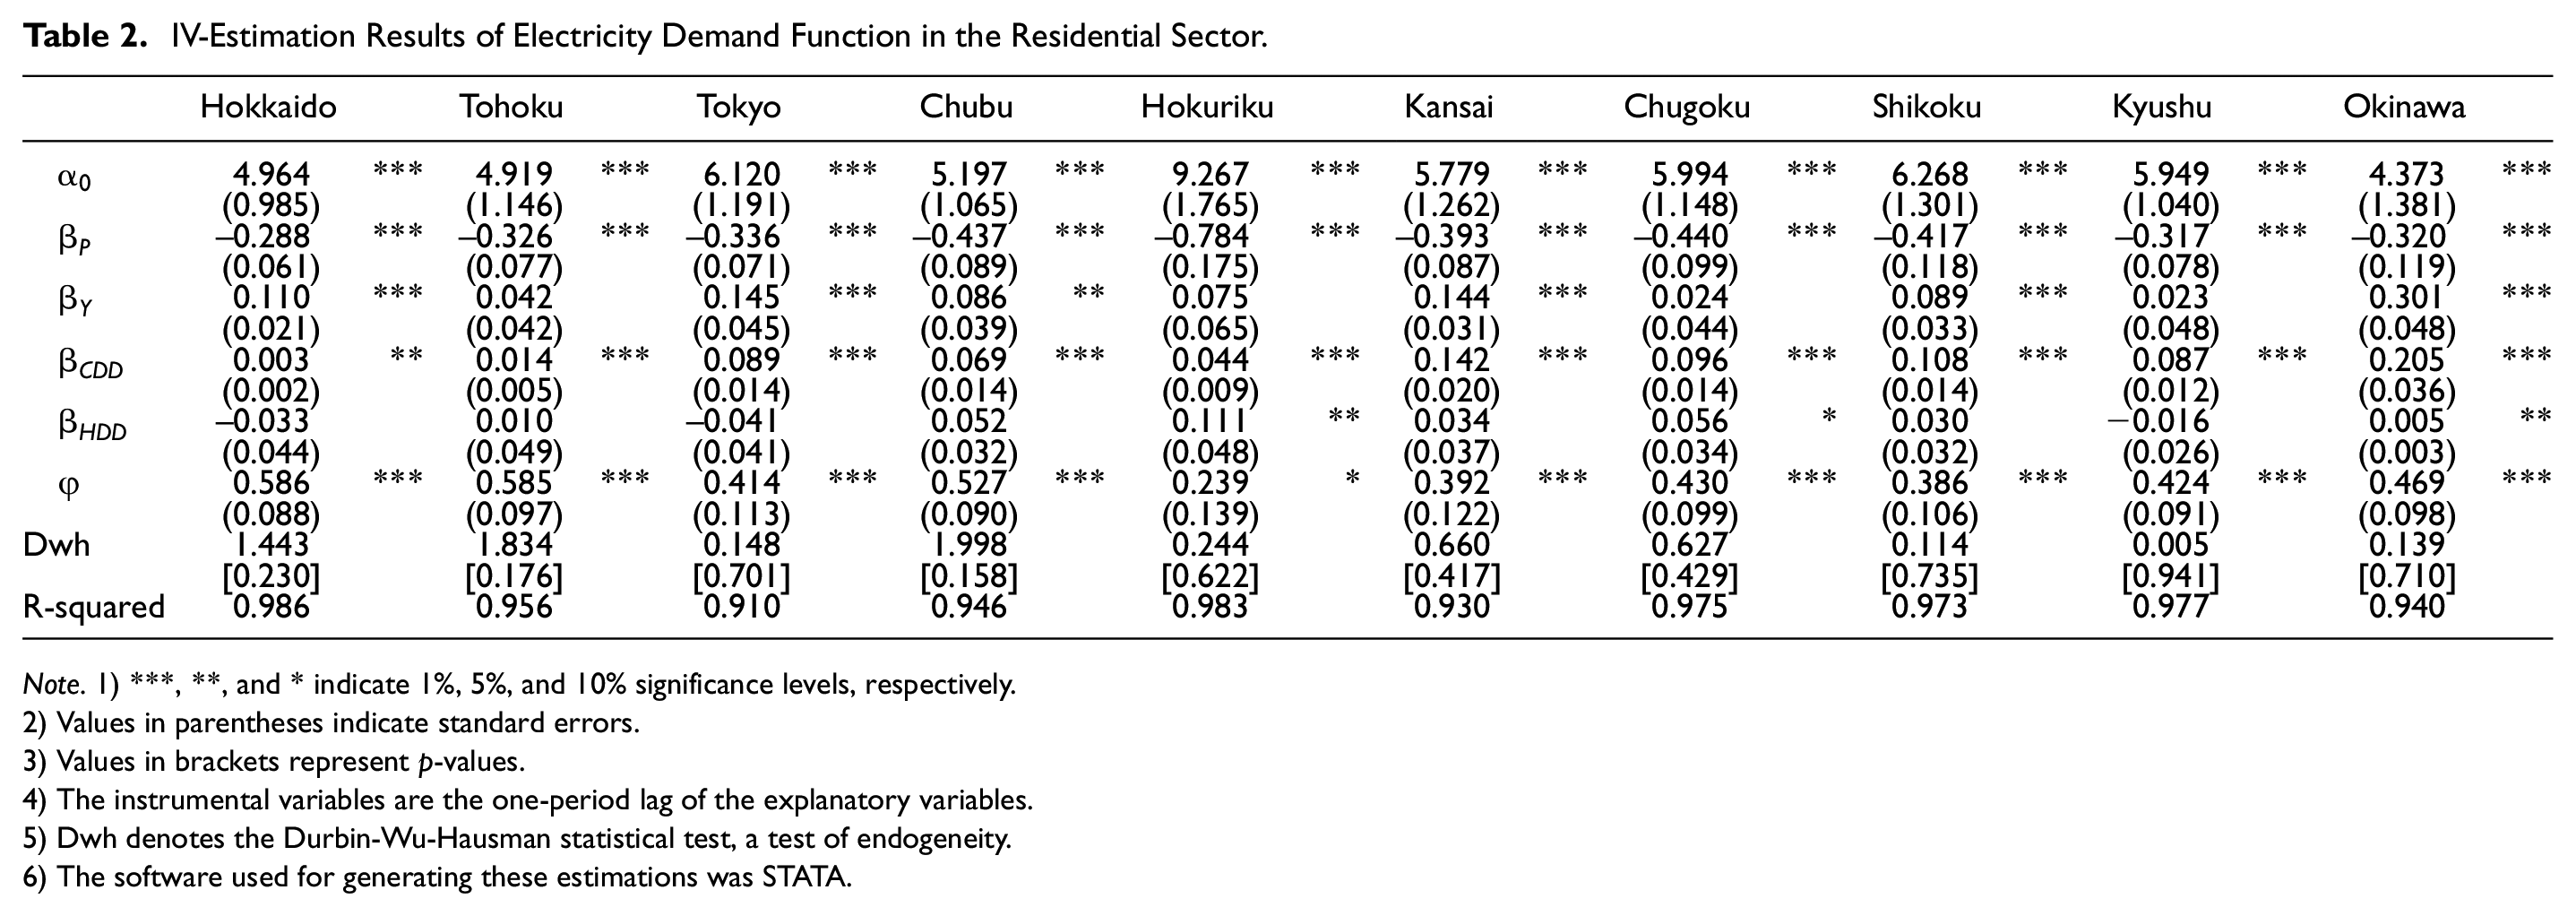
Note. 1) ***, **, and * indicate 1%, 5%, and 10% significance levels, respectively.
2) Values in parentheses indicate standard errors.
3) Values in brackets represent p-values.
4) The instrumental variables are the one-period lag of the explanatory variables.
5) Dwh denotes the Durbin-Wu-Hausman statistical test, a test of endogeneity.
6) The software used for generating these estimations was STATA.
Regarding the climatic factors, the coefficient for cooling degree days exhibits a positive and statistically significant relationship with electricity consumption in all regions. However, the coefficient for heating degree days is often insignificant and has minimal impact on electricity consumption in many regions. This can be attributed to the fact that in colder regions of Japan, heating needs are met predominantly using alternative energy sources such as kerosene and coal, rather than relying heavily on electricity. Hence, the limited use of electricity for heating purposes in these regions is reflected in the results.
The coefficient for the one-period lag in electricity demand is positive and statistically significant. This suggests that households consider past consumption when determining their current electricity usage. In other words, their current electricity consumption is influenced, at least partially, by their previous consumption behavior, indicating a habitual pattern of electricity consumption.
To examine the endogeneity of explanatory variables, the Durbin-Wu-Hausman statistical test was conducted. The results indicate that the null hypothesis “explanatory variables are exogenous variables” cannot be rejected at the 1% significance level. This indicates that the instrumental variables used in the estimation effectively address the endogeneity concern, further enhancing the reliability of the results.
Table 3 presents the estimation results for the industrial sector. Similar to the findings in the residential sector, the price coefficient displayed a negative and statistically significant relationship in many regions. Notably, the production coefficient exerted a positive impact on electricity consumption across several regions, and its effect was more significant than the price variable. This highlights the greater influence of production levels on industrial electricity consumption in these regions.
IV-Estimation Results of Electricity Demand Function in the Industrial Sector.

Note. 1) ***, **, and * indicate 1%, 5%, and 10% significance levels, respectively.
2) Values in parentheses indicate standard errors.
3) Values in brackets represent p-values.
4) The instrumental variables are the one-period lag of the explanatory variables, the number of firms, and the capital-labor ratio.
5) Dwh denotes the Durbin-Wu-Hausman statistical test, a test of endogeneity.
6) The software used for generating these estimations was STATA.
Regarding climate-related variables, the coefficient for cooling degree days was statistically significant in multiple regions, mirroring the results in the residential sector. Cooling demand in offices and factories primarily relies on air conditioning, which is electricity-driven. On the other hand, the coefficient for heating degree days was generally not statistically significant in most regions. Industrial heating demand is typically met using non-electric sources like gas and oil, leading to minimal impact on electricity consumption from heating degree days.
In line with the residential sector, the coefficient for the one-period lag in electricity demand was positive and statistically significant across all regions. This indicates that firms’ current electricity consumption decisions are influenced by their past consumption behavior, suggesting habitual patterns of electricity usage.
The Durbin-Wu-Hausman statistical test for examining the endogeneity of explanatory variables verified that the instrumental variable method adequately addressed the endogeneity concerns in the industrial sector, further reinforcing the credibility of the estimation results.
Table 4 and Figures 1 and 2 present the regional price elasticities for each sector, derived from the findings in Tables 2 and 3. The elasticities within each sector are consistent with those observed in prior studies, namely, Okajima and Okajima (2013), Otsuka (2015), Otsuka and Haruna (2016), and Wang and Mogi (2017).
Regional Price Elasticity of Electricity Demand.
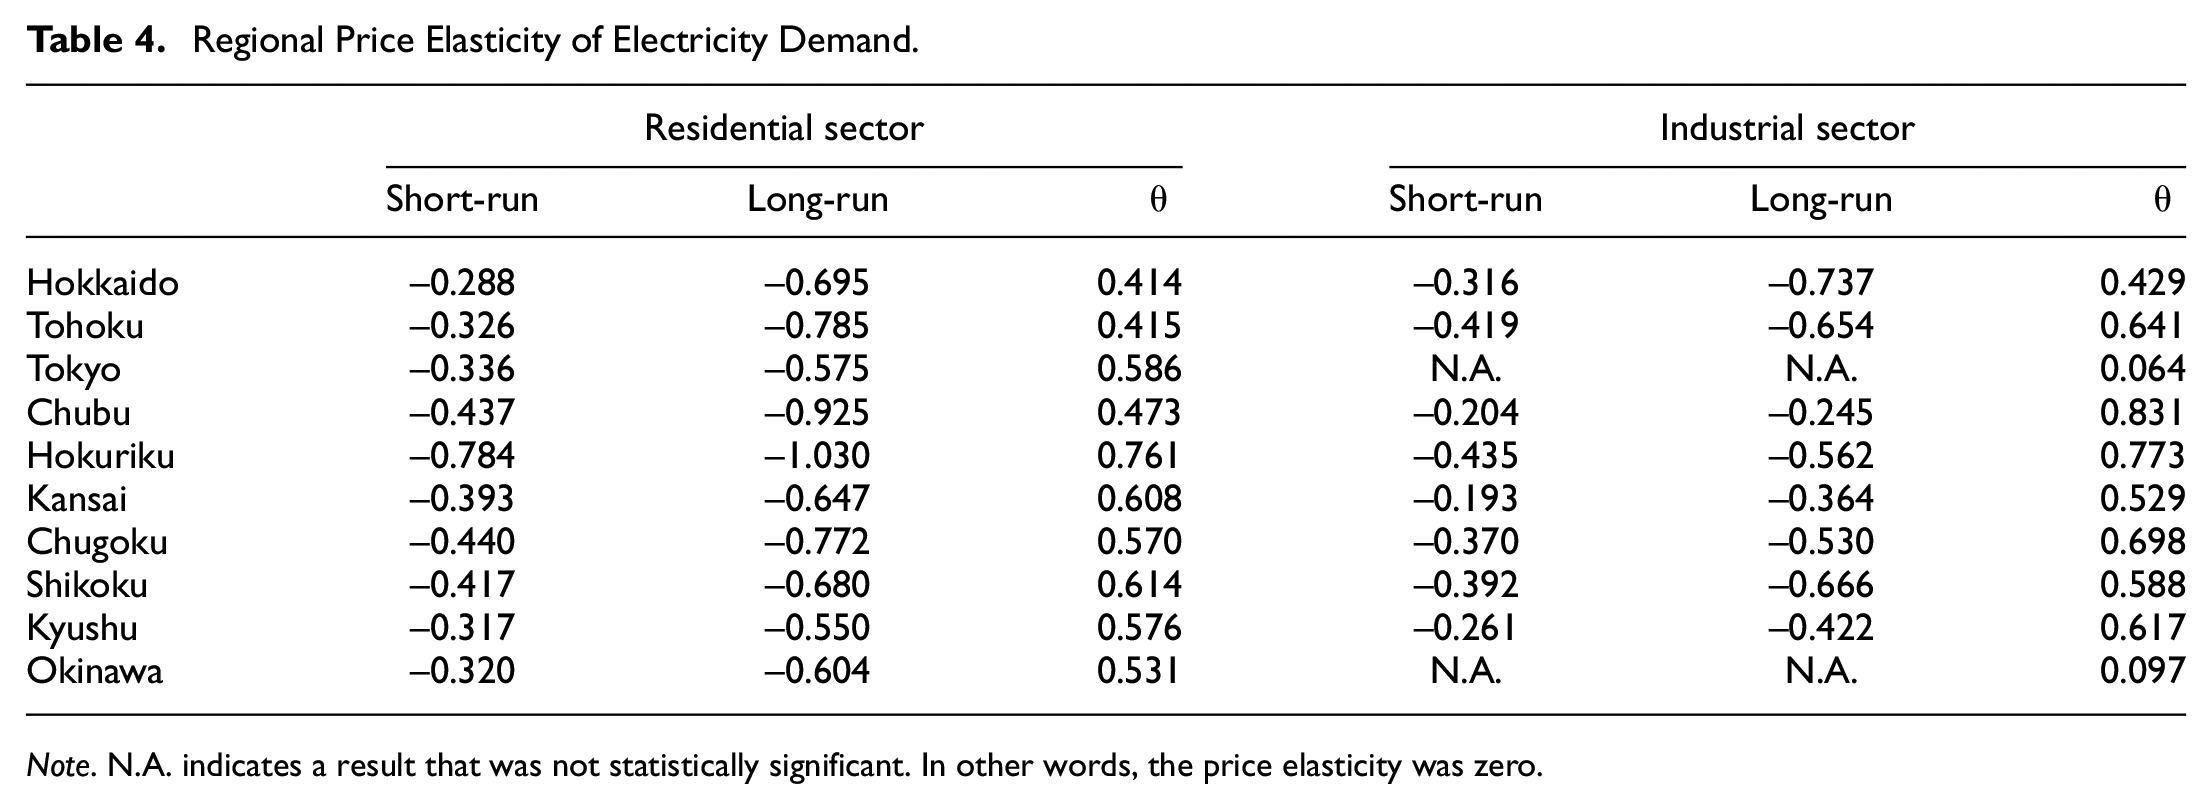
Note. N.A. indicates a result that was not statistically significant. In other words, the price elasticity was zero.

Regional price elasticity of electricity demand in the residential sector.

Regional price elasticity of electricity demand in the industrial sector
In the residential sector, short-term price elasticity ranged from –0.288 (Hokkaido) to –0.784 (Hokuriku), revealing significant regional variations. Similarly, long-term price elasticity ranged from –0.550 (Kyushu) to –1.030 (Hokuriku), demonstrating notable differences across regions. Remarkably, the Hokuriku region exhibited the highest price elasticity in both short and long-run, indicating substantial fluctuations in consumption in response to price changes.
Within the industrial sector, short-term price elasticity ranged from –0.193 (Kansai) to –0.435 (Hokuriku), indicating regional differences in this sector as well. Long-term price elasticity of electricity demand varied significantly, ranging from –0.245 (Chubu) to –0.737 (Hokkaido). Tokyo and Okinawa, however, had an elasticity of zero, as the price coefficient was not statistically significant in estimating the electricity demand function in these regions.
The adjustment coefficient (
Discussion
Based on the results of the price elasticity measurements presented in Table 4, Figures 1 and 2, we can now explore the regional characteristics that contribute to the observed interregional differences in price elasticity.
In the residential sector, the Hokuriku region stands out with significantly higher price elasticity, and exhibits a faster adjustment toward long-run equilibrium. This phenomenon can be attributed to the housing size prevalent in the Hokuriku region, as indicated in Table 5, which displays the total floor space per dwelling and the number of households in each region. The Hokuriku region records a large total floor space per dwelling, indicative of spacious houses with multiple rooms. In contrast to smaller one-room houses, larger dwellings offer more flexibility in altering electricity consumption patterns in response to changes in electricity prices. For instance, in a large house, all household members can easily congregate in one room to conserve electricity, fostering greater adaptability to price changes. Conversely, households residing in smaller and more constrained spaces may find it challenging to implement such collective energy-saving measures. As a result, the abundance of options for reducing electricity consumption in the Hokuriku region, driven by the prevalence of larger houses, contributes to its higher long-term price elasticity.
Housing Attributes by Region in Japan.

Source. Housing and Land Survey (Y2018) and Ministry of Internal Affairs and Communications.
Similar trends can be observed in other regions like Tohoku, Chugoku, and Shikoku, where houses also tend to have larger floor spaces, presenting significant potential for electricity reduction. Consequently, the long-term price elasticity is likely to be more significant in these regions as well. These findings underscore the importance of considering housing characteristics when formulating effective electricity demand management policies for different regions.
Regional differences in price elasticity in the industrial sector are closely linked to the availability of on-site power generation facilities in each region. Table 6 illustrates the ratio of on-site power generation to total electricity consumption in each region. Regions such as Hokkaido, Tohoku, Chugoku, and Shikoku exhibit high ratios of on-site power generation, indicating that these regions have more flexibility to adjust the amount of electricity purchased using their in-house power generation facilities in response to fluctuations in electricity prices. Consequently, these regions are likely to have higher long-term price elasticity.
Ratio of On-Site Power Generation to Total Electricity Demand.

Source. Electric Power Investigation Statistics, METI.
Note.
1) Largest share Industry refers to the industry with the largest local on-site power generation share.
2) Industry abbreviations are as follows: PULP = Manufacturing of pulp, paper, and processed paper products; CEMI = chemical industry; STEEL = steel industry.
The regional disparities in on-site power generation ratios are also influenced by the industrial structure in each area. For instance, the Chugoku and Shikoku regions boast numerous petrochemical complexes and chemical industries, where a concentration of on-site power generation facilities is observed. This concentration contributes to higher price elasticity in these regions. Similarly, Hokkaido and Tohoku, which are known for their significant presence of pulp, paper, and steel industries, have relatively sizable in-house power-generation facilities, leading to higher price elasticity in these regions as well. These findings underscore the significance of considering the region’s industrial structure and the extent of in-house power generation facilities to accurately forecast electricity consumption in response to fluctuations in electricity prices.
Conclusion and Policy Implications
Conclusion
Demand-side management of electricity plays a critical role in achieving a decarbonized society. To optimize electricity consumption reduction, it is essential to identify strategies that enhance electricity savings in various sectors. This study focuses on the potential for electricity consumption savings by implementing electricity price changes based on the price elasticity of electricity demand in the residential and industrial sectors of regional electricity markets in Japan. We estimated electricity demand functions for each electricity supply region using the Partial Adjustment Model (PAM) and shed light on regional variations in short and long-term price elasticities. Our findings can be summarized as follows:
First, consistent with prior research, we observed low price elasticities in both residential and industrial sectors across all regions in Japan. This result indicates that electricity, being a necessary good, shows minimal demand fluctuations in response to price changes.
Second, we identified significant regional differences in the price elasticity of electricity demand. In the residential sector, the size of a typical house in a region was linked to the regional price elasticity. In the industrial sector, the ratio of private power generation to total electricity consumption was closely associated with price elasticity.
Third, our study revealed that long-term price elasticity is higher than short-term elasticity, implying that adjusting electricity consumption to adapt to changes in electricity prices requires time. Moreover, regional disparities in adjustment speeds were observed due to differences in housing and industrial structures.
However, some analytical issues remain unexplored in this study. Notably, we did not address changes in price elasticity over time, which may occur due to shifts in national energy policies. For example, Otsuka (2023d) suggested that the 2011 catastrophe in Japan altered consumers’ electricity consumption behavior. To effectively implement DSM, it is crucial to identify time-series changes in the price elasticity of electricity demand. Future research could utilize the Kalman filter technique proposed by Wang and Mogi (2017) to examine more detailed time-series changes and factors influencing the price elasticity of electricity demand. This would provide valuable insights into the dynamics of demand-side management and enable policymakers to develop more targeted and effective strategies for promoting energy conservation and sustainable electricity consumption.
Policy Implications
This study sheds light on significant regional differences in electricity consumption behavior in Japan, highlighting the presence of diverse socioeconomic factors that affect electricity consumption patterns. For instance, variations in the structure of houses between warmer and colder regions significantly influence household electricity consumption behavior. Similarly, differences in electricity consumption patterns are evident between urban areas dominated by office buildings and rural areas with a focus on agriculture in the industrial sector. Furthermore, the ownership ratio of private power generation varies depending on the region’s industrial composition, leading to distinct effects on electricity consumption patterns. Consequently, these disparities in electricity consumption patterns necessitate the development of an efficient electricity supply system that considers regional differences.
In essence, the effective implementation of DSM through electricity price adjustments requires a precise understanding of regional variations in price elasticity. Achieving optimal electricity consumption adjustment via price changes necessitates consideration of the differences in consumer response speed across regions. Policymakers must accurately comprehend the unique residential and industrial structures present in each region to enable effective demand-side management.
It is noteworthy that previous studies have not adequately taken into account the regional differences in electricity consumption behavior. This study provides valuable information for policymakers by revealing the characteristics that underpin the regional disparities in the price elasticity of electricity demand. Armed with this insight, policymakers can tailor their strategies and interventions to enhance electricity conservation and promote sustainable consumption practices across different regions in Japan.
Footnotes
Declaration of Conflicting Interests
The author declared no potential conflicts of interest with respect to the research, authorship, and/or publication of this article.
Funding
The author disclosed receipt of the following financial support for the research, authorship, and/or publication of this article: This study was supported by the Japan Society for the Promotion of Science under Grant No. 22K01501.
Compliance With Ethical Standards
The funding sponsors had no role in the design of the study; collection, analyses, or interpretation of the data; writing of the manuscript; or the decision to publish the results.
Data Availability Statement
Research data on regional electricity consumption can be accessed at DOI: 10.17632/bc3p4phpy5.1.