
Abstract
The aphorism “Think globally, act locally,” attributed to René Dubos, reflects the vision that the solution to global environmental problems must begin with efforts within our communities. PlaNYC 2030, the New York City sustainability plan, is the starting point for this study. Results include (a) a case study based on the City College of New York (CCNY) energy audit, in which we model the impacts of green roofs on campus energy demand and (b) a case study of energy use at the neighborhood scale. We find that reducing the urban heat island effect can reduce building cooling requirements, peak electricity loads stress on the local electricity grid and improve urban livability.
Introduction
Peak load arises from the interaction of climactic variability and human need. Reducing the demand for energy services and providing the required services using less energy together can reduce peak electric load. Reducing surface air temperature through re-contouring urban surfaces with vegetation can reduce temperature stress on electric distribution wires and reduce demand for services.
In this article, we will examine methods for reducing peak load in upper Manhattan. Results include (a) a case study based on the City College of New York (CCNY) energy audit—we model the impacts of energy conservation on campus energy demand—and (b) a case study of energy use at the neighborhood scale—we find that reducing the urban heat island (UHI) effect can reduce building cooling requirements, peak electricity loads stress on the local electricity grid, and improve urban livability.
In “Literature Review: Peak Electric Load, UHI, and Livability” section, we review peak electric load, UHI, and urban livability literatures. In “A SWOT Analysis of Green Roofs” section, we discuss sustainability at campus and neighborhood scales. In “Urban Sustainability at Campus and Community Scales” section, we outline the data and analytical approaches used in this article. In “Results” section, we present results for UHI/peak energy load mitigation strategies for at the campus (CCNY) and community (West Harlem/Morningside Heights) scales. In “Conclusions and Future Research” section, we discuss …..
Literature Review: Peak Electric Load, UHI, and Urban Livability
The focus of our study is Manhattan Community District 9 (CD9) in West Harlem. The New York City (NYC) Department of City Planning reports that CD9 communities of Morningside Heights, Manhattanville, and Hamilton Heights contain a large percent of at-risk groups: 17.4% of the population below 18 years of age, 10.8% of the population 65 years or older, over two thirds of the population African American or Hispanic. Thirty-seven percent of the population are beneficiaries of needs-tested income support programs. These communities are also characterized as high density (NYC Department of City Planning, 2013a). Current scholarship links poverty and high-density living to a range of negative health outcomes associated with environmental stressors. Based on the work of Li, Horton, and Kinney (2013), we define “urban livability” as a function of air quality and ambient street-level temperatures. Livability declines in high-density urban areas as ambient temperatures increase. Public health scholarship confirms that heat is a concern in urban areas; high ambient air temperature has been associated with a large number of hospitalizations and deaths yearly (Basu & Samet, 2002; Mackenbach, Borst, & Schols, 1997). High urban temperature exposure may result in heat exhaustion, or exacerbate existing health disorders. Excess heat in urban areas can also exacerbate pollution, as air conditioners increase electricity use to compensate for rising urban temperatures (Kalkstein, 1993). Certain demographic groups may be most at risk of the effects of heat in urban areas. Epidemic heat-related deaths have been particularly pronounced among the socioeconomically disadvantaged and socially isolated elderly persons (Galea & Vlahov, 2005; Kilbourne, Choi, Jones, & Thacker, 1982). Urban livability can be evaluated in the context of heat stress, cooling degree days, or air quality non-attainment days. These indicators can be tied to the UHI effect (Kovats & Hajat, 2008). Extensive domestic and international research suggests that increasing permeable ground surfaces and/or vegetated surfaces can alter urban micro-climates, reducing ambient temperatures (Susca, Gaffin, & Dell’Osso, 2011). In our study, we express urban livability as the inverse of heat vulnerability. Decreasing urban livability can be correlated to increasing electric grid stress. As such, strategies to reduce summer time street temperatures and improve urban livability offer significant value to the residents of Manhattan CD9.
The Manhattan CD9 “197-a Plan” (NYC Department of City Planning, 2008) was approved by the NYC Council in 2007. The list of land use, zoning, and environmental recommendations included permitting of green roofs and other vegetative building surfaces as a priority. Amory Lovins has documented the improvement of community life resulting from introduction of vegetative surfaces (Lovins, Lovins, & Hawken, 1999). Recent work by Lynn et al. (2009) at City University of New York (CUNY) and Columbia suggests that high urban summer time ambient temperatures or UHI can be mitigated by planting trees at street level and increasing the reflectivity of roofs. CUNY geographic information system (GIS)–based modeling suggests that in addition to modulating ambient temperatures, vegetative surfaces can maintain localized air quality through photosynthesis (Solecki et al., 2005). Extensive physical testing of green roofs in the United States, Canada, and elsewhere has built a conclusive body of knowledge. Karen Liu in Ottawa, Ontario, and Stu Gaffin at Columbia concur that green roofs can reduce heat flux across building roof membranes by as much as 80% (Gaffin, Rosenzweig, Eichenbaum-Pikser, Khanbilvardi, & Susca, 2010; Liu, 2004). In this study, we will examine the potential for reducing peak electric load with UHI mitigation measures such as green roofs.
Peak Load
The pattern of electric use in electrified communities is the contour of human activity. Electric use is low at night when most people are sleeping and increases through the day. In NYC, peak demand happens between the hours of 4:00 p.m. and 7:00 p.m. on summer week days, following the aggregate contour of business and residential electricity use. 1 In neighborhoods with a large residential component or with a large entertainment sector, the peak load extends to 10:00 p.m. or 11 p.m.; networks serving these neighborhoods are known as night peaking networks.
The physics of electricity distribution shows that as the temperature of a conductor (the grid) increases so does resistance to the flow of electrons. On hot summer days, the ability of the grid to carry electricity decreases because the wires are warmer than usual. As electricity flowing through the grid increases, so does the temperature of the distribution grid. On hot summer days, the physics of electric distribution in combination with the high demand generate temperature stress on the electrical distribution grid. High summer temperatures often cause many small localized failures, fires, and faults.
When NYC temperatures exceed a set of maxima, the electric utilities and the New York Independent System Operator (NYISO) call for load shedding. Load shedding or “Demand Response,” is achieved by reducing consumption or starting up small emergency generators to serve essential customers. 2 Many in-city emergency electric generators run on diesel and #6 fuel oil. Lacking the emissions controls required of larger conventional generators, these units spew a cocktail of particulates, NOx, and partially combusted hydrocarbons into the city streets at a time when heat stress is already very high. Hot weather increases customer electric demand and decreases the ability of the grid to deliver. High urban summer temperatures not only make the city less livable but also threaten energy delivery services.
The UHI Effect
UHI is a term used to describe distinct exchanges of radiation, heat, moisture, and momentum unique to the urban climate (McKendry, 2003). Temperatures in heat islands generally peak after solar noon and decrease rapidly after sunset (Golden, 2004). In UHI, temperatures peak in mid-afternoon and remain high until late in the evening (Alexandri & Jones, 2008). Cities have enormous solar thermal storage capacity in masonry infrastructure (Stone & Rodgers, 2001). The sun’s rays hit the stone, concrete, brick, and mortar of urban buildings and are absorbed into building surfaces in daylight hours. Stored solar energy is slowly and mercilessly reradiated into the street long after sunset.
The storage and re-radiation of solar energy in high-density urban areas keeps cities from cooling down at night. The United States Environmental Protection Agency (U.S. EPA) reports that high-density urban areas are many degrees hotter than surrounding suburban and peri-urban areas. Evening temperature differences can be as much as 15° F. High temperature energy demand persists throughout the night. Electric distribution wires are continuously at risk for temperature-related failure (U.S. EPA, 2012b).
Moderate temperatures of urban summer mornings in urban neighborhoods are documented (Alexandri & Jones, 2008). The NYISO load curves show that on summer mornings, the grid is unstressed. 3 Positive correlation between temperature and Ozone production were identified by Gunst and Kelly as early as 1987 (Gunst & Kelly, 1993). As the day progresses, temperatures increase correlating with increased grid loading, respiratory stress, and heat vulnerability. In late afternoon, business air conditioning use persists as residential air conditioning use begins to pick up. NYISO data show this combination driving grid peaks along with threats of grid overload. Electric load forecasting estimates air conditioning loads account for more than 65% of system annual peak demand (Kandil, El-Debeiky, & Hasanien, 2001). The UHI effect keeps city temperatures high throughout the summer afternoon into the evening. NYISO data show urban energy demand remains well above surrounding areas well into the night. With climate change, the frequency and intensity of heat waves are expected to increase, with adverse impacts on human health, particularly among the young, elderly, and chronically ill (Centers for Disease Control and Prevention, 2013; Sampson et al., 2013). The impact of regional heat waves on at-risk populations is aggravated by UHI in urban centers. The UHI effect exacerbates urban heat vulnerability and maintains urban electric grid stress at high levels (Reid et al., 2009).
Urban Livability
In NYC, increasing ambient temperatures set off a domino effect that impacts the electrical grid. Peak electric demand occurs on hot summer weekday afternoons, which are often “ozone alert” days. Extreme temperatures and consequent electric voltage reductions or brownouts create an environment of increased vulnerability to the effects of heat, heat-related illness, and death. Emergency generation run during “Demand Response” events contribute to ground-level ozone, smog conditions, and respiratory distress. CUNY fuel choices impact local emissions of NOx, volatile organic compounds (VOCs), and ozone precursors, all of which are associated with an increased incidence of chronic illnesses (Jacobson, 2008; Markandya & Wilkinson, 2007; Wilkinson, Smith, Joffe, & Haines, 2007). These emissions particularly affect vulnerable populations—the elderly, the very young, and asthma sufferers.
The definition of the term urban livability varies with the context of research. For the purpose of this study, we will relate urban livability to the intensity of the UHI effect and peak electricity load–related air emissions. The UHI effect becomes more pronounced due to rising temperatures in particular areas. Electricity demand tends to rise due to air conditioning loads (Sampson et al. 2013). Strategies such as increasing vegetated surfaces may mitigate peak demands and calls for load shedding with beneficial impacts on system reliability and public health outcomes. We can thus define urban livability as a relationship between the cooling of microclimates or outdoor “livability,” and the cooling loads required for indoor “livability.”
Climate change studies suggest that the frequency of heat waves have increased globally; however, there is no evidence of a statistically significant increase in the incidence of heat waves in NYC (NYC Panel on Climate Change, 2013). Several studies have shown a connection between heat waves and mortality spikes. It is anticipated that in the future, “heat-related mortality could outweigh cold-related mortality” (Li et al., 2013). These changes will have a disproportionate impact on at-risk populations, such as the elderly, children below the age of 5, and residents of low-income and minority communities.
A SWOT (Strengths, Weaknesses, Opportunities, and Threats) Analysis of Green Roofs
Infrastructure analysis does not typically take into account broader impacts. For the implementation of a new energy system, one of the primary pieces of data used for the analysis is historical trends of electricity which present a continual increase in demand (Krumdieck, 2014). But this analytical approach can be limited in scope because important narratives such as sustainability are not incorporated into the research. Therefore, the problem with this approach is that “technical feasibility, economic, environmental, and social risk” are not sufficiently modeled. In the case of implementing green roofs in NYC, this type of limited technical analysis simply based on demand does not provide the needed insights for determining whether this technology is the most appropriate for NYC.
Recent engineering design studies have demonstrated the feasibility of green roof retrofits (see Eisenman, 2006; Schumann, 2007; Werthmann, 2007). Stovin (2010), in a study of retrofit options in the United Kingdom, finds that “[s]tructural appraisal of a range of flat roof types suggests that retrofitting a green roof will be a feasible option in many cases, particularly for concrete slab roofs.” At the same time, it is important to remember that the technology also poses some disadvantages.
The solutions that green roofs can provide are numerous and multifaceted but there could also be some hidden disadvantages. In this analysis, SWOT analysis is embraced because it is a holistic framework that can be used to review the outcomes of using this technology. The advantages of using SWOT analysis is that it is a systematic planning tool to examine the advantages, potential threats, and opportunities of alternative projects.
Susca et al. (2011) examines the energy impacts of white and green roofs, at both the building and urban scale. The primary strengths of the technology are the abilities to reduce winter heating loads and summer cooling loads and also to mitigate stormwater flows. Therefore, the technology would further reduce energy costs and assist in reducing stormwater volumes that would otherwise have to be processed by wastewater treatment plants. The costs of implementing this technology are substantially less than traditional alternatives. However, there are other inexpensive methods like painting roofs white and installing shaded windows that prove equally effective in reducing building cooling loads. Furthermore, the installation of green roofs has to be done in conjunction with property owners who can be resistant to the concept. But these challenges can be most likely overcome because sustainability is becoming a priority for urban centers. If the city becomes more proactive about this opportunity, one of the major things that it must analyze is the potential of implementation examining from a building structural perspective. A large percent of the old building stock might not be able to support the additional weight (Cavan & Kazmierczak, 2011).
Based on this SWOT analysis, these inputs could be utilized in a strategic analysis methodology for evaluating energy systems. One of the steps of the methodology deals with identifying “opportunity space” by eliminating selections that have high costs or risks (Krumdieck, 2014; Krumdieck & Hamm, 2009).
Therefore, the optimal scenario is to identify buildings that balance the high margin of safety needed for these retrofits against implementation costs, while maximizing the environmental benefits per unit of roof area. Alfredo, Montalto, and Goldstein (2009) study the hydrological performance of “extensive” green roofs, which “with their shallower depths and lighter weight, they are more easily retrofitted” into existing buildings. Castleton, Stovin, Beck, and Davison (2010) find that older, poorly insulated buildings benefit more from green roofs than do newer buildings built to current energy-efficiency standards. An easily implemented first step would be to install these retrofits on city-owned properties, which compose a large slice of the building stock and tend to be older structures.
Urban Sustainability at Campus and Community Scales
Urban sustainability involves three related elements: economic development, environmental sustainability, and social justice (see Hamstead & Quinn, 2005). The Local Agenda 21 process, stimulated by the 1992 Earth Summit in Rio, is an effort to develop community-based environmental sustainability initiatives (see Selman & Parker, 1999; Sharp, 2002). Hess and Winner (2007) review 30 case studies of sustainable community development in the United States. They conclude that “there are affordable ways to address goals of enhanced environmental sustainability as well as community development goals of job creation and improvement in the lives of low-income members of a community” (p. 393).
The CUNY is the nation’s largest urban public university. Founded in NYC in 1847 as the Free Academy, CUNY’s 19 campuses serve hundreds of thousands of degree and continuing education students from NYC and around the world. At the urban and neighborhood scale, electricity and fuel demands by CUNY campuses have impacts on air quality, public health, and reliability of the local electricity grid. A project to assess the environmental impacts of campus operations for City College (CCNY) was recently completed as a part of the Greenhouse Gas (GHG) Inventory Program (Sinha & Spiegel, 2008). The CCNY study provides both energy demand and emissions data as well as proposed adaptation strategies, adhering to two broad categories of criteria of urban environmental performance: (a) “minimising the transfer of environmental costs to the inhabitants and ecosystems surrounding the city” and (b) “ensuring progress toward ‘sustainable consumption’—that is, ensuring that the goods and services required to meet everyone’s needs are delivered without undermining the environmental capital of nations and the world” (Satterthwaite, 1997, p. 1670).
Our work develops analytical methods and processes scalable from campus to the local community. See Figure 1 for maps of the CCNY campus and the CD9, the neighborhood within which the campus is located. Building methods to be shared from campus to campus creating local initiatives and circles of involvement around each CUNY campus is an essential outcome of this endeavor. Bromley (2006) suggests the importance of “seeding ideas into the local arena—ideas that may be taken up and championed by others” (p. 22).

Manhattan Community District 9 and the City College (CCNY) Campus.
Results
The CCNY study is based on an analysis of data collected for the CCNY Campus Energy Assessment (Letkiewicz, 2010) and the CCNY GHG Inventory Program (Sinha & Spiegel, 2008). These programs provide detailed assessments of energy use and emissions of carbon and criteria pollutants at CCNY in support of the commitments to reduce carbon emissions undertaken by CUNY in response to NYC’s PlaNYC 2030 (2011). It provides a baseline against which to measure the impacts of policies and technologies that affect electricity and natural gas demands. To achieve the PlaNYC 2030 carbon emissions goals, CCNY has implemented fuel switching (from #6 fuel oil to natural gas) and energy conservation. These efforts have environmental and urban public health implications that transcend the issue of the carbon footprint of the CCNY campus.
The results of data collection across the CCNY campus were used to estimate campus-wide air conditioning load. Air conditioning load at CCNY was estimated as the difference between summer and average non-summer monthly electricity use for each building. This estimate may be lower than the actual CCNY air conditioning load. School operating hours are longer and seasonal light changes require more interior lighting during the non-summer months. Seasonal variation in operating hours may actually reduce the difference between summer and non-summer energy use, masking the true campus air conditioning load. CCNY building roof area was also taken from these studies. Estimates of summer time heat flux reduction associated with green roofs were made using the results of in situ green roof testing in Ottawa, Canada, and Long Island City, New York.
For the West Harlem case study, we have compiled available land-use, climate, and energy-use data sets and created data layers within ArcGIS to enhance our understanding of the connection between building stock and existing energy infrastructure. For Manhattan Community Board 9 (CB9), we used the land-use data set MapPluto (NYC Department of City Planning, 2013b) to generate the buildings footprints. The NYC Solar Map (CUNY Center for Advanced Research of Spatial Information, 2011) was utilized to calculate the total roof areas available for solar or green roof technologies. The results of this analysis are presented in 5.1 (CCNY study) and 5.2 (Manhattan CB9). Results of energy modeling by Howard et al. (2012) were used to estimate the potential impacts of green roofs on air conditioning load. 4
Results of energy modeling by Howard et al. (2012) were used to estimate the potential impacts of green roofs on air conditioning load. Howard used 2009 building energy use data gathered in response to NYC local law 84, the Greener Greater Buildings Plan. Howard modeled energy use intensity and cooling load intensity for all blocks on the island of Manhattan.
Howard’s energy use results were used to generate an annual energy use estimate for Manhattan CD9, shown on a per-block basis in Figure 2. This estimate was compared with 2009 energy delivery by the NYC electric utility Con Edison. The ratio of estimated CD9 energy use to reported energy delivery was used to generate a scaled down load curve for CB9 based on the NYISO load curve for the NYC region. Howard’s cooling load intensity results were used to generate annual cooling load estimates for CB9 as well. Results of Gaffin’s rooftop heat flux experiments were used to calculate potential reductions in air conditioning load associated with green roofs.

Electricity consumption by block: Manhattan Community District 9.
Estimating Green Roof–Associated Reduction of Electric Load
As we discussed above, The CCNY Campus Energy Assessment (Letkiewicz, 2010) provides a detailed assessment of building, lighting, and heating, ventilation, and air conditioning (HVAC) system characteristics. Table 1, based on their analysis, indicates the usable roof space for solar photovoltaics or green roofs. These data enabled us to estimate the impacts of green roofs on the electric load curve. Our simplified estimate of green roof impact on CCNY air conditioning load is based on several key assumptions. We assumed that rooftop heat flux during summer time air conditioning months translates directly to air conditioning load. Using Jeff Sonne’s (2006) air conditioning load estimate, we assumed that every watt of heat energy removed by air conditioning uses 3 watts of electricity from the grid. This first cut estimation of the impact of green roofs on CCNY summer electric load suggests that installation of green roofs on 50% of CCNY roofs can significantly reduce incremental summer time load associated with AC. 5
Usable Roof Space for Solar Photovoltaics or Green Roofs on the CCNY Campus.

Source: Letkiewicz (2010), Table 6-3.6, pp. 81-82.
Note. CCNY = City College of New York.
CUNY, the Community, and the Grid: Cooling the Community
Direct field observations show urban green spaces can lower daytime summer temperatures at street level by as much as 1.9°C (Hamada & Ohta, 2010). Reducing ambient outdoor and indoor temperatures can generate a cooling feedback loop. Not only does air conditioning contribute to energy demand at a time when the grid delivers energy most inefficiently but it also dumps indoor heat outdoors and generates waste heat from mechanical equipment. Urban cooling may create a feedback loop to reduce temperatures in all spaces as well as reducing Peak Day grid stressors. Green roof–associated air conditioning load reductions for CD9 were estimated using Gaffin’s heat flux reduction factor and the results of energy modeling by Howard et al. (2012). Green Roof air conditioning load reduction was calculated based on available roof area (see Figure 3).

Green roof potential: Manhattan Community District 9.
Howard et al. (2012) estimate that homes and businesses in Manhattan CD9 use 40 to 60 kWh per square meter of block area on space cooling annually. 6 The model assumes end use is primarily dependent on building function, whether residential, educational, or office, and not on construction type or the age of the building (Howard et al., 2012). These estimates for annual cooling energy use were compared with potential green roof–associated AC load reductions in Manhattan CD9 7 (see Table 2).
Impact of Green Roofs on Annual Cooling Loads: Manhattan Community District 9.
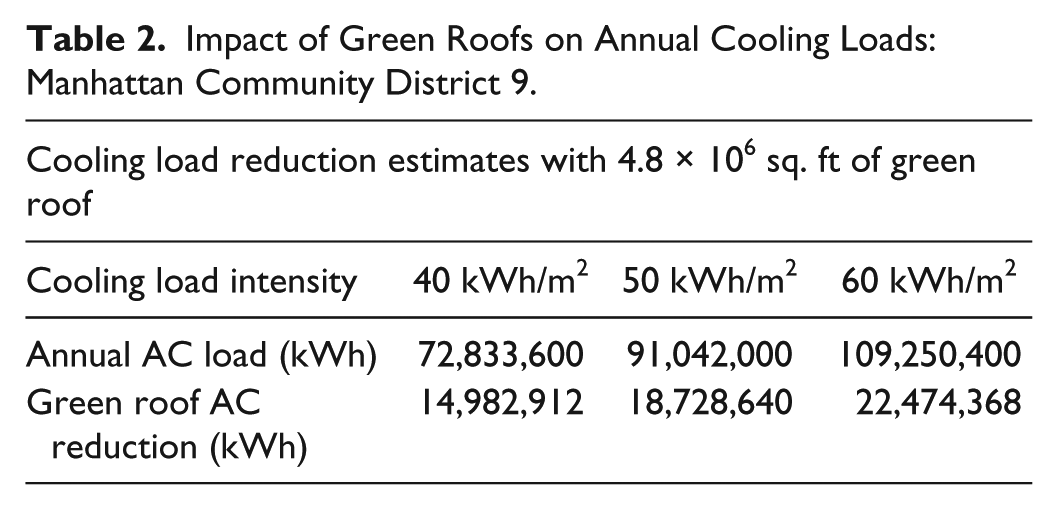
Annual Cooling Load estimates for CB9 are 40 to 60 kWh per square meter of block area. The results of these preliminary estimates are promising; however, the assumption that green roof reductions in heat flux across roof membranes translate directly to reductions in air conditioning load requires further verification and refinement. Based on the quality of historical construction, it seems likely that this may be true for older buildings than for newer ones. If heat flux correlates closely to indoor temperatures in older buildings, green roofs may offer the greatest benefit to old multifamily and tenement buildings in low-income neighborhoods.
The dynamics of heat/energy storage and transfer in masonry are the basis of many ancient technologies. Earthenware water jars and pueblos use the heat (or coolth) storage properties of masonry to maintain constant interior temperatures as external ambient temperatures fluctuate. We noted that surface air temperature variation drives hourly electric load in summer. Aggregate reductions in annual air conditioning use may add up to significant cost savings; however, hour by hour reductions have an important potential impact. To maintain grid stability, the NYISO targets reducing peak hourly energy demand by 8%. Figure 4 compares the estimated load curve for Manhattan CD9 to the potential of green roofs to reduce air conditioning loads. 8 Green roof–based reductions in summer time electric load, although small relative to total electric demand, constitute a significant fraction of the NYISO target of 8% of peak load reduction. These findings suggest that green roofs may offer important potential benefits to both the grid and the urban environment during summer peak load events.

Manhattan Community District 9: Modeled load curve compared with potential avoided air conditioning load.
Understanding the city wide impact of temperature on air conditioning load is a primary stumbling block to measuring the impacts of green roofs and vegetated urban surfaces. Estimates of AC contribution to regional energy use vary dramatically. AC demand calculations typically draw a boundary at the individual building envelope. While the impact of vegetative surfaces on street-level temperatures has been extensively modeled, heat transfer through building envelopes in combination with green roofs has not. A number of in situ pilot tests of green roofs are currently underway, but energy balance calculations stop several inches below the surface of the roof. HVAC engineers do their calculations for individual systems and physical geographers run their models at the macro scale. Scenarios that connect city-wide climate models to building mechanicals must be modeled. Our high-level estimates of green roof–based demand reductions suggest that green roofs can offer both instantaneous surface air temperature reductions and day-long temperature reductions. We suggest that these temperature reductions can shift the summer time load curve down and accomplish permanent demand reduction. For vegetative surfaces to become part of any portfolio of energy conservation measures, well-tested reproducible results must be generated showing energy savings during peak demand hours.
Conclusion and Future Research
Across the political spectrum, awareness is increasing that concepts and institutions that served to broaden and enhance society have run their course and must be retooled. This awareness is particularly acute as NYC Community Planning Boards struggle with the conventional issues of social equity in housing, public services, and environmental health. With adaptation to climate change raising additional concerns, planning boards face radically different challenges. A new theory and a set of implementation tools are needed. These tools must allow the boards to be proactive in networking previous long-standing issues with new emerging issues—the nexus of energy needs, electric system limitations, air quality, and local health.
Our studies of urban micro-climates and essential services delivery lead us to conclude that carbon footprint is not the only relevant metric for sustainable urban buildings. To a large extent, thermal properties of both building and building site are more important for sustainable urban systems. Our work quantifies potential energy benefits of vegetated urban surfaces. Street-level and rooftop vegetation offer stormwater management benefits as well. Incorporation of purpose-constructed urban canopies into urban zoning regulations could ease pressures on many essential urban services. The use of energy optimization models can enable stakeholders to measure the impacts of street-level and rooftop vegetation on electric loads, air quality, and human health.
In this set of analyses, we concentrated on peak electric load relief. Many essential urban services are affected by climate change and the UHI effect. In future work, we will examine (a) interdependencies between energy, water, and wastewater services; (b) the impacts of UHI on electricity water and wastewater demands; and (c) the impact of vegetation on the demands for energy, water treatment, and wastewater services at urban and neighborhood scales.
The need for answers to these questions is pressing. In NYC alone, population is expected to grow by 8% over the 2010-2030 period (NYC Department of City Planning, 2006). Sights are set on low-density areas in the outer boroughs for increased high-density residential construction. The areas targeted by PlaNYC 2030 (2011) were farm land 100 years ago. Now they are low-density middle-income and working-class neighborhoods near the ocean. Smart interdisciplinary planning strategies can avoid creation of service delivery disasters.
Footnotes
Acknowledgements
We acknowledge the contributions provided by Vatsal Bhatt and John Lee of Brookhaven National Laboratory, who collaborated with us on the funded research.
Declaration of Conflicting Interests
The author(s) declared no potential conflicts of interest with respect to the research, authorship, and/or publication of this article.
Funding
The author(s) disclosed receipt of the following financial support for the research and/or authorship of this article: The authors acknowledge the support of Alex Peck and Edward J. Linky, US EPA Region 2, and Liz Hanna, NYSERDA, whose support made this research possible.