
Abstract
Balancing the allocation of preschool education resources is a crucial objective within China’s preschool education reform. Our analysis focused on investigating the disparities between regions and urban-rural areas in China from 2011 to 2019, employing the technique for order preference by similarity to ideal solution (TOPSIS), spatial analysis, and Markov chains. The results demonstrate a gradual reduction in the gaps between regions, and a rapid decrease in urban-rural gaps. Notably, Sichuan stands out with noticeably higher urban-rural differences compared to other provinces. The dynamic evolution revealed by Markov chains illustrates a limited level of fluidity in the observed changes within preschool education resource allocation levels from 2011 to 2019, thereby indicating progression toward a higher-quality allocation process. Additionally, the steady-state formation predicted by Markov chains highlights that if the current investment strategy remains unaltered, the rural areas in middle China will become the least developed in terms of preschool education by 2025. This situation is projected to deteriorate further by 2030. Urgent attention and policy adjustments are therefore imperative to address new trends.
Keywords
Introduction
A substantial body of literature from different countries has demonstrated the positive impact of preschool education on children’s early and even long-term development (Del Boca et al., 2014; Engle et al., 2011; Gabel & Kamerman, 2006). Research has also revealed that the early childhood years are the most effective time to invest in human capital and that the return on this investment decreases with age (Cunha et al., 2006; Francesconi & Heckman, 2016). Globally, developing preschool education and balancing resources have become crucial ways to alleviate poverty and promote social equity. To achieve equity through education, resources, such as talent, materials, and financing must be distributed to where they are needed the most (Omoeva et al., 2021).
To enhance the quality of preschool education and reduce geographical disparities, the Chinese government has prioritized preschool education and implemented several national policies to manage the investment of resources in recent years. In 2010, The State Council issued the policy, Suggestions on the Current Development of Preschool Education, and decided to implement the Three-Year Action Plan for Preschool Education. From 2011 to 2019, this plan has been implemented for three phases and have resulted in an expansion in the scale of investment in preschool education resources, particularly in the middle and western regions, and some rural eastern areas. However, there is still a lack of understanding of the changes in the spatial distribution of these resources and the regional and urban-rural disparities that persist. Despite the significant regional and urban-rural differences in China in terms of teacher qualifications, school financing, and class sizes have been revealed in Pang and Richey (2007) , Hong et al. (2013), and Cao and Li (2017). A lack of long-time-series analysis and failure to include various types of educational resources in a unified analysis framework have left a gap in understanding how the allocation of preschool education resources in China has changed since the implementation of the Three-Year Action Plan for Preschool Education. Therefore, the goal of the study is to answer the following three questions: (1) How has the allocation of preschool education resources in China changed chronologically and spatially from 2011 to 2019 after the implementation of the Three-Year Action Plan? (2) Have the differences between regions and urban-rural areas been reduced and have there been new changes? (3) Given the current scale of investment, what new trends will emerge in the short term, and will policy adjustments be necessary?
Literature Review
Key Education Resources
Before addressing how to evaluate the allocation of preschool resources and identify existing disparities in regions and urban-rural areas, it is important to determine which resources are relevant and have a significant impact on the equity of preschool education and how to measure the level of resource allocation for different types of resources. There is consensus in the literature on the importance of material resources (such as textbooks, and the condition of the building), human resources (teacher education, pupil-teacher ratios), and financial resources (capital cost) as inputs of education (Omoeva et al., 2021; Yue, 2018).
There are some scholars who claim that financial resources are the most crucial element in ensuring the functioning of teaching activities (van Huizen et al., 2019), while many others express different opinions. For example, a large number of scholars have highlighted the impact of the availability of material resources such as books and instructional materials on student achievement (P. W. Glewwe et al., 2011; P. Glewwe & Kremer, 2006). While there is limited guidance in current literature on appropriate class sizes, findings from research suggest that smaller class sizes do increase the quality of preschool education (Dalgaard et al., 2022; Slot et al., 2015; S. Wang et al., 2020). Cuesta et al. (2016) found that disparities in physical resources (infrastructure) and access to services continue to cause huge gaps between regions and urban-rural areas. Similarly, studies have emphasized that education accessibility can be spatial, such as the physical distance to obtain services and travel time, which can influence student performance (Talen, 2001; Williams & Wang, 2014).
Since human resources are closely related to the quality of preschool education or Early Childhood Education (ECE), many researchers highlight the importance of this factor. Structural indicators and process indicators are the key components for the quality assessment of preschool education or Early Childhood Education (ECE) (Howes et al., 2008 ), which are closely related to the input of human resources. Structural quality encompasses the more easily measurable indicators, such as teacher education, pupil-teacher ratios, and class sizes, while process quality encompasses teacher-child interactions, which is more challenging to measure. Although some studies claim that structural quality tends to have a weak association with student outcomes, process quality has a long-term impact on children (Burchinal et al., 2010; Cassidy et al., 2005; Connors & Morris, 2015). However, some recent studies suggest that structural indicators (pupil-teacher ratios, teacher education) are the two highest contributions to explaining progress quality (L. Wang et al., 2020 ).
In summary, we define preschool education resources as the combination of material resources (i.e., class size, books per pupil), human resources (i.e., teacher education, pupil-teacher ratios), and financial resources (per pupil education expenditure). However, scholars have different views on the importance of these resources: for example, Fuller and Clarke (1994) point to the greater impact of books and teaching materials on student performance compared to class size and teacher qualifications, while Luschei and Chudgar (2011) claim that teacher education has the greatest effects on student outcomes in certain developing countries. It is necessary to establish a method that can circumvent subjective factors in the calculation of the indicators’ weights to evaluate the allocation of resources.
Measuring the Allocation of Education Resources
Studies on education resource allocation, which started in the late 20th century, were initially based on qualitative analysis, analyzing its current development and problems by single indicators (i.e., teacher qualification, capital cost). Most of the studies on education resource allocation in the existing literature concentrate on compulsory and higher education, and few researchers focus on preschool education resource allocation (Tu et al., 2018). Compulsory education has always been a hot spot of government attention, and there are plenty of in-depth studies. For example, Fredriksson and Öckert (2008) analyzes the links between increased resources (teacher density) and student achievement in Sweden. Liang and Ma (2021) use the entropy method and comprehensive evaluation method to explore the differences in the spatial distribution of compulsory education resource allocation.
Currently, many psychologists, economists, and educators generally believe that early childhood is a critical period for physical and mental development in life, and that preschool education as the formal way to promote child development deserves to be paid more attention (K. Burger, 2010; Melhuish et al., 2008).The research on preschool education resource allocation mainly focuses on three aspects. Firstly, most studies focus on analyzing the relationship between single-dimensional resource allocation and education equity, such as the urban-rural teacher qualification gap, disparity in class sizes and pupil-teacher ratios between regions (Rao et al., 2022), and the allocation of educational expenditure (L. Wang & Liu, 2022). These studies show that there is a clear disparity in the allocation of preschool education resource between regions and urban-rural areas in both developed and developing countries.
Secondly, there is a body of research based on spatial analysis methods as a basis for inequity in education resource allocation. Since Hansen proposed the concept of accessibility (Hansen, 1959), scholars have realized that traditional studies of preschool education resource allocation have only focused on non-spatial factors, while educational equity should also include spatial equity in the distribution of resources. By using various spatial and temporal methods to quantitatively analyze the differences in the spatial accessibility of educational facilities in different regions, they have positively linked school performance to travel time (Müller et al., 2008), school scale (Bickel & Howley, 2000 ) and the school-age population distribution structure within the source zones (Köse et al., 2021).
Thirdly, numerous studies identify the relationship between micro-economic factors or background characteristics and preschool education resources, mainly focusing on preschool resources for children from migrant or low-income families, with migrant parents. Studies from the China Family Panel Studies (CFPS) have shown that a significant proportion of school-aged children in China are affected by migration, with parents typically facing constraints in terms of access to preschool education resources for their children due to factors such as their hukou status (Xie & Hu, 2014). Chinese citizens hold either urban or rural hukou tied to a wide range of publicly-funded programs, migrant parents who usually hold rural hukou prefer to raise their children in the cities where they are employed, but the preschool education resources available to their children are constrained and much lower than children with urban hukou (Yu & Crowley, 2020). Research has also shown that in other countries such as the United States, children from low-income and less-educated families are less likely to attend pre-kindergarten, and disparities in access to early childhood education often exist in certain regions (Barnett & Yarosz, 2007).
Lastly, regarding gender differences in preschool education, using a specific Q-Sort coding procedure (CCH), Pierrehumbert et al. (2009) find that girls’ narratives appeared as systematically more secure than those of same-age boys during their preschool years. Meanwhile, after testing phonological awareness on 2000 6-year-old children, Lundberg et al. (2012) observed a clear gender effect, there being more boys with very low initial scores and more girls among the top scorers. There are also studies focusing on the relationship between preschool enrollment and gender. Framed by the accommodation model, Gordon et al. (2020) found that boys were more likely than girls to attend preschools in higher socio-economic status families, but the reverse was true among less affluent families.
Research Related to the Three-Year Action Plan
Overall, numerous studies examining the allocation of resources in preschool education have often been limited by either a lack of comprehensive resource measurement or a primary focus on the link between micro-socioeconomic factors and resource distribution. This issue is similarly prevalent in research concerning Chinese preschool education, particularly in analyses of the Three-Year Action Plan. Such investigations typically employ a singular dimension of resource evaluation, predominantly concentrating on alterations in human and financial resources. Xufang and Lin (2022) noted that although the teaching workforce has experienced growth following the Three-Year Action Plan, enhancing quality remains a significant challenge that China must address. Conversely, Gupta (2018) argued that the plan has resulted in heightened enrollment rates, which in turn have led to a scarcity of teachers. Various studies have highlighted disparities in teacher qualifications and education across urban and rural areas (Hong et al., 2015; Jiang et al., 2017). Additionally, it has been observed that financial contributions to preschool education exhibit considerable regional and provincial variances, with areas in the central and western regions, such as Yanan, Guangxi, and Ningxia, falling behind their eastern counterparts (Tsegay et al., 2017).
It is clear that preschool education resources involve multiple dimensions, and the allocation of a single indicator does not give a comprehensive understanding of education resource allocation. When examining differences in preschool education resource allocation between regions and urban-rural areas, it is crucial to include macro-socioeconomic factors such as demographics, economic development, and natural resources in the analysis. Therefore, it is important to design a research agenda that builds on previous studies and expands the examination of preschool education resource allocation to include the consideration of multi-dimensional resource indicators. TOPSIS (Technique for Order of Preference by Similarity to Ideal Solution) is a multicriteria decision analysis, it can assign weights to indicators to reflect their relative importance, thus avoiding the subjectivity of artificial weighting(Çelikbilek & Tüysüz, 2020).With the help of TOPSIS, indicators of preschool education resources can be assigned objective weights to determine the Preschool Education Resource Allocation Index (
Research Methods and Data Sources
Index Selection
In the analysis, we construct the Preschool Education Resource Allocation Index (
Preschool Education Resource Allocation Index.

Firstly, material resources contain 3 second-level indexes: class sizes, books per pupil, Preschool Education Resource Density Index (

where
The second category is human resources, which contains pupil-teacher ratios, and teacher education. Moreover, we performed standardization before assigning values to teacher education. Based on teachers’ educational level, we assigned different values (Graduate = 5, Undergraduate = 4, Associate Bachelor = 3, High School Graduate = 2, Below High School Graduate = 1). Then we calculated the mean value of teacher education, which is given by

where
Thirdly, financial resources only contain 1 second-level index, which is per-pupil education expenditure (sheng jun jiao yu jing fei). Due to the significant disparities in economic development between regions and areas in China, comparisons of per-pupil education expenditure in previous literature are less meaningful and do not reflect the real situation. To make the per-pupil education expenditure comparable, it is essential to calculate minimum per-pupil guarantee standards for each province and area. Once the standards are calculated, it is possible to use the ratio of per-pupil education expenditure to a minimum per-pupil guarantee standard to compare the gaps between different provinces and areas. We use the extended linear expenditure system (R. P. Burger et al., 2017; Lluch, 1973) to calculate minimum per-pupil guarantee standards. This method allows the measurement of the minimum amount of its needs based on the annual data of consumption. Per-pupil education expenditure is selected as the total expenditure indicator, and personal part, public part and capital expenditure are used as expenditure sub-indicators, representing three different aspects of the per-pupil education expenditure (based on the classification criteria of China Educational Finance Statistical Yearbook). In addition, to eliminate annual differences and make the data longitudinally comparable, the Consumer Price Index (CPI index) is converted for each funding indicator (CPI data are based on 1985). The extended linear expenditure system model is given by


where
Data Sources
Raw data on class sizes, books per pupil, the number of preschools, pupil-teacher ratios and teacher education come from the Educational Statistics Yearbook of China (2011–2019). Raw data on per-pupil education expenditure (sheng jun jiao yu jing fei) can be obtained from China Educational Finance Statistical Yearbook (2011–2019). CPI data and the annual birth rate are from China Statistical Yearbook (1985–2019). All the data pivotal to this research encompass information from all provinces within mainland China for the period spanning 2011 to 2019, with the exclusion of Taiwan, Macau, and Hong Kong. These datasets were sourced from publications by Chinese official agencies, including the official websites of the Ministry of Education and the National Bureau of Statistics, as cited in studies by Hong et al. (2015) and Hong and Chen (2017).
Methods
In this paper, we propose a practical way of measuring preschool education resource allocation, by constructing a composite indicator from multiple types of preschool education resources. We capture these resources within three dimensions: material resources, human resources, and financial resources. We construct the Preschool Education Resource Allocation Index (
Technique for Order Preference by Similarity to Ideal Solution (TOPSIS)
After the index selection and data pre-processing were completed, we constructed the index evaluation system with the technique for order preference by similarity to ideal solution (TOPSIS), which can help us determine the weight of six second-indexes (Table 1). Since there are positive and negative indicators, we standardize the indicators by using the following formula to consider the directionality of the indicators. In case of positive indicators, formula (7) is used, otherwise formula (8) is used. Apart from that, to avoid meaningless logarithms when seeking entropy values, the data are panned and a constant of 0.001 is added uniformly to the standardized data. Other steps include calculating the entropy value, redundancy, etc. (Y. J. Wang, 2014).


where
Notes: Due to data (birth rates, area sizes) on urban and rural areas is not available, we cannot construct the Preschool Education Resource Density Index (
Density Segmentation Tool in Arcgis
Density Segmentation Tool in ArcGIS is employed to visualize the dynamic progression of spatial differentiation in preschool education resources across urban-rural areas and regions in China from 2011 to 2019.
Markov Chain
The analysis above can help us understand the overall performance of regional and urban-rural differences in preschool education resource allocation, but it cannot be used to study the dynamic changes in preschool education resource allocation levels from 2011 to 2019. Additionally, it cannot explain where the preschool education resource allocation level will be in the long-term future, making it difficult to provide powerful practical support for subsequent decision-making. Therefore, by using the Markov chain research method, we can bridge the gap in the study of the dynamic evolution and steady-state formation of preschool education resource allocation.
The Markov chain assumes that the probability of a state transfer at a given moment depends only on its previous state.

Since a state transfer at a given moment depends only on its previous state, then we can eventually obtain the state transfer probability matrix as long as we can find the transition probabilities between any two states of the four types of preschool distribution levels. The final transfer probability matrix can be obtained.

Then the transfer probability

where
Next, a prediction of the probability distribution for any year (after 2019) can be made

where
Results
Overall Change and Regional Differences
After calculating the Preschool Education Resource Allocation Index (
Overall Changes for Preschool Education Resource Allocation in China, 2011 to 2019.
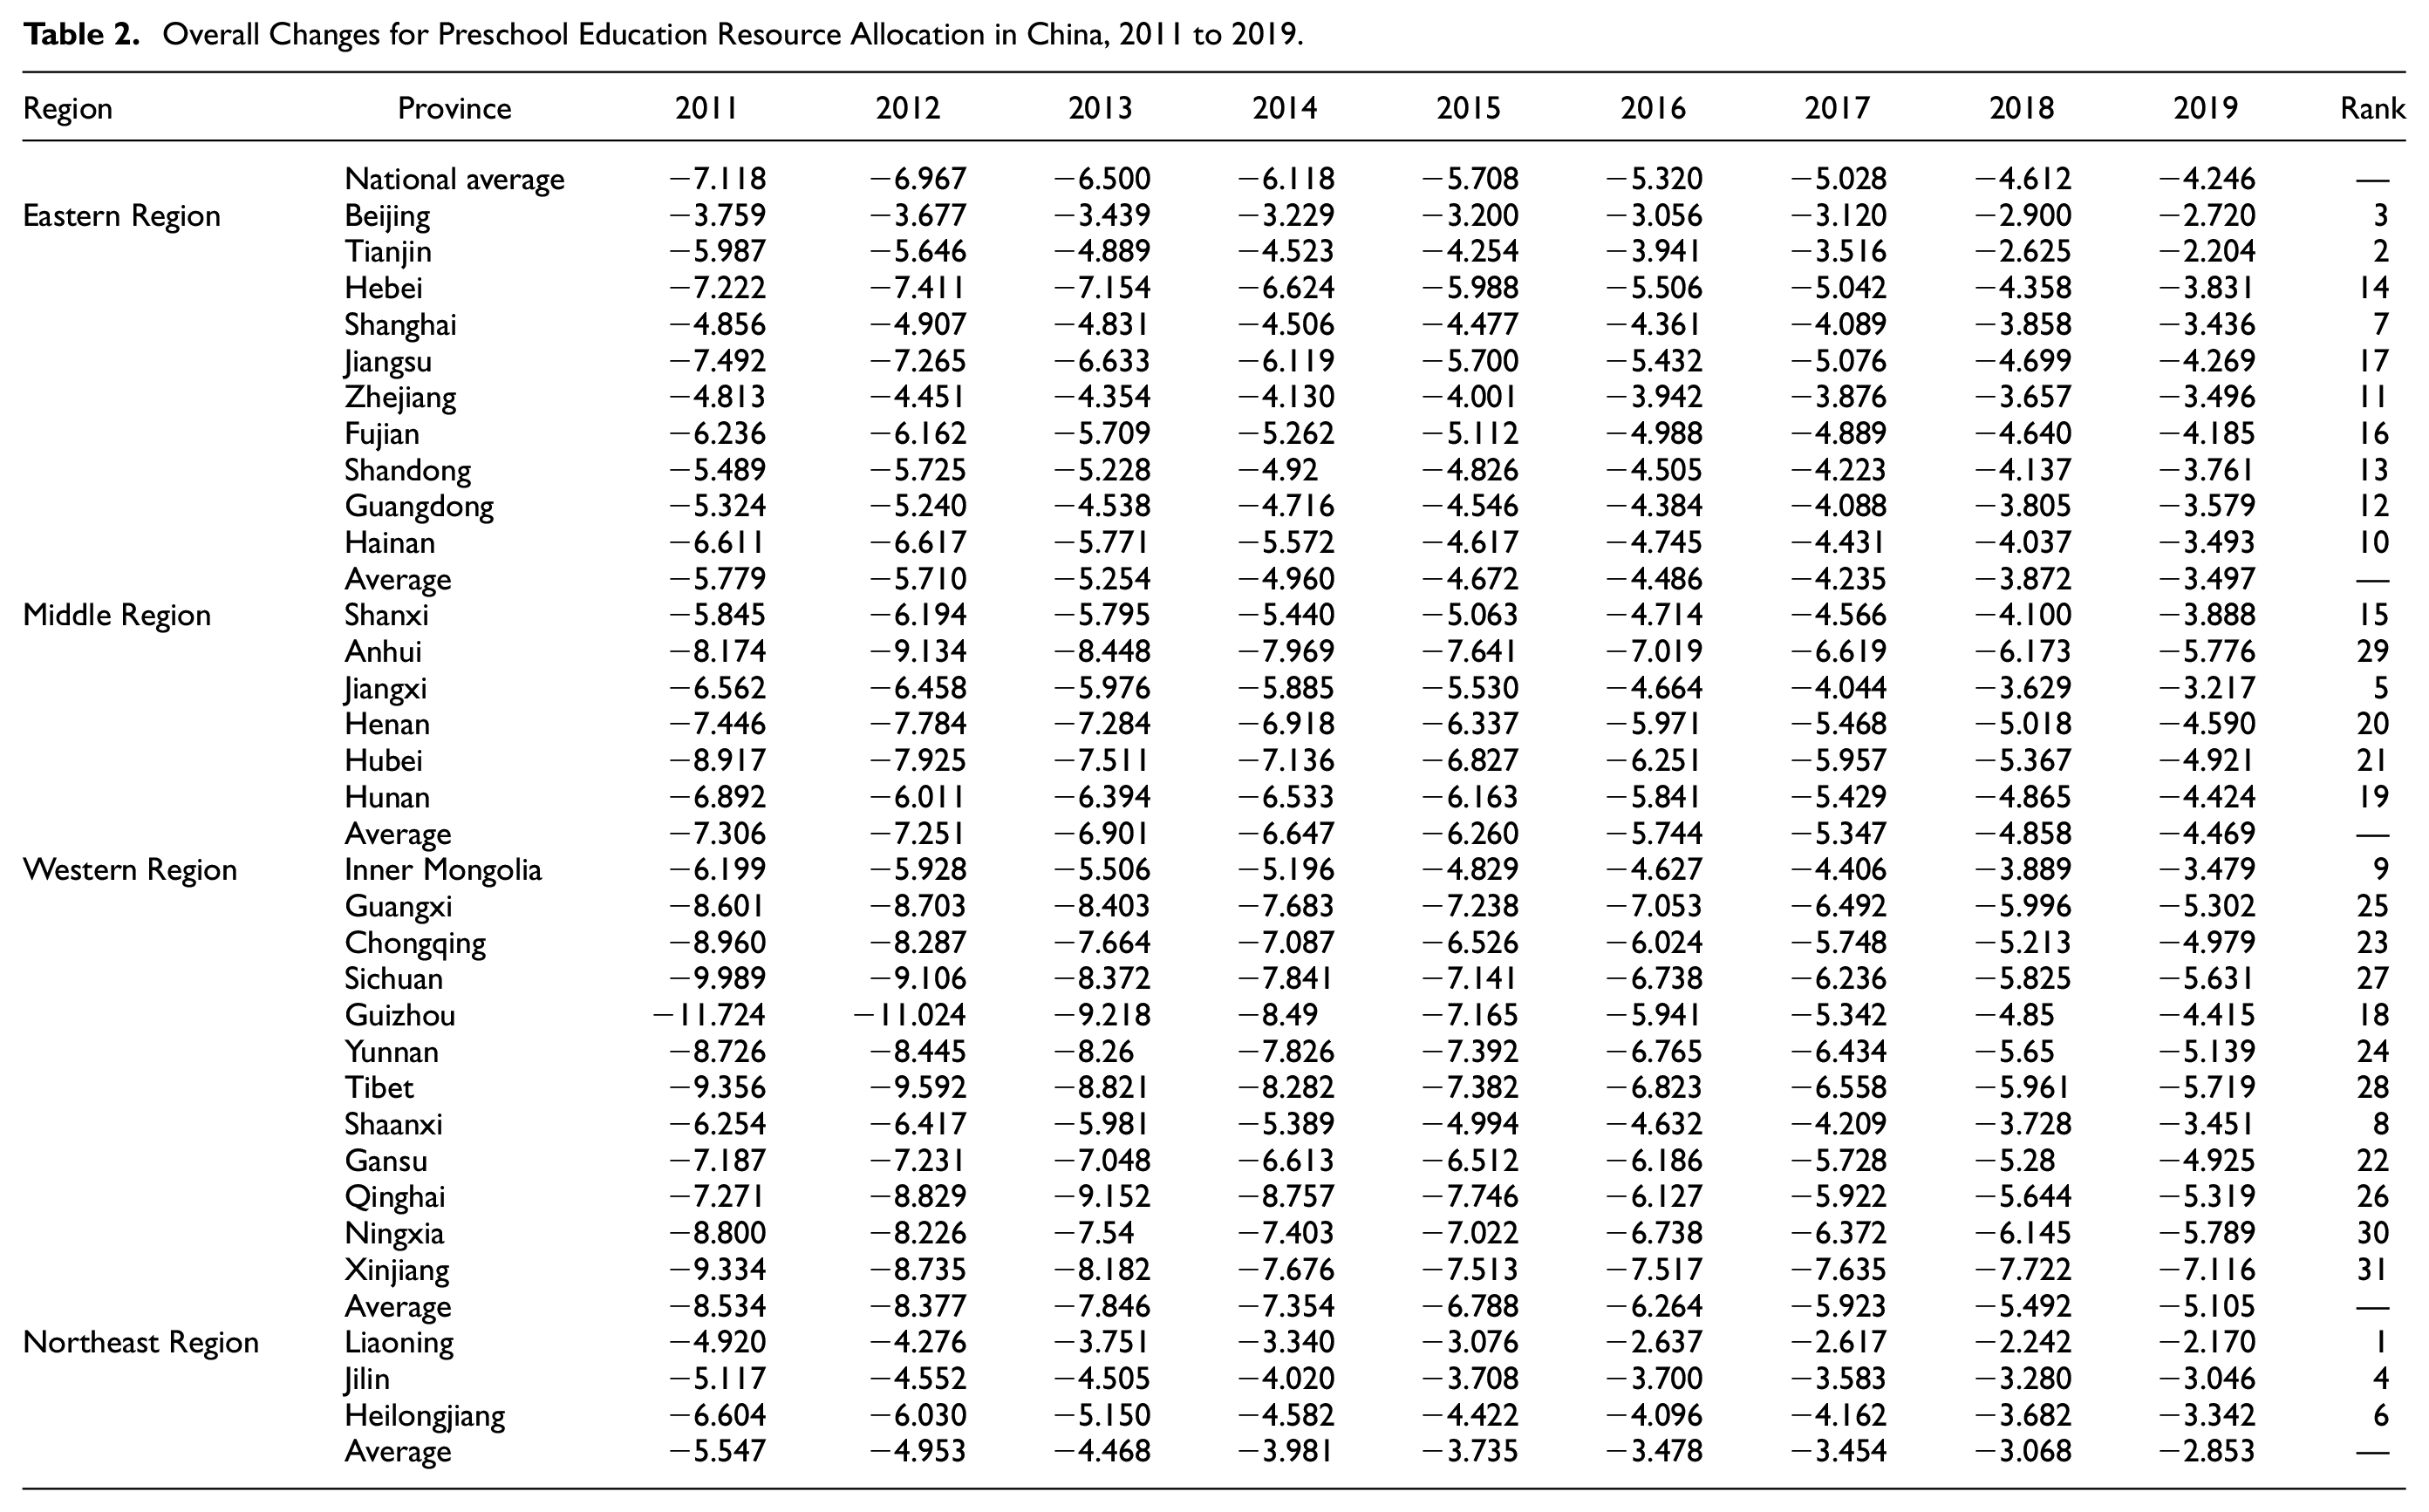
Meanwhile, there are two things worth noting. Firstly, the high level of preschool education resource allocation in the Northeast is rooted in the region’s long-standing reality of low fertility. The average fertility rate in the region was 6.4‰ in 2011 (compared to a national average of 13.3‰) and has fallen to 6.1‰ in 2019 (compared to a national average of 10.4‰). Under the effect of low fertility, the northeast region significantly outperforms other regions on two indicators: class sizes and pupil-teacher ratio. Taking class sizes as an example, in 2019, class sizes were 20 in the Northeast, 26 in the Middle, and 28 in the Eastern and Western. Another point worth noting is that, Despite the level of resource allocation in western region lags behind other regions, when analyzing the development speed, the growth rate of the western region from 2011 to 2019 has surpassed that of the eastern (39.48%) and middle regions (38.83%), with an increase of 40.17%.
Observing Urban-Rural Disparity
Spatial Evolution of Urban-Rural Gaps
We selected four main years for presentation, and the time points selected were mainly based on the Three-Year Preschool Action Plans and depicted the urban-rural differences by ARCGIS. As shown in Figure 1, it seems clear that the gap between urban-rural areas has been shrinking in recent years, with all provinces gradually shifting from red to green areas. In 2011, the majority of provinces were represented by the red gamut, indicating a significant urban-rural gap. However, by 2019, only Sichuan Province remained in the orange gamut, suggesting a relatively high urban-rural disparity that still persisted.

Evolution of urban-rural gaps in preschool education resource allocation.
Urban-Rural Disparity Between Regions
When comparing the urban-rural disparities between regions, it is noteworthy that the urban-rural disparity is significantly higher in the middle region than in other regions (see Table 3). Typically, the urban-rural education disparity is related to the level of economic development. The middle region has long had better economic development than the western region, and the Chinese government has consistently regarded the western region, particularly its rural areas, as a weak point in development. However, it is possible that selective investment in educational resources in recent years has had a policy impact and caused many researchers to overlook the problems in the middle region. Specifically, as previously mentioned, the increase in the preschool resource allocation index from 2011 to 2019 was higher in the western region than in the middle region. If we persist in ignoring this matter and uphold the current approach to resource allocation, there is a significant likelihood that rural areas in the middle region will fall behind other areas directly, eventually leading to a developmental decline. To test this conjecture, we will continue the study by using a Markov chain analysis.
Urban-Rural Disparity in Different Provinces and Regions, 2011 to 2019.

Dynamic Evolution and Steady-State Formation of Preschool Education Resource Allocation: Markov Chain (MC)
Dynamic Evolution of Preschool Education Resource Allocation
The average value of the
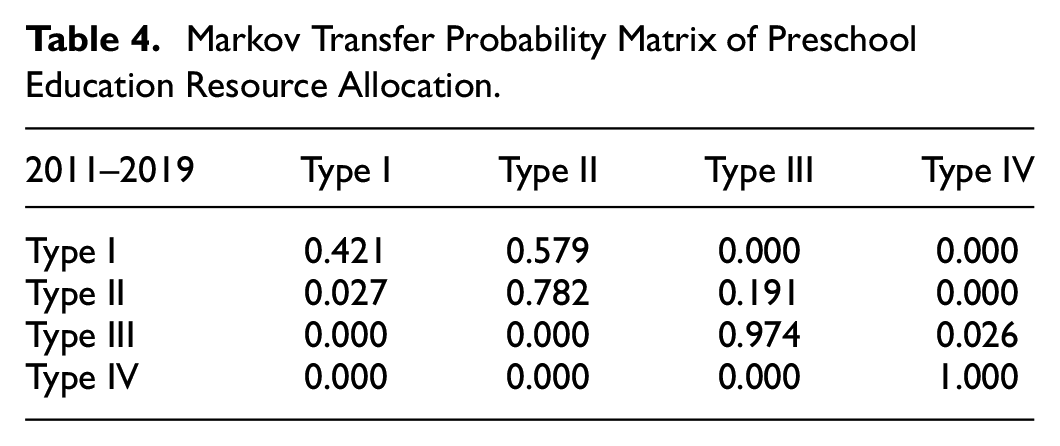
Table 4 provides clear evidence of a low level of fluidity in the observed changes within preschool education resource allocation. This suggests that the current allocation process tends to maintain its self-sustainability rather than transitioning to a higher-quality level of allocation. Notably, except for type I which has a relatively low self-conversion probability of .421, the other types exhibit high rates of self-conversion. type II has a self-conversion rate of 0.782, type III has a self-conversion rate of 0.974, and type IV has a self-conversion rate of 1. the probability of conversion between different types is relatively low. For instance, the probability of transitioning from type III to type IV is merely .026, and there is no observed interaction conversion probability between type III and type I. The exception lies in the relatively high probability of transitioning from type I to type II, which stands at .579. These pieces of evidence demonstrate that under the current investment strategy of the Chinese government in preschool education resources, it is relatively easier to enhance low-level types (type I) and elevate them to medium-low level types (type II). However, once the scale of investment reaches a certain level, it tends to stabilize, making it a slow process to transition from this stable state to a higher level of allocation type.
Markov Transfer Probability Matrix of Preschool Education Resource Allocation.
Steady-State Formation in 2025 and 2030
To address the previous question of whether continuing the current resource allocation strategy will result in a decline in development for rural areas in the middle region, we utilized the average value of the preschool education resource allocation index in rural China from 2011 to 2019 as a classification criterion to calculate the steady state probability matrix. According to Table 5, the initial distribution of resources in the rural middle region was better than in the rural western region. In 2011,41.2% and 37.0% of the rural middle region were classified as high-level and medium-high level, while in the rural western region, only 9.7% and 28.2% were classified as high-level and medium-high level. However, this is expected to change significantly by 2025. While the percentage of medium-high level (58.8%) in the rural middle region is higher than the percentage in the rural western region (30.9%), the percentage of high-level (65.0%) in the rural western region exceeds that of the rural middle region (37.8%). By 2030, this trend will become even more pronounced. With the given evidence, the hypothesis receives support. If the present resource allocation strategy persists, it is probable that policy neglects rural areas in the middle region, resulting in a developmental lag for these rural middle areas compared to other regions.
Steady-state Formation of Preschool Education Resource Allocation in Rural Middle and Rural Western.

Conclusion
This is an exploratory study of temporal and spatial changes in preschool education resource allocation between regions and urban-rural areas with the technique for order preference by similarity to ideal solution (TOPSIS), the extended linear expenditure system and the Markov chain, as well as GIS-aided analysis.
Firstly, from 2011 to 2019, there was a significant improvement in the allocation of preschool education resources in China, and the gap between regions and urban-rural areas narrowed: (1) Overall, China’s preschool education resource allocation index exhibited an upward trend, rising from −7.118 in 2011 to −4.246 in 2019. (2) The disparities between regions have been consistently diminishing, with the level of resource allocation ranked from high to low as follows: Northeast, Eastern, Middle, and Western. (3) Urban-rural differences have been significantly reduced, and the speed of reduction is faster than that between regions. In 2011, China’s urban-rural difference index stood at 5.734, but by 2019, it had significantly narrowed to 0.881. Meanwhile, Sichuan stands out with noticeably higher urban-rural differences compared to other provinces, emphasizing the urgent need for policy attention in the region.
The results of the Markov chain analysis reveal a low level of fluidity in the observed changes within preschool education resource allocation from 2011 to 2019. It indicates that, with the current scale of investment, it is relatively easier to enhance the low-level type to a medium-low level type. However, once the scale of investment expands to a certain level, it tends to reach a relatively stable state, making it a slow process to transition to a higher-quality allocation process. Furthermore, the results of steady-state formation in 2025 and 2030 highlight that by 2025, the percentage of high-level rural areas in the western region (65.0%) has surpassed that of the middle region (37.8%). This gap is projected to widen by 2030. Therefore, it is crucial for current policies to make timely adjustments to resource allocation and to pay attention to the needs of rural areas in the middle region that may be at risk of being neglected.
In summary, through the application of TOPSIS, spatial analysis, and Markov chains, this study methodically explores the disparities in preschool education across different regions and between urban and rural areas in China from 2011 to 2019. The findings indicate a progressive narrowing of regional disparities and a more rapid convergence of urban-rural educational gaps. Significantly, the equilibrium state forecasted by Markov chains suggests that, should the current investment strategy persist unchanged, rural areas in central China are poised to lag significantly in preschool education development by 2025. Consequently, it is imperative that policy adjustments are made promptly and that increased investment is directed toward preschool education resources in these rural areas. Despite employing rigorous scientific methods to assess the development of preschool education across China’s various provinces and regions, it remains uncertain whether the level of development in high-quality preschool education directly correlates with superior outcomes (e.g., students’ future academic performance). Future research should delve into the academic achievements of students from regions with varying levels of development in preschool education. This would help ascertain whether a high standard of preschool education unequivocally leads to enhanced academic performance and, if not, identify the factors that may influence this relationship.
Footnotes
Acknowledgements
The authors would like to express their gratitude for the support from the National Social Science Foundation Key Project “Research on the Implementation of Supply-side Structural Reform in the Field of People’s Livelihood Services (22AZD037)” and “the National Construction of High-Level University Postgraduate Program (CSC202206190169).” The authors also sincerely thank all the reviewers and the journal’s editorial office for their contributions.
Declaration of Conflicting Interests
The author(s) declared no potential conflicts of interest with respect to the research, authorship, and/or publication of this article.
Funding
The author(s) disclosed receipt of the following financial support for the research, authorship, and/or publication of this article: (1) The National Social Science Foundation Key Project “Research on the Implementation of Supply-side Structural Reform in the Field of People’s Livelihood Services (22AZD037).” (2) The National Construction of High-Level University Postgraduate Program (CSC2022 06190169).
Ethics Approval Statement
Ethics approval was not sought for the present study since it’s not required according to the relevant guidelines and legislation.