
Abstract
Subscription video-on-demand (SVoD) platforms have become popular among football fans in Indonesia. This study aims to analyze the factors that influence users’ satisfaction regarding their intention to continue using SVoD to watch football matches. The quantitative data in this study were based on 594 survey responses and were analyzed using the covariance-based structural equation model. The qualitative data obtained in this study were analyzed using the content analysis method. The results of this study indicate that the ease of access anytime and anywhere and the ease of use of SVoD services have a positive effect on users’ perceptions of the value they receive and that the fun and entertainment obtained from SVoD services have a positive effect on matching user expectations. In turn, matching users’ expectations has a positive effect on their views of the services and level of satisfaction, and the level of user satisfaction has a positive effect on their intention to continue subscribing to SVoD services to watch football matches. This research is expected to provide insight for SVoD service providers who broadcast football matches to help evaluate their services and improve users’ intentions to continue using the service.
Keywords
Introduction
Football is a sport that involves high enthusiasm and has an extraordinary ability to unite various groups; it also has a positive impact on psychological health and reduces stress (Martín-Rodríguez et al., 2024). Football can be enjoyed by anyone, as it can help strengthen friendships, can be played anywhere, and has simple rules. Indonesia is the country with the most football fans in the world, with the percentage of football fans in Indonesia reaching 69% (around 193 million people) in September 2022 (Annur, 2022a). More than half of the world’s population, around 3.5 billion people, watch football through various broadcasting services, such as free TV broadcasts, social media, and paid platforms (Ballerstatus, 2021). Most fans (81%) choose to watch football matches on free-to-air TV stations, while the use of over-the-top (OTT) or video on demand (VoD) is still in third position, with 68% (Annur, 2022b). In addition to these methods, fans can use illegal platforms to watch football broadcasts (Nielsen, 2016).
VoD is an application that stores all content, especially videos, in one place and can be accessed anytime and anywhere (Pereira & Tam, 2021). OTT services are similar, as they take the same form, with video content sent to end users (Schwarz, 2018). Unlike television, VoD applications allow users to adjust the speed, pause, play, and access only the content that they want (Abreu et al., 2017; Gutzeit et al., 2021; Nielsen, 2016). To access a VoD platform, an adequate device and internet connection is required, and some require a monthly paid subscription for certain content, such as movies or special broadcasting rights (Pereira & Tam, 2021; Scarlata et al., 2024). This has been implemented on VoD platforms such as Amazon Prime and Netflix (Pereira & Tam, 2021). VoD with a subscription requirement is referred to as subscription video on demand (SVoD; Stoll, 2023). Various SVoD platforms, such as Netflix, Vidio, Disney+ Hotstar, Amazon Prime Video, and Mola TV, have access to different content and various price packages (Annur, 2022a, 2022b; Scarlata et al., 2024).
Previous studies have discussed the development of SVoD technology in general and the long-term impacts of SVoD, but there has been no research that specifically discusses one specific SVoD platform, its specifications related to specific content, and subscription prices (Dhiman et al., 2022; Pereira & Tam, 2021). Pereira and Tam’s (2021) study included a major drawback, as it did not include user satisfaction and perceived ease of use but only perceived usefulness, which may have affected the results. In addition, many of the respondents in that study could not distinguish between ordinary TV and SVoD, making the results biased (Pereira & Tam, 2021). Satisfaction with using technology refers to user satisfaction with their experience in using technology products or services. This attitude can be formed when users feel happy and satisfied with using the service and think that using the service is a good idea (Caruana et al., 2000; Grace & O’Cass, 2005). Satisfaction can also raise the level of trust, thus making users believe that continuing to use this technology can help their activities (McCole et al., 2019). Menon’s (2022) study focused only on user gratification theory (UGT), and subscription and continuation intentions and other variables, such as platform selection, usage time, and content selection, were not considered. Furthermore, customer engagement and quality of service experience (QSE) were both considered unidimensional in the research conducted by Gupta and Singharia (2021). To provide more detailed and holistic research, the concept should be expanded to include other relevant variables, such as website quality and perceived usefulness (Gupta & Singharia, 2021).
This study aims to fill the research gap from previous studies by analyzing factors that may influence users’ satisfaction regarding the intention to continue using SVoD to watch football broadcasts. In this study, we adopted two theoretical models commonly used in previous research—the expectation confirmation model (ECM) and the stimulus-organism-response (S-O-R) model—to analyze the intention to continue using the SVoD platform. ECM has been used in various research contexts to measure satisfaction levels and to determine the factors that influence users to repurchase a product or service (Pereira & Tam, 2021). In this study, the S-O-R model was used because it fits the environment under study, in which an object is given to someone in the form of an SVoD application and that person has a response or impression of what they can do with that object. We used S-O-R to analyze how the interaction between stimulus, organism, and response can affect individual behavior and responses in the studied environment. This research is also expected to help SVoD service users find a quality and legal SVoD platform to watch football broadcasts, thus increasing their intention to continue using SVoD services to access football broadcasts.
Literature Review
We conducted a traditional literature review by searching journal papers from online academic databases, such as Scopus, ScienceDirect, and Google Scholar. We used the keywords VoD, SVoD, e-commerce, continuance intention, and OTT to search for articles published in the last 3 years. The search found studies discussing the development of SVoD and intentions for sustainable use, including research by Menon (2022), Pereira and Tam (2021), Dhiman et al. (2022), and Gupta and Singharia (2021).
Subscription Video on Demand (SVoD)
SVoD is a digital media content subscription service that distributes information via wired and wireless telecommunication networks in the form of videos that can be played on various devices (Bird, 2022; Palomba, 2021). The definition of SVoD comes from the term video on demand, which means broadcast services that can be controlled by its users, for example, by playing back, adjusting the sound, adjusting the playback speed, and stopping playback of a video (Alofabi, 2022). The addition of the word “subscription” means that a user makes a transaction to purchase content access rights on a VoD platform, usually for a certain period of time, such as 1 month, 6 months, or up to 1 year, with varying prices (Karnadi, 2022; Scarlata et al., 2024).
SVoD services can be accessed through various devices, such as computers, tablets, smartphones, and smart TVs, with the help of adequate internet access (Uscreen, 2022). SVoD services are carried out via streaming in real time, with video and audio data continuously transmitted from the server to the client (Cloudfare, n.d.). Just like other data transmissions on the internet, video and audio data are broken down into several data packets that are then sent using the internet and interpreted on the destination device for accessing the various video sources, and they may include direct comments on the application’s live chat and social media, such as on Twitter and Instagram (Cloudfare, n.d.). SVoD access can be made subject to availability from the SVoD provider, either through a web browser or by downloading onto a compatible device (AppsFlyer, 2022; Palomba, 2021). The content offered by an SVoD service aims to attract users’ interest and usually includes special content that other SVoD services do not have (Indri, 2020). Several platforms also have SVoD models for other genres, including e-learning, esports (gaming), sports, and fitness, health, and wellness (AppsFlyer, 2022).
Expectation Confirmation Model (ECM)
The ECM focuses on examining sustainable use behavior influenced by consumer satisfaction (Bhattacherjee, 2001). While expectation confirmation theory (ECT) is used to examine repurchases or complaints from consumers based on satisfaction influenced by expectations and consumer confirmation, the ECM combines ECT with the technology acceptance model (TAM; Oliver, 1980). The TAM was introduced by Davis (1989) to analyze the factors of acceptance of the use of information technology (IT). Bhattacherjee (2001) developed this model into the ECM based on the same conditions: the first purchase, experiences of use, and the potential to determine the decisions made. The ECM’s main concept is that consumers will confirm their pre-purchase expectations based on what they receive post-purchase to determine their level of satisfaction, which will then influence their repurchase intentions (Tsai et al., 2020).
While ECT focuses on both pre-use based on expectation variables and post-use based on perceived performance, the ECM focuses only on post-use because the confirmation and satisfaction variables are considered sufficient to describe pre-use (Bhattacherjee, 2001). Post-use is particularly important because products and services are based on consumer expectations, which may change over time (Bhattacherjee, 2001). The main idea of the ECM is that information system continuance intention is influenced by satisfaction, perceived usefulness, and confirmation (Tsai et al., 2020). Confirmation is the result of the difference between the original performance of use and the initial expectation of use (Bhattacherjee & Lin, 2015; Oliver, 1980). In addition to confirmation, perceived usefulness also affects satisfaction (Pereira & Tam, 2021). This happens because, for example, when the user has experience interacting with the system in a certain way, if there is a change, it will certainly have an impact on satisfaction with using the system (Pereira & Tam, 2021). Based on the TAM, perceived usefulness is the strongest predictor of continuance intention (Davis, 1989).
Stimulus-Organism-Response (S-O-R) Model
S-O-R is an appropriate model to use in researching subscription continuation intentions, which are influenced by aspects of the technological environment and customer experience (J.-H. Kim & Park, 2019; Y. Zhao et al., 2020). The S-O-R model includes three aspects: stimulus, organism, and response (Liu et al., 2023; Mehrabian & Russell, 1980). In the S-O-R model, the response is considered the result of user behavior (Y. Zhao et al., 2020). The S-O-R model has been thoroughly evaluated using measurement theory (Dhiman et al., 2022) and has also been used to research online learning, mobile auctions, and virtual reality (B. Kim & Kim, 2020; Ul Islam & Rahman, 2017).
The stimulus in the S-O-R model is a factor outside the organism that will make the individual respond to an influence, while the organism itself is a psychological transformation mechanism from the user, who internalizes the stimulus, into information (Q. Huang et al., 2022). The response itself represents the user’s result regarding the external stimulus information content of the relevant behavior. The S-O-R model provides a structured research perspective and solid theoretical foundation for studying the mechanisms of consumer influence on intention to continue using (Hewei & Youngsook, 2022).
Hypothesis Development
Vidio, an SVoD platform that can be accessed via a website or application, presents a variety of interesting major sporting events, especially football (Vidio, n.d.). For the 2022 World Cup, the biggest event in football, Vidio was granted broadcasting rights as a streaming service for the tournament. However, the service received many complaints from users via various sources, including direct comments on the application’s live chat and comments on social media on Twitter and Instagram (DetikInet, 2022). Users complained about Vidio itself, including that the server was down, which caused many bugs, such as no access or long buffering times (DetikInet, 2022), and they also commented on SVoD pricing. While still in the early weeks of the tournament, these complaints caused Vidio shares to fall by almost 4.48% (Andrianto, 2022). Although Vidio still has reported problems, users still use Vidio to watch football broadcasts and continue to subscribe to the service. This is known as user sustainability intention or continuance intention. User continuity intention is when a person or individuals choose to continue carrying out actions or goals that have been obtained (Ku et al., 2013).
We adapted the ECM to solve the abovementioned problems by including the following variables: perceived usefulness, confirmation, satisfaction, and continuance intention. In addition, we added enjoyment variables based on the hedonic information system (HIS) and entertainment from UGT. Finally, we also included mobility from Dhiman et al. (2022) and price fairness from Singh and Alok (2022). These variables were then put into an S-O-R framework that included price fairness, mobility, perceived ease of use, quality of service experience, enjoyment, and entertainment as stimuli; perceived value, perceived usefulness, and confirmation as organism factors; and satisfaction and continuance intention as responses. Price fairness is defined as a reference price that is given or given up to obtain a product or the process that produced a particular price (Bei et al., 2021; Zeithaml, 1988). Perceived value is described as an assessment of what has been issued based on the benefits received (Zeithaml, 1988). Mobility is defined as the ability to use or process information anywhere and anytime (de Mattos et al., 2022; Mallat et al., 2009). Perceived ease of use is defined as the extent to which a person believes that using a particular system will be free of effort (Davis, 1989; C.-H. Huang, 2021). QSE is defined as a service that is accessible across various devices, has existing features that can be used properly, can broadcast content without interruption, and provides good media and content quality (Halvaiee & Akbari, 2022). Enjoyment can be defined as the pleasure and satisfaction obtained from using IT (B. Kim & Kim, 2020). In addition, entertainment can be referred to as the use of a medium for entertainment and satisfaction, which refers to the level of pleasure and comfort achieved when using the media (Menon, 2022). Confirmation is the extent to which actual use experience confirms one’s initial expectations (Oghuma et al., 2016). Perceived usefulness is the extent to which individuals believe that using a technology will be useful for improving their work (Davis, 1989). Altogether, this study involved 11 variables and 11 hypotheses (Figure 1).

Proposed conceptual model.
Price fairness is a consumer’s assessment of price in terms of whether there are differences between a seller and other sellers and whether they are still reasonable, acceptable, or justified (Ren et al., 2022; Xia et al., 2004), which may be based on previous prices, competitors’ prices, and/or profits (Bolton et al., 2003; S. Zhao & Chen, 2021). The theoretical foundation of price fairness assumes that in an economic transaction, buyers are entitled to a fair price and sellers are entitled to a fair profit (Haws & Bearden, 2006; Yu et al., 2022). Based on this principle, if one party is ignored, a perception of injustice arises (Bolton et al., 2003; Yu et al., 2022). Previous research has used the theory of equity and the principle of dual entitlement as theoretical bases for understanding the customer’s perception of price fairness (Konuk, 2018). Acceptable and reasonable prices can determine customer judgment, and this can increase the intention to resubscribe to a service (Konuk, 2018). In the context of this research, price fairness is considered a fair, acceptable price to purchase SVoD services for watching football broadcasts. Previous research has shown a positive relationship between price fairness and perceived value (Singh & Alok, 2022). Based on this, the authors conclude the following:
H1: Price fairness (PF) affects the perceived value (PV) of a football broadcast service on SVoD.
Mobility is an important factor that researchers need to pay attention to because users appreciate the efficiency and availability of information as an important advantage of mobile services (Hill & Roldan, 2005; Zaman et al., 2021). In today’s era, online platforms offer innovative and attractive access options, which makes online platforms invaluable due to their mobility (Dhiman et al., 2022; A. Jain et al., 2020). Studies by Dasgupta and Grover (2019), Howcroft et al. (2002), and Mallat et al. (2009) have collectively underscored the significance of accessibility across various platforms, the influence of mobility in adopting OTT platforms, and the pivotal role of cellular technology in enabling consumers to access and process information seamlessly. The mobility of watching football broadcasts via SVoD provides freedom to access the content through any platform anytime and anywhere. This experience is a benefit of using SVoD that is not found in other media, such as television. This accessibility could increase the perceived value of using SVoD (Wang et al., 2020). Based on this, the authors conclude the following:
H2: Mobility (M) affects the perceived value (PV) of accessing a football broadcast via SVoD.
The perceived ease of use of an application technology is a person’s perception of using an application that does not require mental pressure or a great amount of time or effort (Nadeem et al., 2020; Raza et al., 2017). Perceived ease of use is considered an influential factor in the adoption of new technology, ranging from electronic services to electronic payments, internet banking, and so on (Kalinic & Marinkovic, 2016; Pliatsikas & Economides, 2022). In addition, Roro and Chairina (2021) concluded that a higher perceived ease of use will result in a higher perceived value because higher perceived ease of use creates a more positive user experience, increases efficiency and productivity, reduces errors, and reinforces the perception of higher value, all of which contribute to increasing perceived value because users feel that the product or service provides a better, efficient, and more valuable experience. Therefore, the authors conclude the following:
H3: Perceived ease of use (PEOU) affects the perceived value (PV) of a football broadcast accessed via SVoD.
In the context of SVoD, QSE is defined as a service’s ability to be utilized on various devices, good content availability, uninterrupted content streaming, good media quality and relevant content quality, and user-friendliness. If an SVoD platform wants its customers to keep coming back, it needs to provide them with an experience that compels them to keep returning. This aspect of QSE has been understood by researchers as user enjoyment or annoyance with the service (Gupta & Singharia, 2021). This experience is thus a result of meeting customer expectations and, in turn, is driven by the user’s personality and current state (Lee et al., 2020). Although it is an extension of the notion of service quality related to the performance of a service, the concept of QSE tends to be more holistic because it focuses on the user’s assessment of service performance (Minovski et al., 2020; Varela et al., 2014). Thus, the following hypothesis is proposed:
H4: Quality of service experience (QSE) affects confirmation (CON) when accessing a football broadcast via SVoD.
When users feel satisfied and happy when watching a football match on an SVoD platform, they can be said to receive a positive experience (Qiu et al., 2013). There are many reasons for users to use an SVoD platform, with the satisfaction and comfort that users feel when subscribing to and using the SVoD platform being the main reasons (Mulla, 2022). More precisely, users subscribe to the SVoD platform because of a certain level of convenience (Mulla, 2022). Vidio provides features such as Highlights and Recorded Match so its users can rewatch their favorite match or moments anytime. This could provide a positive experience in using Vidio to watch football matches, thus confirming the user’s expectation of using the service. Therefore, we propose the following hypothesis:
H5: Enjoyment (JOY) influences confirmation (CON) when accessing a football broadcast via SVoD.
Previous research has found that entertainment has an impact on attitude, which influences readiness to provide suggestions and intentions to utilize certain sites (Curras-Perez et al., 2014). Entertainment is a significant predictor of current media technology use (Hicks et al., 2012) and has a positive influence on different media use (Kaur et al., 2020). The increased use of technology that drives digital media and increased internet access provides users access to content anywhere, as users have the freedom to choose content from an SVoD platform that is useful or of interest (Mulla, 2022). By facilitating legal access to watch various football matches and adding entertaining features, such as Live Chat, Fantasy Team, and Highlights, Vidio provides an entertaining experience for its users. This experience encourages SVoD users who have used it to watch football broadcasts to confirm their expectations for using SVoD. Thus, we propose the following:
H6: Entertainment (ENT) influences confirmation (CON) when accessing a football broadcast via SVoD.
The use of technology can influence someone to switch from traditional television to an SVoD platform, but this can only happen if the user understands how to use the OTT platform innovation (Mulla, 2022). Perceived usefulness can be felt by users when they are satisfied that the services provided by an OTT platform meet user expectations (Dwivedi et al., 2012). The level of confirmation or expectation will affect how users experience using the SVoD platform (Brown et al., 2012). In this study, the level of user experience regarding the expectations of using the SVoD platform (Vidio) to watch a football broadcast can affect how they perceive Vidio as useful to them. The higher the confirmation value or the level of user experience regarding the expectation of using the SVoD platform to watch a football broadcast, the more positive or higher perceived usefulness will be. Conversely, if the confirmation value is low, the effect on perceived usefulness will decrease, or perceived usefulness will not be felt. Thus, we propose the following:
H7: Confirmation (CON) affects the perceived usefulness (PU) of a football broadcast on SVoD.
Perceived value is based on the costs incurred to use a utility component (Zeithaml, 1988). This assessment can be observed from the results of contradictions and provides information related to the willingness to accept and take advantage of tangible and intangible offers (Zhuang et al., 2010). Previous studies have concluded that perceived value is related to continuous intention (Li et al., 2021; Tseng et al., 2022; Wang et al., 2020) because users’ perceived value plays a key role in maintaining relationships with them and thus influences their purchase intentions (Zhuang et al., 2010). Perceived value can be defined as a constant contributor to the intention to continue using and to continuous intention (Yang & Peterson, 2004). In this study, perceived value is related to the continuous intention of users who use the SVoD platform to watch a football broadcast. Therefore, perceived value has a good relationship with the continuance intention of using the SVoD platform to watch a football broadcast. Users who do not feel the need to continue subscribing to a SVoD platform are those who do not feel the value provided by the SVoD platform (Nagaraj et al., 2021). Therefore, we define the following hypothesis:
H8: Perceived value (PV) affects the continuance intention (CI) of accessing football broadcasts via SVoD.
From a technology standpoint, perceived usefulness refers to the extent to which consumers consider a product or service of value by adopting the technology (Kurniawan et al., 2021). Perceived usefulness also influences consumers through a positive relationship that influences individual performance and can be described as the extent to which the use of digital broadcast services increases the effectiveness and efficiency of the viewing experience (Bhattacherjee, 2001; Moslehpour et al., 2018). This variable is an essential element of the ECM (Bhattacherjee, 2001). Perceived usefulness in Bhattacherjee’s (2001) study was used to capture expectations from the use of technology in the future. Additionally, several studies have found that perceived usefulness has a positive effect on continuance intention (Lin et al., 2017; Nascimento et al., 2018; Pereira & Tam, 2021), and based on the TAM, perceived usefulness is the strongest predictor of continuance intention (Davis, 1989). This is because perceived usefulness is assisted by calculations based on time and experience. The perception that the service is useful for meeting users’ entertainment needs can influence their intention to continue to subscribe (Nascimento et al., 2018).
In this study, the effort above to better define perceived usefulness is to provide a clearer measure of how much trust a user has in using SVoD services to overcome the problem of watching football matches (Pereira & Tam, 2021). Users see continued use as a means to continue reaping the benefits they have previously experienced (Pereira & Tam, 2021). SVoD services that can provide trust and the best service tend to make users want to use SVoD in the future (Gallier, 2023). Users must believe that using the SVoD service will provide a solution to the problem of watching football (Gallier, 2023). Thus, we propose the following hypothesis:
H9: Perceived usefulness (PU) affects the continuance intention (CI) of accessing football broadcasts via SVoD.
Several previous studies have found that the level of user satisfaction can be predicted through the level of confirmation/disconfirmation (Bhattacherjee & Lin, 2015; Tam et al., 2020; Venkatesh & Goyal, 2010). The level of confirmation can be measured using the difference between expectations and actual performance when using technology (Pereira & Tam, 2021). Users will receive a high level of confirmation when low expectations meet high performance (Halimi et al., 2011). SVoD services that can meet the expectations of users or even exceed their expectations can provide satisfaction for their users (Pereira & Tam, 2021). In the context of this research, expectations can arise when users want to use the SVoD service to watch football broadcasts. These expectations can be met if there is satisfactory performance in use and in the level of service provided (Pereira & Tam, 2021). Those who continue to use SVoD services to watch football broadcasts may also do so based on satisfactory first-time experiences (Pereira & Tam, 2021). Therefore, we define the following hypothesis:
H10: Confirmation (CON) affects satisfaction (SAT) with a football broadcast service on SVoD.
According to Doll et al. (1994), end users’ satisfaction when interacting with computer application technology is an affective attitude. Bhattacherjee (2001) stated that satisfaction is the strongest predictor of continuance intention. In addition, satisfaction can measure the level of user loyalty to an application (Niu et al., 2021). The variables derived from the ECT model state that the intention to use the sustainability of an information system is determined primarily by users’ satisfaction when using it (Bhattacherjee, 2001). The effect of satisfaction comes from using technology that meets users’ expectations, so they will continue to use the technology (Shin & Jeong, 2022). The experience users get while using the SVoD service to watch football broadcasts will create an experience that impresses or satisfies them (Pereira & Tam, 2021). They will think about returning to use the service based on this experience (Pereira & Tam, 2021). Satisfaction, of course, needs to be maintained because there are other alternatives that can be chosen to watch football broadcasts, such as illegal broadcasts (Bhattacharjee, 2017). In some cases, if the user is very satisfied, they can promote the SVoD service because the football broadcast service is particularly good (Han et al., 2018). Therefore, we propose the following hypothesis:
H11: Satisfaction (SAT) affects the continuance intention (CI) of accessing football broadcasts via SVoD.
Methodology
Data Collection and Analysis
This study uses both quantitative and qualitative approaches. The purpose of a quantitative approach is to test the hypotheses, while a qualitative approach focuses more on explaining a particular phenomenon or situation by obtaining findings that do not depend on quantitative measurements or statistical analysis (Corbin & Strauss, 2015). The quantitative phase of this study involved the administration of an online questionnaire. Prior to its distribution, a readability assessment was conducted to gage the comprehensibility of the research instruments among the respondents. Several criteria were employed, including adherence to writing conventions, alignment with research objectives, and the extent to which readability allowed test participants to comprehend each question and statement in the questionnaire. This stage was carried out both online and offline and involved nine participants aligned with the intended demographic target, with diverse variations in factors such as age, location, and occupation.
A pilot study was utilized as a trial run to assess suitability before distributing the questionnaire for the actual research (Simkus, 2022). This stage was conducted using an online survey platform with 30 respondents whose demographics were tailored to Vidio application users using it to watch football matches. Reliability and validity testing were carried out through this pilot study and analyzed using IBM SPSS, with a focus on Cronbach’s alpha (CA) values. A CA value above 0.7 was considered satisfactory, indicating readiness for broader respondent distribution for data collection.
Quantitative data collection was performed through a questionnaire. The questionnaire was distributed online through various social media platforms, such as Instagram, Twitter, and Line, to swiftly gather respondents from across Indonesia. The target audience for this study encompassed Indonesian individuals who have utilized SVoD services on Vidio to watch a football match.
The qualitative data were collected through interviews discussing the proposed hypotheses identified as either accepted or rejected in the quantitative analysis. The purpose was to gain a deeper, more detailed, and clearer understanding of the outcomes. These interviews were conducted with 30 selected participants who met the criterion of being users of SVoD on Vidio for watching football broadcasts. All interviewees were respondents in the quantitative data process and analysis who agreed to be interviewed. The interview technique was chosen because it can yield data with high value and provide objective insights in line with the perspectives of each interviewee (Ryan et al., 2009). The interviews were conducted both face to face and virtually and spanned 2 weeks. We formulated a series of questions for the interviews. The outcomes of these interviews were used for qualitative data processing and analysis.
Analysis Methods
The method employed for data processing and analysis was covariance-based structural equation modeling (CB-SEM), which aims to test the modified theory derived from a previous research model and substantiate these tests through a series of analyses. Several tools were utilized for processing and analyzing the research data, including AMOS 24 for data management and analysis, IBM SPSS Statistics 26 for variable reliability measurement, and Google Sheets for calculating average variance extracted (AVE) and composite reliability (CR) values.
For the qualitative analysis, the data obtained from the interviews were analyzed using content analysis. Content analysis aims to identify patterns through the repetition of words and phrases, which are then further explored to reinforce the reasons behind the acceptance or rejection of the proposed hypotheses. This analysis allowed the authors to discern trends, patterns, and themes emerging in the respondents’ answers through a deeper exploration of relevant information to validate the proposed hypotheses (Bengtsson, 2016).
Research Instruments
The instrument employed in this study was an online questionnaire, which was divided into four sections. The first section aimed to confirm respondents’ use of SVoD on Vidio to watch football broadcasts and their willingness to participate in the questionnaire for research data collection. The second section gathered demographic information about the respondents, including gender, age, income, occupation, and education level. The third section focused on questions related to the use of SVoD on Vidio for watching football broadcasts, such as subscription duration, weekly usage frequency, satisfaction with payment methods, complaints or challenges faced, devices used, frequently used features, reasons for usage, other platforms besides Vidio, reasons for choosing Vidio over other platforms, suggested features, and future expectations. The fourth section consisted of statements related to the indicator variables of the quantitative research instrument. These indicator variables were selected based on prior studies that have validated or proven their usage in measuring the research constructs. Responses to the statements were measured using a Likert scale ranging from 1 to 5. Each level on the scale corresponded to the respondent’s opinion regarding the presented statement, with descriptions as follows: (1) strongly disagree, (2) disagree, (3) neutral, (4) agree, and (5) strongly agree. Appendix A describes the questionnaire’s measurement items, and Appendix B explains the interview questions used in this study.
Results
Respondent Demographics
Data collection was carried out through the distribution of online questionnaires for 3 weeks, from March 7 to March 28, 2023. A total of 651 participants responded, but only 594 surveys were considered valid and complete. This data met the requirements of SEM, which uses the 10 times rules requiring a minimum of 500 data responses to process data with CB-SEM (Hair et al., 2014). Table 1 describes the demographics of the respondents.
Respondents’ Demographics.

Measurement Models
Evaluation of the measurement models consisted of validity and reliability tests. Convergent validity testing involved calculating loading factors, construct reliability, and variance extracted. The first test was carried out with a convergent validity test based on the calculation value of the loading factors and AVE (Hair et al., 2010). The model successfully met validity when the value of the loading factors on each indicator was significant, namely, >0 (Hair et al., 2017). This value indicates a strong relationship between the observation variable and the construct (Santoso, 2018). All measurement items in this study met the required value for loading factors of >0.7. Next, we measured the extent to which the variation contained in the observation variable could be explained by the construct measured by looking at the AVE value (Hair et al., 2010). The accepted AVE value was >0.5 (Fornell & Larcker, 1981; Hair et al., 2010). Table 2 shows the calculation of AVE values for all variables >0.5.
AVE, CR, and CA Values.
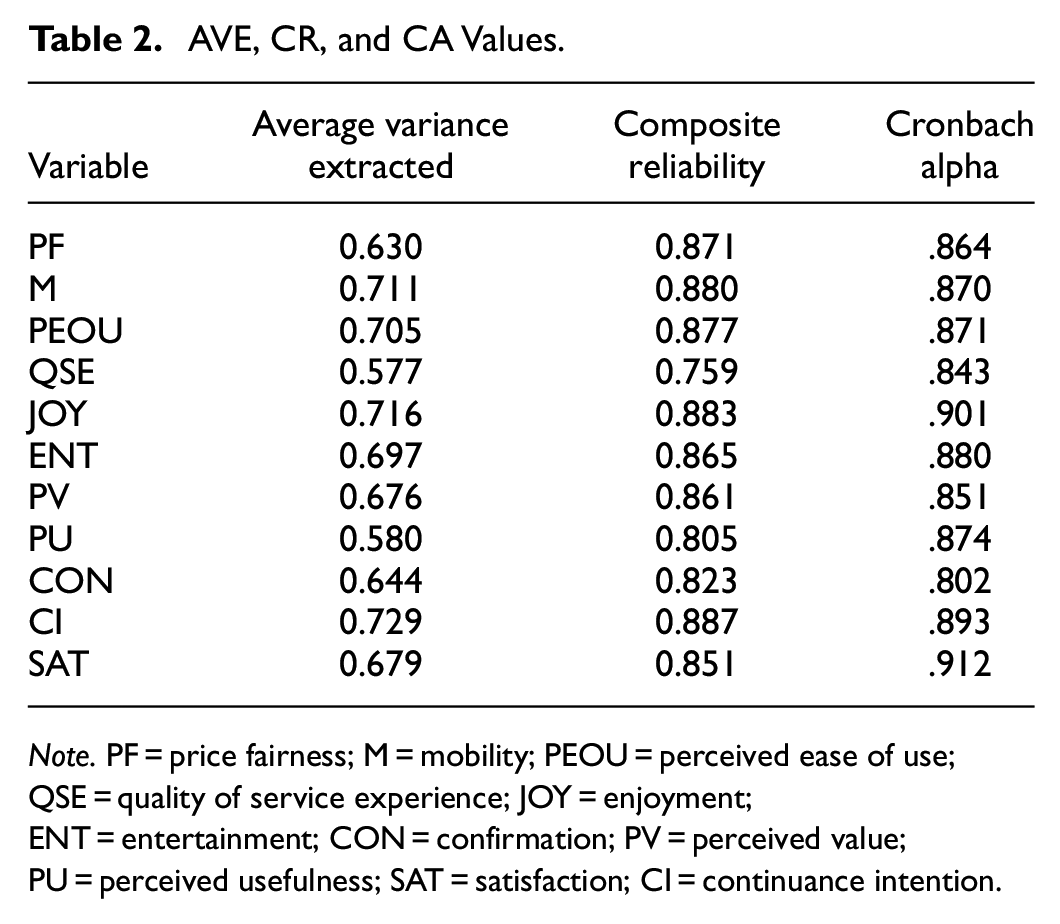
Note. PF = price fairness; M = mobility; PEOU = perceived ease of use; QSE = quality of service experience; JOY = enjoyment; ENT = entertainment; CON = confirmation; PV = perceived value; PU = perceived usefulness; SAT = satisfaction; CI = continuance intention.
The next step was to conduct a reliability test to determine whether the indicators used in the study provided consistent results (Hair et al., 2010). The test looked at two values: CR and CA. A CR value of ≥0.7 (Hair et al., 2011) and a CA value of ≥0.7 (Nunnally & Bernstein, 1994) were considered acceptable signs of reliability. The calculation of CR values was carried out with the help of SPSS 26 software. Table 2 shows the CR and CA values for each variable.
Structural Model and Hypothesis Testing
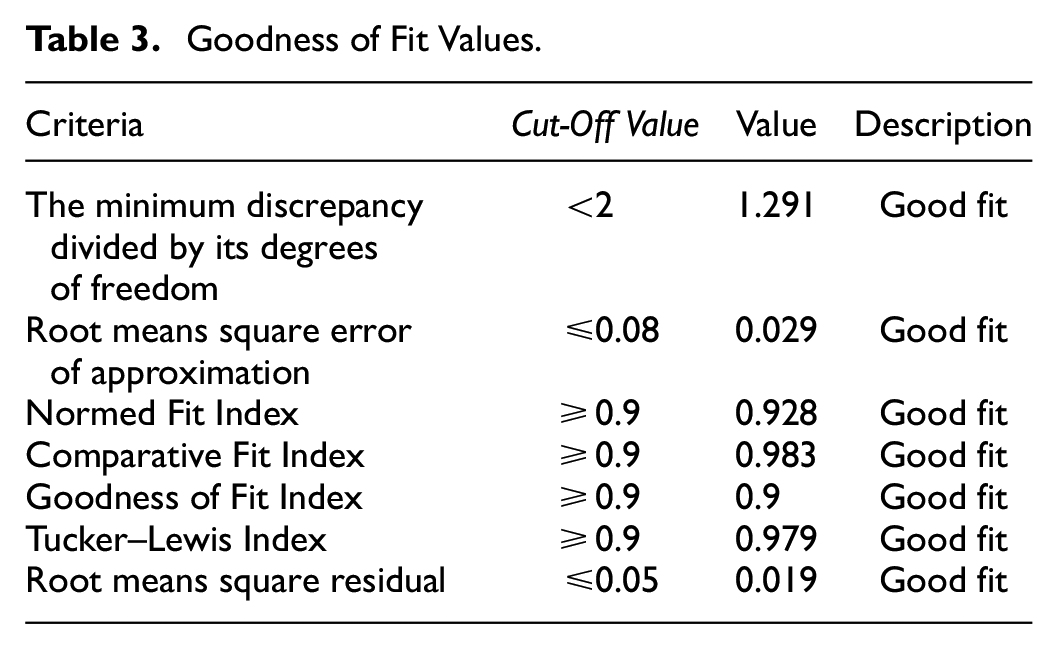
Structural model testing was conducted to estimate the relationship between the latent variables predetermined in the proposed hypotheses. This test involved evaluating goodness of fit (GoF) by considering the minimum discrepancy divided by its degrees of freedom, root means square error of approximation, Comparative Fit Index, Goodness of Fit Index, Normed Fit Index, Tucker–Lewis Index, and root means square residual values (Hair et al., 2014). The results of all GoF criteria from this research model met the cut-off values, as shown in Table 3. Thus, hypothesis tests could be carried out.
Goodness of Fit Values.
In this study, a hypothesis test was carried out with a two-tailed approach and a significance level of 5%. This hypothesis test was used to produce results based on the p-value, which was either accepted or rejected. The hypothesis was accepted if it had a p-value of <.05 and rejected if the value was ≥0.05 (Hair et al., 2014). The results of this test, which can be seen in Table 4, indicate that 7 of the 11 hypotheses were accepted.
Hypothesis Testing.

Note. PF = price fairness; M = mobility; PEOU = perceived ease of use; QSE = quality of service experience; JOY = enjoyment; ENT = entertainment; CON = confirmation; PV = perceived value; PU = perceived usefulness; SAT = satisfaction; CI = continuance intention.
Discussion
The study results show that mobility and perceived ease of use influence perceived value (H2, H3), corroborating the research by Dasgupta and Grover (2019), Dhiman et al. (2022), Alzubi et al. (2018), Mohd Suki and Mohd Suki (2017), and Wang (2014). In the context of OTT platforms in India, Dhiman et al. (2022) defined mobility as access to OTT platforms because it provides freedom of movement when using the OTT platform. Based on the results of the interviews, the ease of accessing Vidio to watch football anywhere and anytime was found to be a factor that individuals look for when they want to watch football matches, especially related to their favorite teams. As Interviewee 20 noted, “It’s good, buy a package on all devices. It’s good if you don’t stay at home and still watch on your phone.”Mohd Suki and Mohd Suki (2017) revealed that an application’s ease of use, as perceived by users, has the greatest influence on individuals in terms of their intention to use an application on mobile devices. Therefore, apps should be designed to provide users with ease in achieving this goal. In addition, the perceived value of users depends on the perceived ease of use of Vidio services, especially regarding how easy it is to learn to use, become skilled, and use SVoD for watching football broadcasts. It can be concluded that high perceived ease of use results in higher perceived value because it creates a positive user experience, increases efficiency, reduces errors, and strengthens value perception.
The flexibility and ease of watching football matches anywhere and anytime, even for past matches, are crucial to increasing Vidio’s perceived value. Thus, the confirmation of expectations of using SVoD to watch football matches is significantly affected by enjoyment and entertainment provided to users (H5, H6). This result is in line with previous studies (Eguchi, 2015; Ou Yang et al., 2023) revealing that the more comfortable the user experience when using an application, the more positive the resulting outcome. Similar to research conducted by Mulla (2022), our research shows that the consumption of content on an SVoD platform with experiences considered entertaining is a factor that makes users switch from traditional TV to OTT services. Special features, such as Live Chat, Highlights, and Quiz, enable users to interact with other users and rewatch matches. This may create an entertaining and enjoyable experience that forms their experience and judgment of the platform.
The hypothesis regarding the effect of confirmation on perceived usefulness in the use of SVoD to watch football broadcasts was accepted in this study (H7). This is in line with research conducted by Brown et al. (2012), who found that users perceive the usefulness of a VoD platform if they have a positive confirmation value or expectation of the services provided by the VoD platform. With the acceptance of this hypothesis, the effect of confirmation on perceived usefulness was also proven in the context of SVoD for watching football broadcasts, especially on the Vidio platform. In addition, if the value of the user’s perceived usefulness is positive, the confirmation value received from the service provided by Vidio is also positive. From the results of the interview, the ease of watching football broadcasts makes users feel happy and that it is worth the cost incurred to subscribe to the Vidio platform, as it makes it easier for users to fulfill their desires: “At such a price, it’s worth it, filling your free time to watch football match” (Interviewee 20).
Our findings demonstrate that satisfaction is the only factor in our research model that influences continuance intention (H11). The experience gained during the use of SVoD services creates satisfaction that makes users think about returning to use the service again (Pereira & Tam, 2021). The effect of satisfaction comes from using technology that meets their expectations, which leads them to continue using the technology (Shin & Jeong, 2022). Our respondents showed their intention to keep subscribing to Vidio because their expectations of watching football matches were met. This is supported by Vidio’s competitive advantage in terms of broadcasting rights for broadcast football matches.
However, four hypotheses were rejected due to the uniqueness of the SVoD users’ intention to watch football matches. As the users in our study were dominantly connoisseurs of football or fans of football teams, their perceptions and decisions to subscribe to the SVoD were focused on the content provided by the platform. This can be seen in the inconsistent relationship between price fairness and perceived value (H1). In the interviews, our interviewees stated that the consideration for choosing a subscription package on Vidio was based on the content and broadcasting rights of their favorite teams rather than on the price offered. One interviewee stated, “I was not too picky in choosing the package regarding how much the price was there because the most important content is not the price” (Interviewee 23). This result is in accordance with findings from previous studies using price fairness and perceived value constructs, such as research conducted by Y.-S. Huang et al. (2018) and Sulaiman and Tjhin (2023), which found that content factors, such as quality, are more significant in influencing SVoD subscription package decisions than price factors.
Surprisingly, our results indicate that service quality does not significantly influence confirmation level (H4), which contradicts research by S. K. Jain and Gupta (2015), Ong (1999), Sackl et al. (2012), and Spreng and Mackoy (1996). It has been shown that even though users experience buffering and delay problems when watching football broadcasts through SVoD services, they still have a positive perception of the service (Riekkinen, 2018). This happens because users tend to be able to tolerate QSE problems due to habits, pleasure, and other reasons. Furthermore, the content available on SVoD services can be a more important factor for users than the quality of the service itself, as stated by Interviewee 22: “The expectation at that time was to just watch it and not delay or lag. At that time, it was fulfilled, not exceeding expectations too, but quite fulfilling because I was already watching football.” However, this may be because of the lack of competition in legally providing football matches in Indonesia, so users may have no other option for watching their favorite football team. Thus, every SVoD service should provide good service quality. In other words, QSE is a standard that must be owned and not something that makes users feel that their expectations are confirmed (Shi et al., 2023).
The findings of this study also show that the continuance intention to use SVoD to watch football matches is significantly influenced by satisfaction, which is affected by users’ confirmation. However, perceived value and perceived usefulness do not influence users’ continuance intentions (H8, H9). One of the reasons for this is that users have found other SVoD platforms with more reliable features and usage, but they do not provide the preferred content, as stated by Interviewee 28: “Competitors’ broadcasting rights are still not as good as Vidio, so they [football fans] will continue to subscribe to Vidio. As long as the need to watch my favorite team is fulfilled by the video, I will continue to subscribe to Vidio.” The loyalty of watching football matches through Vidio lies fundamentally in engagement with specific football leagues or teams, as stated by Interviewee 18: “The availability of leagues where clubs like to play, because most people who like football subscribe to [watch] football plays. So, if the Premier League is not broadcast on Vidio, I will move.”
Implications
Theoretical Implications
This research aims to enhance the understanding of SVoD platforms offering football broadcasts and the factors influencing continued usage intentions. It addresses a gap in the existing research by focusing specifically on sports content within application platforms, thus contributing to future studies on VoD. While previous research has explored SVoD sustainability intentions, it has often lacked specificity regarding content expectations. This study innovatively adapts models including the ECM, HIS, and UGT, along with factors identified based on research needs (Gupta & Singharia, 2021; Menon, 2022; Pereira & Tam, 2021; Singh & Alok, 2022), within the S-O-R framework (Dhiman et al., 2022).
The results of this study show that mobility and perceived ease of use have strong relationships with perceived value, which corroborates previous studies by Agrebi and Jallais (2015), Dasgupta and Grover (2019), Dhiman et al. (2022), Vahdat et al. (2021), Wang (2014), and Wang et al. (2020). However, this study found that price fairness does not affect perceived value in the SVoD context, which strengthens the research conducted by Y.-S. Huang et al. (2018) and Sulaiman and Tjhin (2023). However, this contradicts the results of Singh and Alok (2022), although this may be due to the different context. The strong influence of entertainment and enjoyment on confirmation found in this study supports previous findings by Curras-Perez et al. (2014), Kaur et al. (2020), B. Kim and Kim (2020), Mulla (2022), Ou Yang et al. (2023), and Stewart et al. (2021). However, this study reveals an inconsistent relationship between quality of service and confirmation, which is in opposition with the results from Sackl et al. (2012). The results of the current study regarding confirmation’s effect on satisfaction are in line with Daneji et al. (2019), Halimi et al. (2011), Nascimento et al. (2018), and Oghuma et al. (2016). Another variable found to be influenced by confirmation is perceived usefulness, which agrees with research by Brown et al. (2012), Mulla (2022), and Oghuma et al. (2016). However, perceived usefulness and perceived value in this study did not affect continuance intention and is contrary to research by Nascimento et al. (2018), Pereira and Tam (2021), and Zhuang et al. (2010). This contradiction may be caused by the context of this study—using SVoD to watch football matches—which is heavily influenced by the content itself. This study also emphasizes that satisfaction affects continuance intention, as also found in the research of Bhattacherjee (2001), Bhattacherjee and Lin (2015), and McCole et al. (2019).
Practical Implications
The practical implications of this research can be used as suggestions for football broadcast SVoD service providers, particularly Vidio in the context of this research, to increase user intention to continue using its services, especially football broadcast content. Based on the results of this study, satisfaction is one factor that influences users’ sustainability intentions regarding the use of SVoD platforms, especially Vidio, for watching football matches. To increase user satisfaction, Vidio can pay attention to the confirmation factor (H10), which was proven to affect satisfaction directly. This study shows that confirmation can be improved directly by increasing enjoyment and entertainment factors. Based on the results of this research, Vidio’s platform should provide an enjoyable football broadcast viewing experience while maintaining and improving the quality of content, namely, the completeness of football leagues and increasingly complete match broadcasts. In addition, the services and features contained in Vidio for football broadcasts, including Live Chat and Highlights, can help users feel happy when using Vidio. In addition, the entertainment factor needs to be considered, for example, by presenting an innovation that can provide its own excitement for its users, especially football fans. Vidio’s platform may also present new features that can enable users to interact with other users, such as participating in live polls during matches. The interactive feature allows users to give their opinions, for example, about the referee’s decision on the match, the best player, or the crucial moment in the match.
Conclusion
The results of this study show that the mobility and perceived ease of use of an SVoD platform service affect the perceived value of using the service to watch football broadcasts. This shows that the availability of easy and flexible access to SVoD services to watch football broadcasts is one of the main factors providing the expected value of using such services. Furthermore, the comfort felt by users (enjoyment) and their feelings of pleasure or entertainment in using SVoD services to watch football broadcasts affect the confirmation of users’ initial expectations of the service. This shows that users’ comfort and feelings of pleasure are factors that confirm their initial expectations, which then affect the level of user satisfaction with SVoD services in watch football broadcasts. Finally, the continued intention to use SVoD services to watch football broadcasts is influenced by the level of user satisfaction with the SVoD service. Thus, further research could analyze in detail the impact of emotional, psychological, social, and cultural bonds on continuance intention to use SVoD.
This study has several limitations that can be improved in future research. First, most respondents were male, thus making a comparison between men and women difficult. This could be because the majority of football fans are men. Second, the research respondents were predominantly in the age range of 17 to 25 years, so they did not represent respondents in all age ranges. Thus, further research should involve more respondents older than 25 years. Next, this research focused only on Vidio as an SVoD service for watching football broadcasts in Indonesia. The low competition of SVoD platforms to watch football matches in Indonesia could be a determining factor in the results of this study. The limitations that have been identified can be used as reference points for improving and developing research in the future.
Footnotes
Appendix A. Questionnaire
Part 1. Validation
Have you ever used the Vidio application to watch football broadcasts? Yes/No
Part 2. Demographics
Part 3. Questions Related to the Use SVoD
Part 4. Measurement Items.
Declaration of Conflicting Interests
The author(s) declared no potential conflicts of interest with respect to the research, authorship, and/or publication of this article.
Funding
The author(s) disclosed receipt of the following financial support for the research, authorship, and/or publication of this article: We want to convey our gratitude to the Faculty of Computer Science, University of Indonesia for the internal research grant number NKB-12/UN2.F11.D/HKP.05.00/2024.
Ethical Approval
The ethical approval is not required for our study.
Data Availability Statement
Data sharing not applicable to this article as no datasets were generated or analyzed during the current study.