
Abstract
This study aims to predict financial soundness for sustainability of European banking system using machine learning techniques. A sustainable banking system ensures the efficient use of economic resources, manages risks in a balanced manner, and contributes to long-term financial stability and economic continuity both at the sectoral and national levels. In this context, this study constructs a banking soundness index based on the financial soundness indicators determined by the IMF. The study sample consists of liquidity, asset quality, capital adequacy, and, profitability data of banking system of 51 European countries between 2008 and 2023. However, due to lack of data, financial soundness indicators of 28 European countries were included in the analysis and the data are processed using min-max normalization methods. ANN, MLR, and DTR methods were applied and, ANN machine learning method provided the highest success (R2 = .996, MAE = 0.007, RMSE = 0.011). The findings of the study demonstrate the effectiveness of the model in providing early warnings regarding the financial soundness of these institutions, contributing significantly to the academic literature by evaluating the long term sustainability of financial system. It is essential, however, to recognize that while a unified index allows for consistent cross-country comparisons and risk assessments, it may not fully encapsulate the unique characteristics of individual banking systems. Therefore, complementary country-specific analyses will be crucial for comprehensive risk assessments.
Introduction
The sound and stable structure of financial institutions enables countries to utilize their economic resources efficiently and to manage and allocate risks appropriately. In recent years, the intersection of financial soundness and long-term financial viability has become increasingly prominent in the formulation of national economic policies. The recent global financial crises emphasized the importance of establishing sustainable and resilient financial structures. Continuous monitoring and assessment of financial soundness is critical for economic stability at both national and international level. Having a sound and stable structure of financial institutions is also important for creating a resilient financial structure against shocks that may be experienced in the economy. Furthermore, financial soundness helps the banks maintain its competitive position and contributes to the elimination of possible financial risks in achieving stable development (Kliestik et al., 2020). Given the increasing emphasis on financial resilience as a foundation for macroeconomic stability, numerous studies have explored the predictive assessment of financial institutions’ soundness (Ben Abdallah et al., 2020; Karkowska, 2019; Moufty et al., 2021; Nosratabadi et al., 2020; Pampurini & Quaranta, 2018; Seguí-Mas et al., 2018; Torre Olmo et al., 2021).
Crises have adversely affected the economy, such as an increase in unemployment and a decrease in consumption and investment. The banking system has always been at the center of crises. The European banking sector, one of the largest in the world and an integral part of the global financial system, has naturally had its share of crises.
European banks are stronger than they are today thanks to the reforms made after the 2008 Global Finance Crisis (GFC; Couppey-Soubeyran et al., 2020). European banks, which were exposed to the combined negative impact of the increase in bad loans and assets as a result of the COVID-19 shock, were not affected as negatively as the GFC crisis (Borri & Giorgio, 2022). Although banks had difficulties in liquidity and risk management during this period, they continued their activities by adapting to the conjuncture more easily due to their previous crisis management experiences. In order to meet the increasing credit demands experienced during this period and to reduce the risk of non-performing loans, they tried to maintain their financial soundness by developing policies such as restructuring credit terms.
The Russia-Ukraine war that emerged in 2022 following the COVID-19 pandemic period increased global financial stability risks. Banks have tightened financing conditions, causing them to struggle with firms increasingly indebted due to COVID-19 and reducing their own revenues and profits. Therefore, European banks have earned less profit during this period. These developments have led banks to need early warning models to monitor and take precautions against similar negative events in the future (Ioannidis et al., 2010).
Financial soundness has been a subject of interest in the literature as it provides the opportunity to foresee the efficiency, stability, long term viability, and resilience of banks in the financial system against crises. There is no standard method to measure financial soundness in the literature. This study aims to contribute to the literature by applying machine learning techniques in financial soundness analyses.
The International Monetary Fund (IMF) has developed a set of financial soundness indicators to assess the soundness and vulnerabilities of the financial system. As a result of the surveys conducted in member countries, indicators were prepared in two groups as the main and supporting set in June 2001. It has been observed that there is no clear definition of the financial soundness index of financial institutions in the literature, and there is a lack of tendency toward calculation in the studies on this subject. This study provides a soundness-focused approach using the IMF’s set of financial soundness indicators. At the same time, developments in the global financial sector, which interact with the principles of long-term financial stability, encourage a comprehensive study of financial soundness through innovative methodologies. By overcoming the limitations of traditional methods, machine learning models can analyze large amounts of financial data in real time to identify early warning signs of potential financial distress, allowing banks and regulators to take proactive measures to mitigate risks and prevent crises. The aim of this study is to construct a banking soundness index for European countries based on the core set of financial soundness indicators published by the IMF. In addition, by using machine learning techniques, it is aimed to determine the importance of these techniques in predicting the soundness of financial institutions and the most appropriate method for index estimation. For this purpose, the data of 28 European countries between 2008 and 2023 are used in the study. The variables within the sub-indicators are normalized employing the min-max normalization technique, and the financial soundness index is formulated utilizing the principal component analysis (PCA) methodology. Furthermore, methodologies from machine learning, including artificial neural networks, multiple linear regression, and decision tree regression, were implemented.
Financial soundness indicators are vital for the long-term survival and stability of banks. At the same time, financial regulators around the world focus on soundness indicators to determine risks and capital requirements. Soundness indicators also have a strong predictive power in identifying banks at risk of failure. They provide early warning signals and enable timely intervention.
The study focused only on financial soundness indicators, leaving profitability, economic, and other financial indicators out of the analysis to predict the financial soundness index. The reason for this is to provide a solid and reliable assessment of the banking system. In other words, while profitability is important for the long-term success of a bank, it is not always the best indicator of financial soundness. For example, a bank may be highly profitable in the short term but may have underlying weaknesses in its balance sheet or risk management practices, making it vulnerable to future shocks.
The findings of this study show that the dynamic and comprehensive construction of the financial soundness index, the use of machine learning techniques, goes beyond traditional methods and reveals the potential to detect weaknesses in the financial system in advance, and the index created for European countries can be an effective tool in determining financial stability. While using the IMF’s financial soundness indicators more accurately analyses the condition of financial institutions, machine learning methods help to predict future risks by shedding light on deeper relationships beyond historical data. By introducing an innovative approach to financial analysis, these findings contribute to detecting economic crises through early warning systems and strengthening financial regulation at the regional level.
Traditional financial soundness analyses are generally based on static models and assessments based on predefined econometric assumptions, focusing on specific financial ratios and variables.
In contrast, data-driven techniques use algorithms such as machine learning to analyze complex, multidimensional datasets without a priori ideas about the relationships between variables. These innovative methods can dynamically adapt to changing data patterns, process incomplete or imbalanced data more effectively, and uncover insights that traditional approaches may miss (Bitetto et al., 2023; Holopainen & Sarlin, 2017; Kim et al., 2020; Tekaya et al., 2020). Thus, it can evaluate and calculate financial soundness in a more comprehensive manner.
Traditional models such as CreditRisk+ and financial fragility theory focus on structural risk and capital adequacy assumptions. Machine learning models complement these by capturing nonlinear interactions and hidden patterns that traditional approaches may miss. This integration enhances the ability to forecast systemic risk in complex banking environments.
To reinforce the theoretical grounding of the study’s hypotheses, the inclusion of banking risk management frameworks—particularly the Basel Accords—is essential. The Basel Accords offer a structured regulatory foundation that emphasizes the importance of capital adequacy, liquidity standards, and comprehensive risk assessment in promoting financial system resilience (Basel Committee on Banking Supervision [BCBS], 2011). These principles directly intersect with the financial soundness indicators defined by the IMF, forming a cohesive framework for evaluating institutional viability (International Monetary Fund [IMF], 2006). By aligning the predictive model with these regulatory standards, the study frames financial soundness not as a static attribute, but as a dynamic and risk-sensitive construct. This alignment supports the hypothesis that machine learning models, by capturing complex interactions among risk dimensions, can enhance traditional approaches to financial soundness assessment—particularly in anticipating systemic vulnerabilities and strengthening early warning systems.
Although the concept of financial soundness has been widely researched in the literature, the limited number of studies using machine learning methods has been the motivation for this study. Estimating financial soundness with machine learning methods will enable both policymakers and institutions that supervise and regulate the financial sector to make faster and more accurate decisions. The findings of the study are expected to contribute to the creation of strong financial systems that are compatible with long-term financial stability goals. In addition, these findings are expected to provide guidance for policy-making processes to ensure financial stability at the global level. It will contribute to the development of early warning systems against financial crises.
In this context, financial soundness is considered a fundamental component of sustainable banking, as it supports both institutional resilience and systemic stability. The developed financial soundness prediction model in this study is grounded in financial stability theory, offering a dynamic structure that functions as an early warning mechanism during times of crisis. Moreover, the application of machine learning techniques within the framework of information processing theory enables more flexible and effective analysis of complex financial data compared to traditional methods. Accordingly, the unified soundness index facilitates a comprehensive assessment of systemic risks not only at the individual bank level but also at the regional scale.
The study consists of five chapters, including introduction and conclusion sections. In the second section, a literature review on the financial soundness index is presented. In the third section, machine learning models and data sets are explained. The fourth section presents the findings obtained from the analysis. In the last section, suggestions and conclusions are given.
This study contributes to the literature by developing a unified banking soundness index using IMF indicators and comparing three different machine learning methods. The empirical results show that artificial neural networks (ANN) achieved the highest prediction accuracy (R2 = .996), demonstrating their potential for early warning systems in sustainable banking.
Literature
Financial soundness indicators are used to assess a bank’s ability to survive adverse market conditions. The specific limits for these indicators may vary according to the political, economic, social and financial conditions of each country (Sundararajan et al., 2002). International institutions and researchers determine financial soundness variables and analyze the effects of these variables on the financial system with different methods. The IMF, which is one of the international organizations, regularly announces financial soundness variables for each country. The banking sector is one of the research areas where financial soundness variables are tested. Banks can provide important signals about investment, consumption, cash flow in the market, and the effectiveness of monetary policies (Arzova & Şahin, 2023).
The development level of financial markets is directly influenced by both positive and negative developments in the banking sector, which is a critical component of the system. The viability and stability of the banking system positively contribute to the overall development of the financial system. In this context, financial soundness indicators offer crucial insights into the performance and long-term operational continuity of the banking sector. Financial soundness variables for banks generally reflect capital adequacy, liquidity, asset quality, and profitability (Rahman, 2017).
When the literature on financial soundness is examined, it is seen that studies have been conducted in wide range of areas such as, factors affecting financial soundness and determinants of financial soundness (Van-Thep & Day-Yang, 2019), the effect of financial soundness indicators on bank profitability (Albulescu, 2015), the effect of financial soundness on the performance of banks (Ahmed & Dogarawa, 2021; Fapohunda & Eragbhe, 2017; Karadağ, 2021), its relationship with macroeconomic variables (Babihuga, 2007; Kirimi et al., 2022), financial soundness index estimation (Cevik et al., 2013; Nmadu et al., 2020), examining the COVID-19 pandemic and financial soundness of banks (Dunbar, 2022; Tran et al., 2022), analyzing the relationship between competition and soundness in the banking sector (Eyüboğlu & Eyüboğlu, 2018; Mohapatra et al., 2023), its relationship with crisis (Navajas & Thegeya, 2013; Vermeulen et al., 2015) and the impact of financial soundness on sustainability (Kasselaki & Tagkalakis, 2014). This shows that the subject of financial soundness is a remarkable subject for researchers.
This shows that financial soundness is a highly significant area of interest for researchers. In recent years, the scope of financial soundness analysis has expanded to include governance quality, sustainability practices, innovation capacity, and artificial intelligence-based prediction techniques. For example, Zimon et al. (2022) analyzed the impact of sustainability reporting on corporate reputation and found that CEO behavior significantly influences this relationship, emphasizing the role of governance structures in shaping perceptions of financial soundness, particularly in ESG-sensitive sectors. Similarly, Shafeeq Nimr Al-Maliki et al. (2023) highlighted the critical role of board characteristics and corporate social responsibility practices in promoting innovation and long-term organizational resilience. At the macro level, Arzova and Sahin (2024) examined the effect of financial soundness indicators on bank performance in countries included in the MSCI Emerging Markets Index, underlining the importance of these indicators in systemic performance evaluations. From a methodological perspective, Salehi et al. (2011, 2016) demonstrated the predictive power of artificial neural networks and data mining techniques in financial forecasting, which supports the use of machine learning-based models in this study. Additionally, Gleißner et al. (2022) proposed a comprehensive framework for measuring financial sustainability, while De Moraes and Pinto Bandeira de Mello (2024) revealed a strong connection between financial stability and transparency in socio-environmental policies. Collectively, these studies show that financial soundness should be approached not only through traditional indicators, but also through a multidimensional lens incorporating governance, sustainability, and AI-based modeling approaches.
The aim of the study is to reveal the success of machine learning methods that provide early warning in terms of the financial soundness of the system for a sustainable banking system. For this purpose, the methods used in financial soundness index prediction and the literature summary of the studies on the success of the methods are presented in Table 1.
Literature Review.
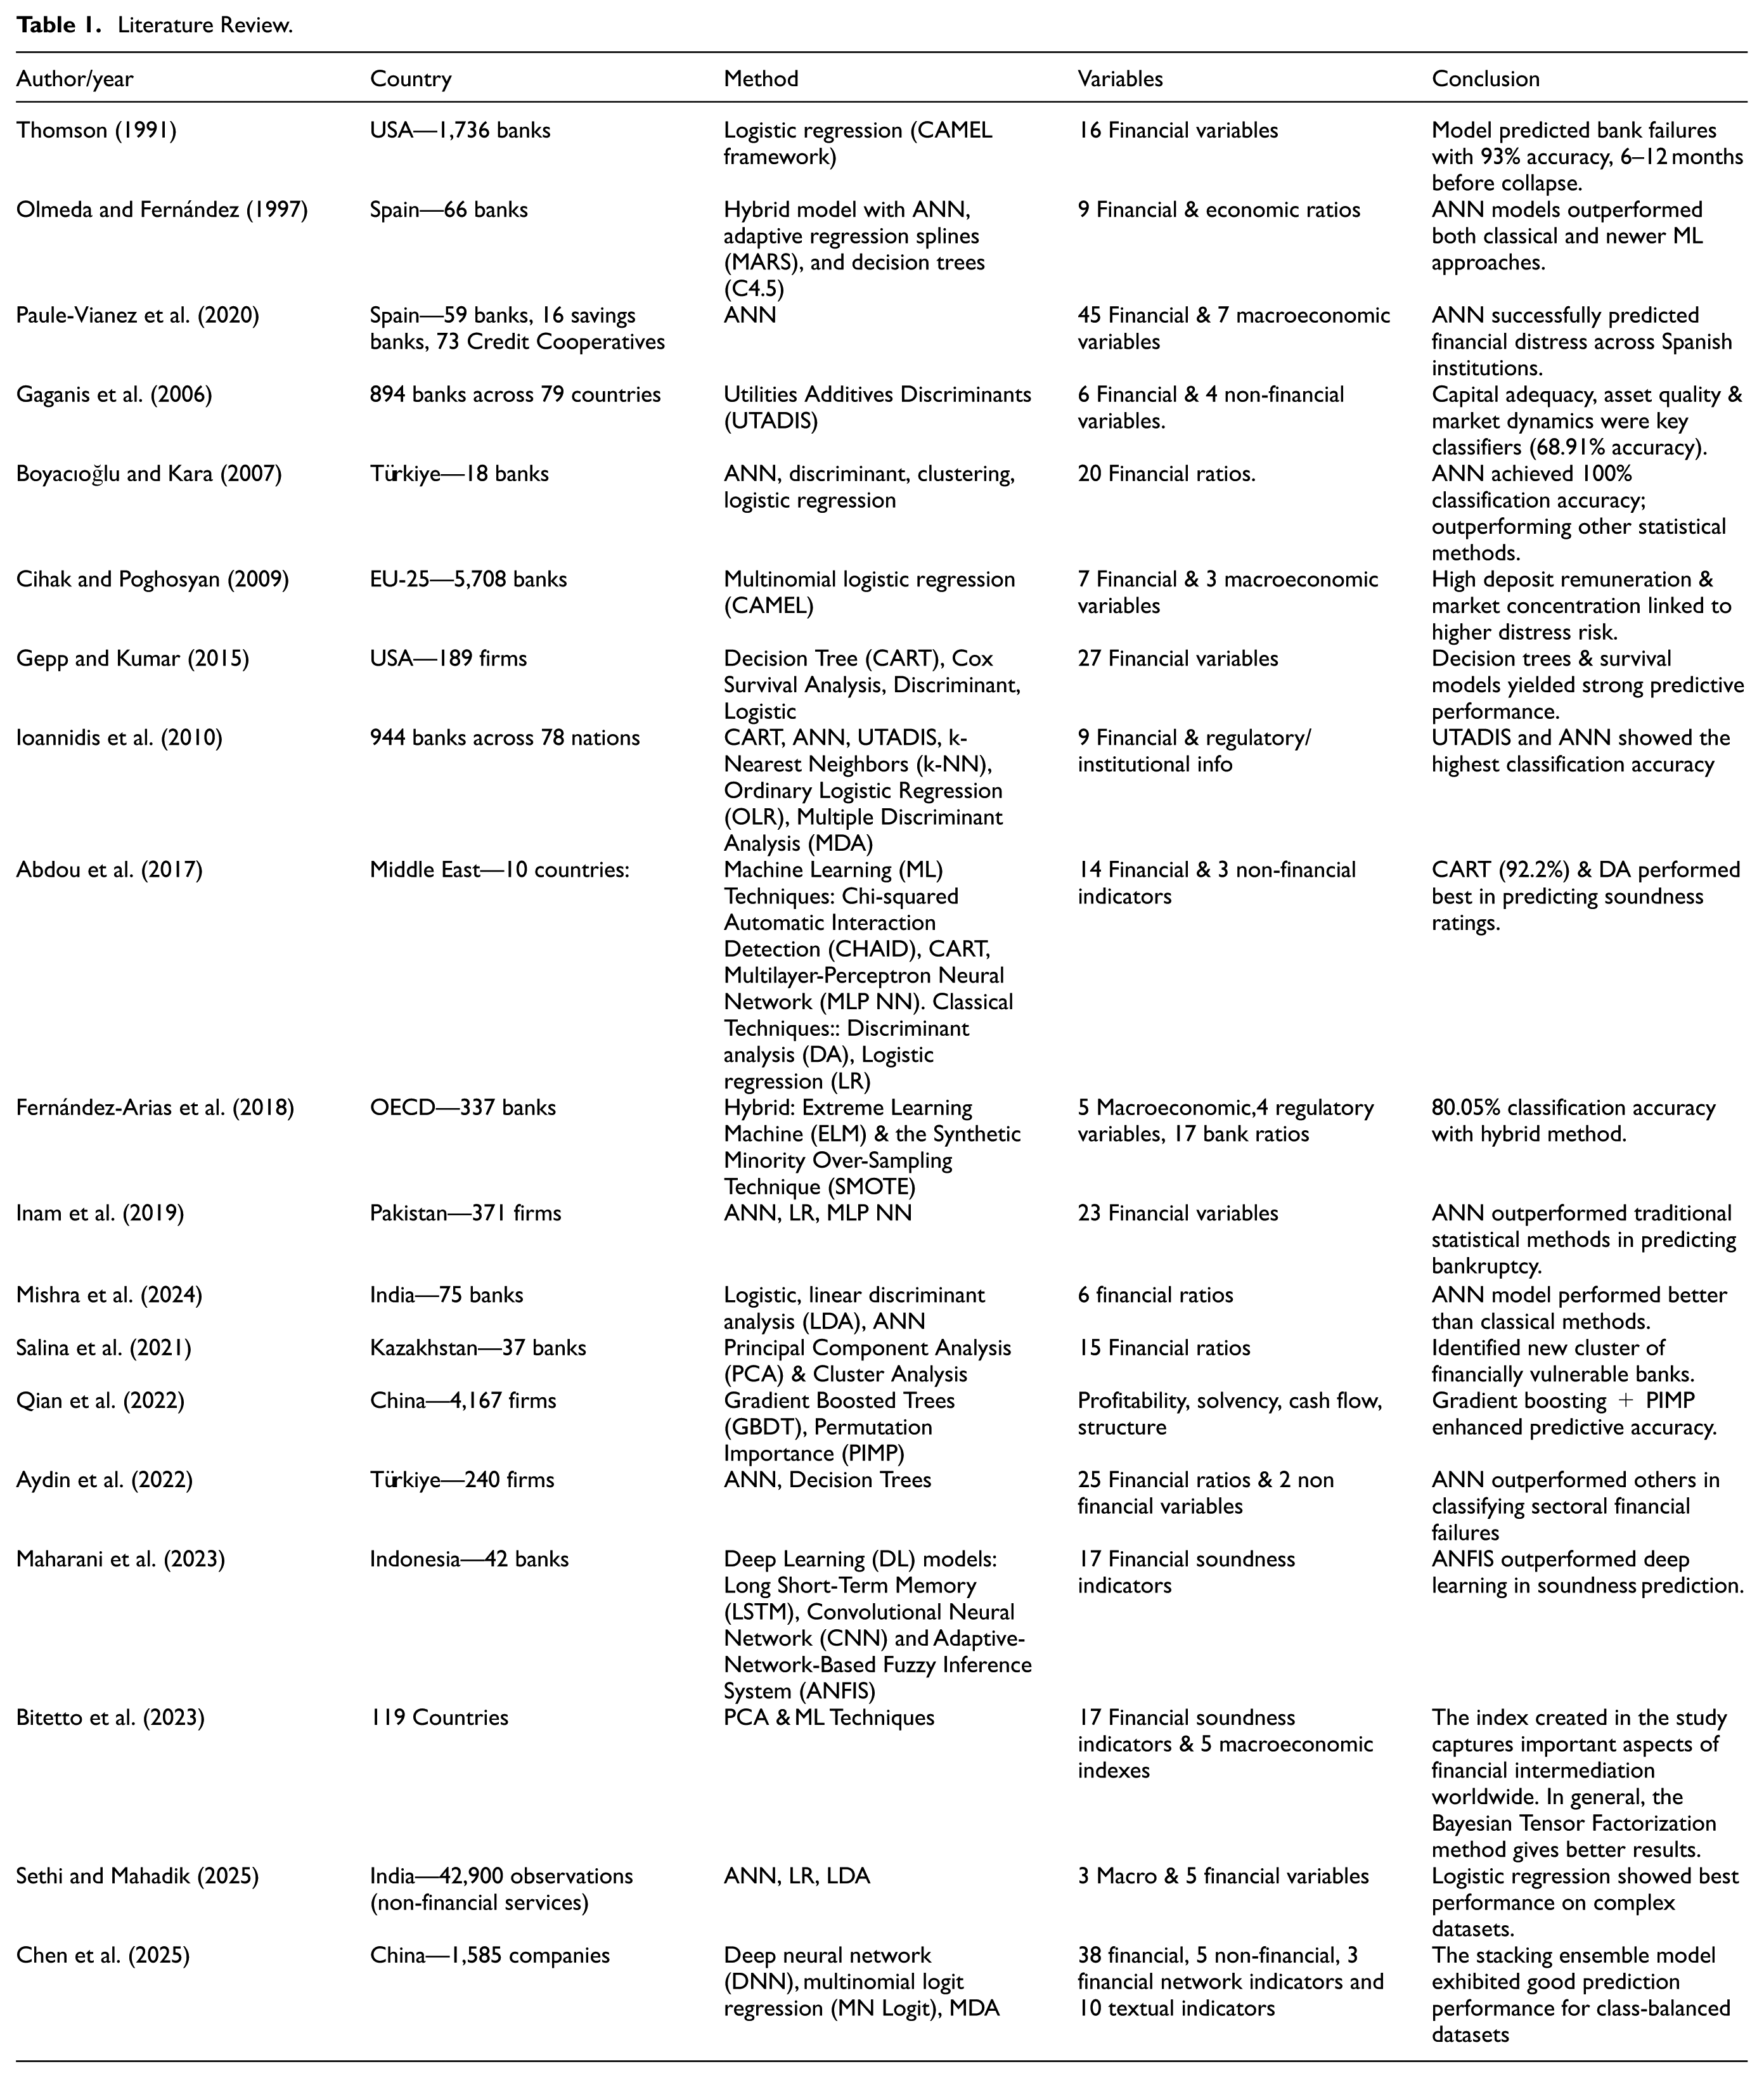
When the relevant literature is examined, it is noteworthy that machine learning techniques have been used in recent studies aimed at predicting financial soundness. In the literature, it can be observed that machine learning methods have also been employed to predict financial soundness indexes in various sectors outside the banking sector. In general, financial soundness indicators have been chosen as variables in these studies, and in some cases, economic indicators have also been considered as variables alongside financial indicators. When examining the selected samples in the literature, it is evident that analyses have been conducted primarily using bank data from different countries rather than focusing solely on banks from a specific country.
The literature on bankruptcy prediction and financial soundness estimation reveals a strong preference for ANN and hybrid models over traditional statistical methods. Olmeda and Fernández (1997) highlighted the superiority of ANN models compared to classical classifiers, advocating for the combination of multiple techniques for better risk assessment (Olmeda & Fernández, 1997). Gaganis et al. (2006) found that UTADIS outperformed discriminant analysis and logistic regression in assessing bank soundness. Boyacıoğlu and Kara (2007) confirmed the ANN model’s higher classification performance in estimating the financial soundness of Turkish banks (Boyacıoğlu & Kara, 2007). Chen et al. (2025) introduced a stacking ensemble model that integrates deep neural networks, multinomial logit regression, and multivariate discriminant analysis, proving effective for financial soundness estimation. Mishra et al. (2024) also demonstrated the soundness of ANN in explaining financial distress among banks. Fernández-Arias et al. (2018) criticized the limitations of ANN, proposing a hybrid approach that combines extreme learning machines with oversampling techniques for improved financial soundness estimation (Fernández-Arias et al., 2018). Inam et al. (2019) found that ANN outperformed other methods in predicting bankruptcy for non-financial firms in Pakistan (Inam et al., 2019). Qian et al. (2022) evaluated various models, concluding that the PIMP-XGBoost model offered superior prediction accuracy and interpretability (Qian et al., 2022). Lastly, Aydin et al. (2022) established a model using ANN and decision trees, finding that ANN was particularly effective in classifying financial failures across different sectors (Aydin et al., 2022). Bitetto et al. (2023) explored the use of principal component analysis in conjunction with machine learning methods to estimate financial soundness indices (Bitetto et al., 2023). Sethi and Mahadik (2025) concluded that LR is the best model for prediction but they also stated that ANN and LR model are quite similar because ANN is very close to LR in terms of accuracy (Sethi & Mahadik, 2025). Overall, the studies emphasize the effectiveness of ANN and hybrid models in financial analysis and prediction.
As a result, there is no absolute truth about which method is more successful and it is seen that the number of prediction studies conducted with machine learning is limited. Therefore, the study investigated the method that estimates financial soundness more accurately using machine learning methods in order to support the literature with new findings and to make an innovative contribution.
In this context, the study seeks to answer the question of which method is more reliable and successful in measuring financial soundness by applying ANN, multiple linear regression (MLR) and decision tree regression (DTR) machine learning methods.
In addition to the descriptive synthesis, methodological divergences are also present in the literature. For instance, Sundararajan et al. (2002) and Cihak and Poghosyan (2009) support equal weighting for financial soundness indicators, whereas Bitetto et al. (2023) and Babihuga (2007) advocate for risk-adjusted or data-driven weighting approaches. This highlights the importance of carefully selecting a weighting method that aligns with the analytical objective. Moreover, although artificial neural network (ANN) models are effective in capturing nonlinear patterns, they are frequently criticized for their “black box” nature and lack of interpretability. While ANN models demonstrate high predictive accuracy (Holopainen & Sarlin, 2017; Kim et al., 2020), their limited transparency can be a barrier in regulatory environments that demand explainability. The existence of recent studies examining the Asian and U.S. banking systems provides a valuable basis for comparison in highlighting the institutional and structural uniqueness of the European banking system (e.g., Salehi et al., 2016; Zimon et al., 2022).
Materials and Methods
The data of 51 European countries were examined in the study. However, due to lack of data, financial soundness indicators of 28 European countries were included in the analysis. In this study, machine learning-based economic models were developed using data from 28 European countries. ANN, MLR, and DTR methods are used in the study.
Data Set
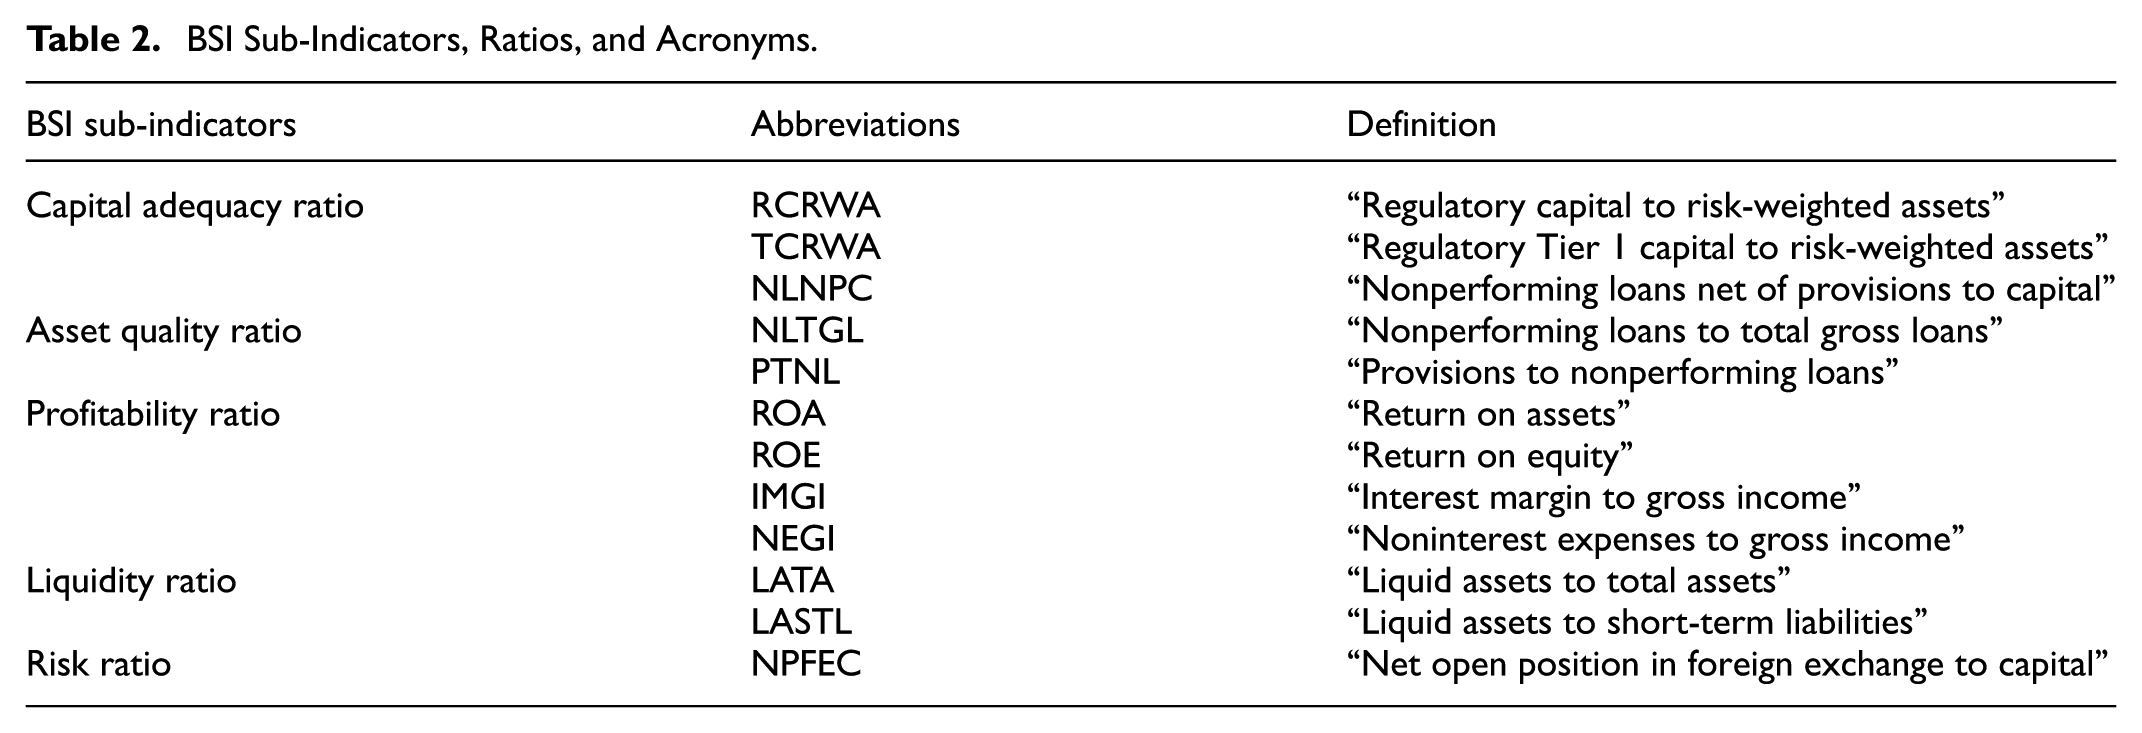
In this study, a banking soundness index is constructed for 28 European countries by considering the core set of the IMF’s financial soundness indicators. The dependent variable of the model is the Banking Soundness Index. For this purpose, a total of 12 variables are used in the study and cover the data between 2008 and 2023. The variables used in the study were obtained from the IMF’s datasheet (International Monetary Fund, 2023). To calculate the index, capital adequacy, asset quality, profitability, liquidity, and market risk are divided into sub-indicators. The sub-indicators and abbreviations of the variables used in the study are shown in Table 2.
BSI Sub-Indicators, Ratios, and Acronyms.
Although the initial dataset comprised 51 European countries, only 28 countries were included in the analysis due to substantial missing data (over 20%). This limitation potentially affects the representativeness and generalizability of the findings. To mitigate this, listwise deletion was applied for transparency, and robust validation techniques (e.g., 10-fold cross-validation) were used to ensure model reliability.
For the ANN model, a grid search approach was applied to determine the optimal number of hidden layers (4) and neurons per layer (3), and the learning process was validated using 10-fold cross-validation.
According to the core capital concept of the Basel Committee on Banking Supervision, the ratio of capital to risk-weighted assets and the ratio of Tier I capital to risk-weighted assets are indicators that measure the capital adequacy of depositors. The ratio of non-performing loans to capital after provisions measures the possible impact of non-performing loans on capital, and this indicator also reveals the repayment capacity of the sector. The ratio of non-performing loans to gross loans indicates asset quality problems in the loan portfolio. A high level of non-performing loans can be attributed to cyclical reasons as well as to the bank’s relatively flexible lending policy, which refers to non-performing loans that cannot be collected when due. Whatever the reason, such non-performing loans will lead to a loss of income for the bank. Return on assets and return on equity indicators show how efficiently depositors utilize their assets. Banks with high profitability are expected to be more relaxed in pricing, while banks operating with low profit margins are expected to charge competitive prices to attract more deposits and extend more loans. In addition, these indicators are considered efficiency criteria for bank management. The ratio of interest margin to gross income is an indicator of the share of net interest income in gross income. The ratio of non-interest expenses to gross income shows the relative share of non-interest expenses in gross income. The ratio of liquid assets to short-term liabilities indicates the level of liquidity required to meet short-term liabilities. The ratio of net open foreign currency position to capital indicates the vulnerability of the sector. It measures the extent of pressure on banks in case of exchange rate depreciation. Descriptive statistics of banking soundness index sub-indicators are shown in Table 3.
Descriptive Statistics of the Variables.
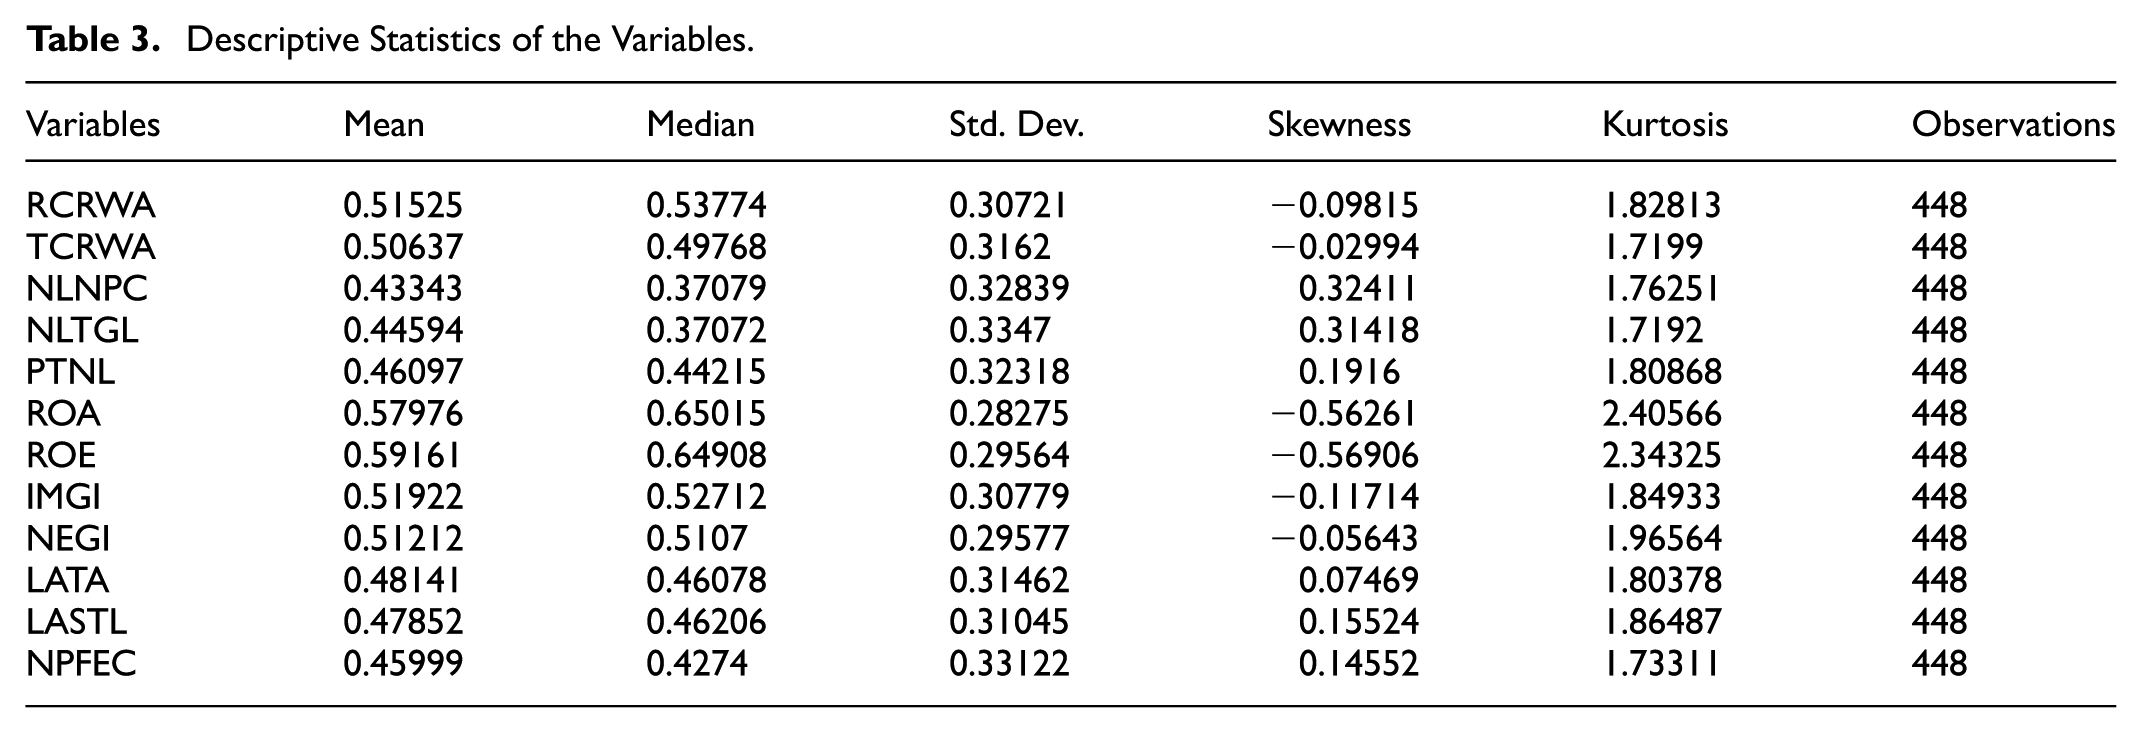
According to the descriptive statistics in Table 2, the mean and median values of the variables are generally close to each other. When the standard deviation values are analyzed, it is seen that the highest values belong to NLTGL (0.3347) and NPFEC (0.33122) variables. This indicates that NLTGL and NPFEC variables are the ratios with the farthest distribution. The fact that the kurtosis of the distribution varies between 1.7192 and 2.40566 indicates that the distribution shows asymmetric characteristics. Negative skewness values indicate that the distribution is skewed to the right, while positive skewness values indicate that the distribution is skewed to the left. It was observed that the sharpness values of the variables showed an equal distribution.
The BSI was computed using PCA, a dimensionality reduction technique that aggregates standardized financial indicators (capital adequacy, asset quality, profitability, liquidity, risk). This approach ensures that the index captures the underlying variance among indicators while minimizing redundancy.
To ensure the robustness and generalizability of the predictive models, a 10-fold cross-validation procedure was applied to all three methods—ANN, MLR, and DTR. This approach involved partitioning the dataset into 10 equal subsets, training the model on nine of them, and validating it on the remaining one in rotation. The average performance metrics across folds were found to be highly consistent with the original model evaluation results (see Table 4), confirming the reliability of the predictive outcomes. Specifically, the ANN model maintained high predictive power with R2 = .994, MAE = 0.008, and RMSE = 0.012, closely mirroring the full-sample results (R2 = .996, MAE = 0.007, RMSE = 0.011). Similarly, MLR and DTR yielded stable performance under cross-validation, further supporting the robustness of the modeling framework.
Evaluation of Models.

Additionally, to evaluate model performance under different economic conditions, an out-of-sample test was conducted by excluding observations from major global crisis periods—namely the 2008–2009 Global Financial Crisis and the 2020–2021 COVID-19 pandemic. The ANN model was re-estimated using the adjusted dataset, and the results (R2 = .991, MAE = 0.009, RMSE = 0.015) demonstrated that the model retained high predictive accuracy, indicating its resilience and applicability across varied macroeconomic scenarios.
Machine Learning
Machine learning is an important discipline in artificial intelligence and computer science that aims to mimic the way humans learn and focuses on the use of data and algorithms (Chen et al., 2025). Machine learning, which has an important place in the growing field of data science, is used to train algorithms with statistical methods to make classifications and predictions and obtain valuable insights in data mining projects (Tutcu et al., 2024). Machine learning algorithms are primarily designed to classify objects, find patterns, predict outcomes, and make informed decisions.
ANN was selected due to its ability to model complex nonlinear interactions and learn data-driven representations without prior distributional assumptions. MLR, as a benchmark traditional statistical method, was included for comparison and interpretability. DTR was incorporated for its capability to manage heterogeneity and its visual interpretability in decision-making processes. Each model was described in its own subsection (3.2.1–3.2.3) with theoretical underpinnings, algorithmic structure, and implementation logic to ensure transparency and reproducibility of the methodology.
Artificial Neural Network
Artificial neural network (ANN) is a machine learning model inspired by the working principles of the human brain. ANN mimics the way the simple biological nervous system works (Kayakuş et al., 2024). In other words, it is the digital modeling of biological neuron cells and the synaptic bond between these cells. ANNs are used to solve complex problems and recognize patterns in data. They mimic a mathematical model of neurons, the nerve cells in the human brain (Qamar & Zardari, 2023).
Figure 1 shows the structure of artificial neural networks. Artificial neural networks consist of basic units called neurons. Each neuron receives inputs, processes these inputs, and produces outputs. Neurons process inputs by multiplying them with weight values and applying an activation function. As a result of these processes, the output of the neuron is determined. Artificial neural networks organize neurons in layers (Dastres & Soori, 2021).

Structure of a neuron.
A neural network typically comprises three types of layers: the input layer, hidden layers, and the output layer. The input layer is the initial point where data enters the network. Between the input and output layers lie one or more hidden layers, which are responsible for processing the data. These hidden layers receive inputs from the preceding layer, apply weighted computations and activation functions, and transmit the processed information to the subsequent layer (Dongare et al., 2012). Each hidden layer may comprise a larger number of neurons to capture and represent increasingly complex features within the data. The output layer, positioned at the end of the network, generates the results, and is typically tailored to the specific task at hand, such as classification or regression.
The basic working principle of artificial neural networks is to take input data and pass it through a series of computations and transformations to produce outputs. Feedforward networks are the process by which input data travels forward through the network. Each neuron multiplies the inputs by weights, sums the results, adds bias, and applies an activation function. Backpropagation is the process by which the network calculates its errors and adjusts the weights and biases. The error between the output values in the output layer and the actual values is calculated and propagated backwards through the network (Kabas et al., 2023).
Multiple Linear Regression
Regression is a statistical method used to understand the relationship between two or more variables and to model how one variable affects the other. The main objective is to understand the effects of independent variables on one or more dependent variables and to predict these effects (Basheer & Hajmeer, 2000).
Linear regression is a statistical method used to express a dependent variable by one or more independent variables in a linear model (Basheer & Hajmeer, 2000). Its main purpose is to understand the relationship between the dependent variable and the independent variable(s) and to predict the value of the dependent variable using this relationship. A regression model with a single independent variable is called simple linear regression (Jobson & Jobson, 1991).

When the dependent variable is explained by more than one independent variable, the appropriate approach is to employ a multiple linear regression model. Multiple regression has more than one prediction variable.

Here, Y is the dependent variable, xn values are independent variables, β values are model parameters, and € (epsilon) is the error value.
Decision Trees Regression
Tree-based learning algorithms are among the most utilized supervised learning techniques. Decision trees, in particular, offer a hierarchical structure that represents the relationships between input and output variables within a single interpretable tree framework (Piekutowska et al., 2021). In supervised machine learning, decision tree algorithms can be applied to both classification tasks, involving categorical outcomes, and regression tasks, involving continuous variables.
Decision trees are a classification technique that constructs a hierarchical tree structure composed of decision nodes and leaf nodes, based on features and target variables. The algorithm operates by recursively partitioning the dataset into progressively smaller subsets. Each decision node may branch into multiple paths, reflecting different attribute conditions, while the initial node is referred to as the root node. Decision trees are capable of handling both categorical and numerical data, making them versatile tools for various supervised learning tasks (Saha et al., 2021).
A decision tree is composed of three fundamental components: the root node, internal (or decision) nodes, and leaf nodes. The root node, located at the top of the tree, represents the entire dataset and serves as the initial point from which the decision-making process begins. Decision nodes evaluate specific features and apply binary conditions, directing the data to different branches. At the leaf nodes, the final decision points, the model provides the final classification or regression prediction (Cetin & Yastikli, 2022).
In the CART algorithm, decision tree nodes are split into sub-nodes based on threshold values of the input features. Various splitting criteria are employed by decision tree algorithms to determine the optimal way to partition a node into two or more branches, depending on the nature of the data and the learning objective (Song & Lu, 2015). The process of generating sub-nodes aims to enhance the homogeneity within each resulting group. The selection of the splitting criterion depends on the type of the target variable: for categorical outcomes, entropy and Gini impurity are commonly used, whereas for continuous variables, the least squares method is typically applied (Thomas et al., 2020).
Entropy serves as a measure of uncertainty or disorder within a dataset. A dataset containing instances of a single class exhibits low entropy, indicating high purity. Therefore, during the decision tree construction process, the objective is to perform splits that minimize entropy, as more homogeneous partitions contribute to improved predictive accuracy (Bishnoi & Hooda, 2022).

In this context, p(x) represents the proportion of instances belonging to a specific class, and H denotes the entropy. The goal in building a decision tree is to perform splits that reduce entropy, thereby increasing the purity of the resulting nodes. To identify the most effective split, the concept of information gain is employed, which quantifies the reduction in entropy achieved by a particular division (Holub et al., 2008). Information Gain:

In this framework, S represents the original dataset, while D denotes a partitioned segment of S. Each V corresponds to a subset of S, where all subsets V are mutually disjoint and collectively reconstruct the entire set S. Information gain is defined as the reduction in entropy resulting from a split—that is, the difference between the entropy of the dataset prior to the split and the weighted sum of the entropies of the resulting subsets based on a given attribute.
The CART algorithm determines optimal splits by maximizing the homogeneity of sub-nodes using the Gini Index as a splitting criterion. The Gini Index quantifies the degree of purity within a dataset at a specific node in a classification tree, with lower values indicating higher homogeneity among class labels (Nowozin, 2012). Gini Index:

Here, C denotes the total number of distinct classes within the target variable used in the classification task. pi is the proportion of each class in the data set. The Gini Index has a value between 0 and 1. 0 indicates that the data set at the node is completely homogeneous (pure), that is, it belongs to only one class. 1 indicates that the data set is not homogeneous and contains more than one class.
Results
In the study, a series of operations were performed for the analysis and evaluation of the data. These are respectively normalization, partitioning (training and testing), machine learning analysis, and evaluation (Figure 2).

Working system.
The dependent variable in the model is the Banking Soundness Index. To estimate this index, 12 independent variables were utilized: rcrwa, tcrwa, nlnpc, nltgl, ptnl, roa, roe, imgi, negi, lata, lastl, and npfec. Each of these variables is supported by a longitudinal dataset covering a 31-year period from 1990 to 2020.
In the initial phase of the analysis, the data were normalized using the Min-Max normalization technique. This scaling method transforms the values of each variable in the dataset into a predefined range—typically between 0 and 1—ensuring comparability across features with different scales. Generally, it is used to convert feature values to a range between 0 and 1. However, another desired range can also be selected. In this study, all variables were scaled to a range between 0 and 1 using Min-Max normalization to ensure consistency and comparability across the dataset. The smallest value of the data is 0 and the largest value is 1, and all other data are spread over this 0 to 1 range (Mathan et al., 2018).

In this equation, xi is the normalized data, xi is the input value, xmin is the smallest number in the input set, and xmax is the largest number in the input set.
The coefficient of determination (R2) measures the degree of alignment between the actual values and the model’s predictions. It is computed as the proportion of the variance in the dependent variable that is explained by the independent variables. R2 values range from 0 to 1, where a value of 0 indicates that the model fails to explain any of the variability in the outcome, while values closer to 1 reflect a stronger goodness of fit and higher explanatory power of the model. Such a result indicates that the data is not suitable for the model and the model should be changed (Akossou & Palm, 2013; Shantal et al., 2023). Conversely, an R2 value of 1 (or 100%) indicates that the model accounts for all the variability in the dependent variable, signifying a perfect fit and excellent explanatory power.

Mean Absolute Error (MAE) represents the average of the absolute differences between the actual and predicted values. This metric evaluates prediction accuracy by calculating the mean of the absolute errors, without considering their direction (Malallah et al., 2021).

where e is the error and n are data count.
Measures the average magnitude of the difference between actual values and predicted values. It does this by taking the square root of the meaning of the differences between the actual and predicted values. The RMSE acts like a penalize as it gives more weight to large errors by mathematical operation (Varshini et al., 2021).

In this study, three distinct machine learning models were developed: artificial neural networks (ANN), multiple linear regression (MLR), and decision tree regression (DTR). The most successful model was determined by evaluating the success of these models.
In the artificial neural network approach, a feedforward model was designed with 12 input neurons and a single output neuron. The number of hidden layers was determined using a trial-and-error strategy, which involves testing various network configurations to identify the architecture that yields optimal performance based on accuracy, error metrics, and other evaluation criteria. This method is a basic approach to hyperparameter optimization and is usually applied by testing on training and validation data (Bozak & Aybek, 2020; Kisi et al., 2013). Based on the trial-and-error procedure, the optimal network configuration was found to include four hidden layers, each comprising three neurons, as this structure produced the most successful performance outcomes. The architecture of the model is illustrated in Figure 3.

ANN model.
The study employed the sigmoid activation function, which maps input values to an output range between 0 and 1. This non-linear function enables the network to capture complex patterns by introducing non-linearity into the model, facilitating the learning of intricate relationships within the data.

A feedback learning algorithm was used in the study. In this method, 500 iterations were performed.
To ensure the robustness of the findings, a 10-fold cross-validation procedure was conducted, confirming the consistency and stability of model performance across different data partitions. As presented in Table 5, the average performance metrics derived from the cross-validation process closely mirror those obtained from the full dataset analysis. For example, ANN achieved R2 = .994 and RMSE = 0.012 in cross-validation, compared to R2 = .996 and RMSE = 0.011 in the original evaluation (see Table 4), indicating a high degree of consistency and generalizability.

Cross-Validation Results for ML Models.

Table 4 presents a comparative evaluation of the performance of three machine learning models: ANN, MLR, and DTR. Model effectiveness was assessed using three key metrics: the coefficient of determination (R2), Mean Absolute Error (MAE), and Root Mean Square Error (RMSE). Among the models, the ANN demonstrated the highest level of predictive accuracy, achieving an R2 of .996, alongside notably low error rates (MAE = 0.007, RMSE = 0.011), indicating an excellent fit to the dataset. MLR also yielded strong performance results (R2 = .989, MAE = 0.011, RMSE = 0.021), although it was marginally less accurate than the ANN model. In contrast, the Decision Tree Regression model showed substantially weaker performance, with an R2 of .729, MAE of 0.059, and RMSE of 0.102, reflecting a relatively poor fit and reduced predictive capability compared to the other two approaches.
Figure 4 illustrates the coefficient of determination (R2) values for each model. R2, which ranges between 0 and 1, reflects the explanatory power of the model in capturing the variability of the dependent variable.

R2 evaluation.
Y; values closer to 1 indicate a stronger model fit. In this study, the R2 scores were 99.6% for the ANN, 98.6% for MLR, and 72.9% for DT. These findings suggest an excellent model fit for both ANN and MLR, while the performance of the DT model is considered acceptable. Overall, the results demonstrate that the independent variables in the models account for a substantial proportion of the variation in the dependent variable.
Figure 5 displays the Mean Absolute Error (MAE) results for the evaluated models. MAE is a commonly used metric that measures the average magnitude of errors between predicted and actual values. Lower MAE values signify higher prediction accuracy, indicating that the model’s outputs are closely aligned with the true observations. When the MAE approaches zero, it reflects near-perfect predictive performance, suggesting minimal deviation between the model’s estimates and actual outcomes. MAE is calculated as ANN 0.007, MLR 0.011, and DT 0.059. This indicates that ANN and MLR models perform close to the true values, while DT is acceptable.

MAE evaluation.
Figure 6 illustrates the Root Mean Squared Error (RMSE) values for each model. RMSE measures the average magnitude of the difference between predicted and actual values, placing greater emphasis on larger errors due to the squaring operation. A lower RMSE value indicates superior model performance, reflecting more accurate and reliable predictions. The RMSE metric was calculated as 0.011 for ANN, 0.021 for MLR, and 0.102 for DT. According to these results, ANN and MLR models show close to ideal results. DT shows an acceptable result.

RMSE evaluation.
Based on the evaluation of error metrics and predictive accuracy, the models are ranked in performance as follows: logistic regression, artificial neural networks, and support vector regression. Figure 7 presents the scatter plots illustrating the relationship between the predicted and actual values for each model.
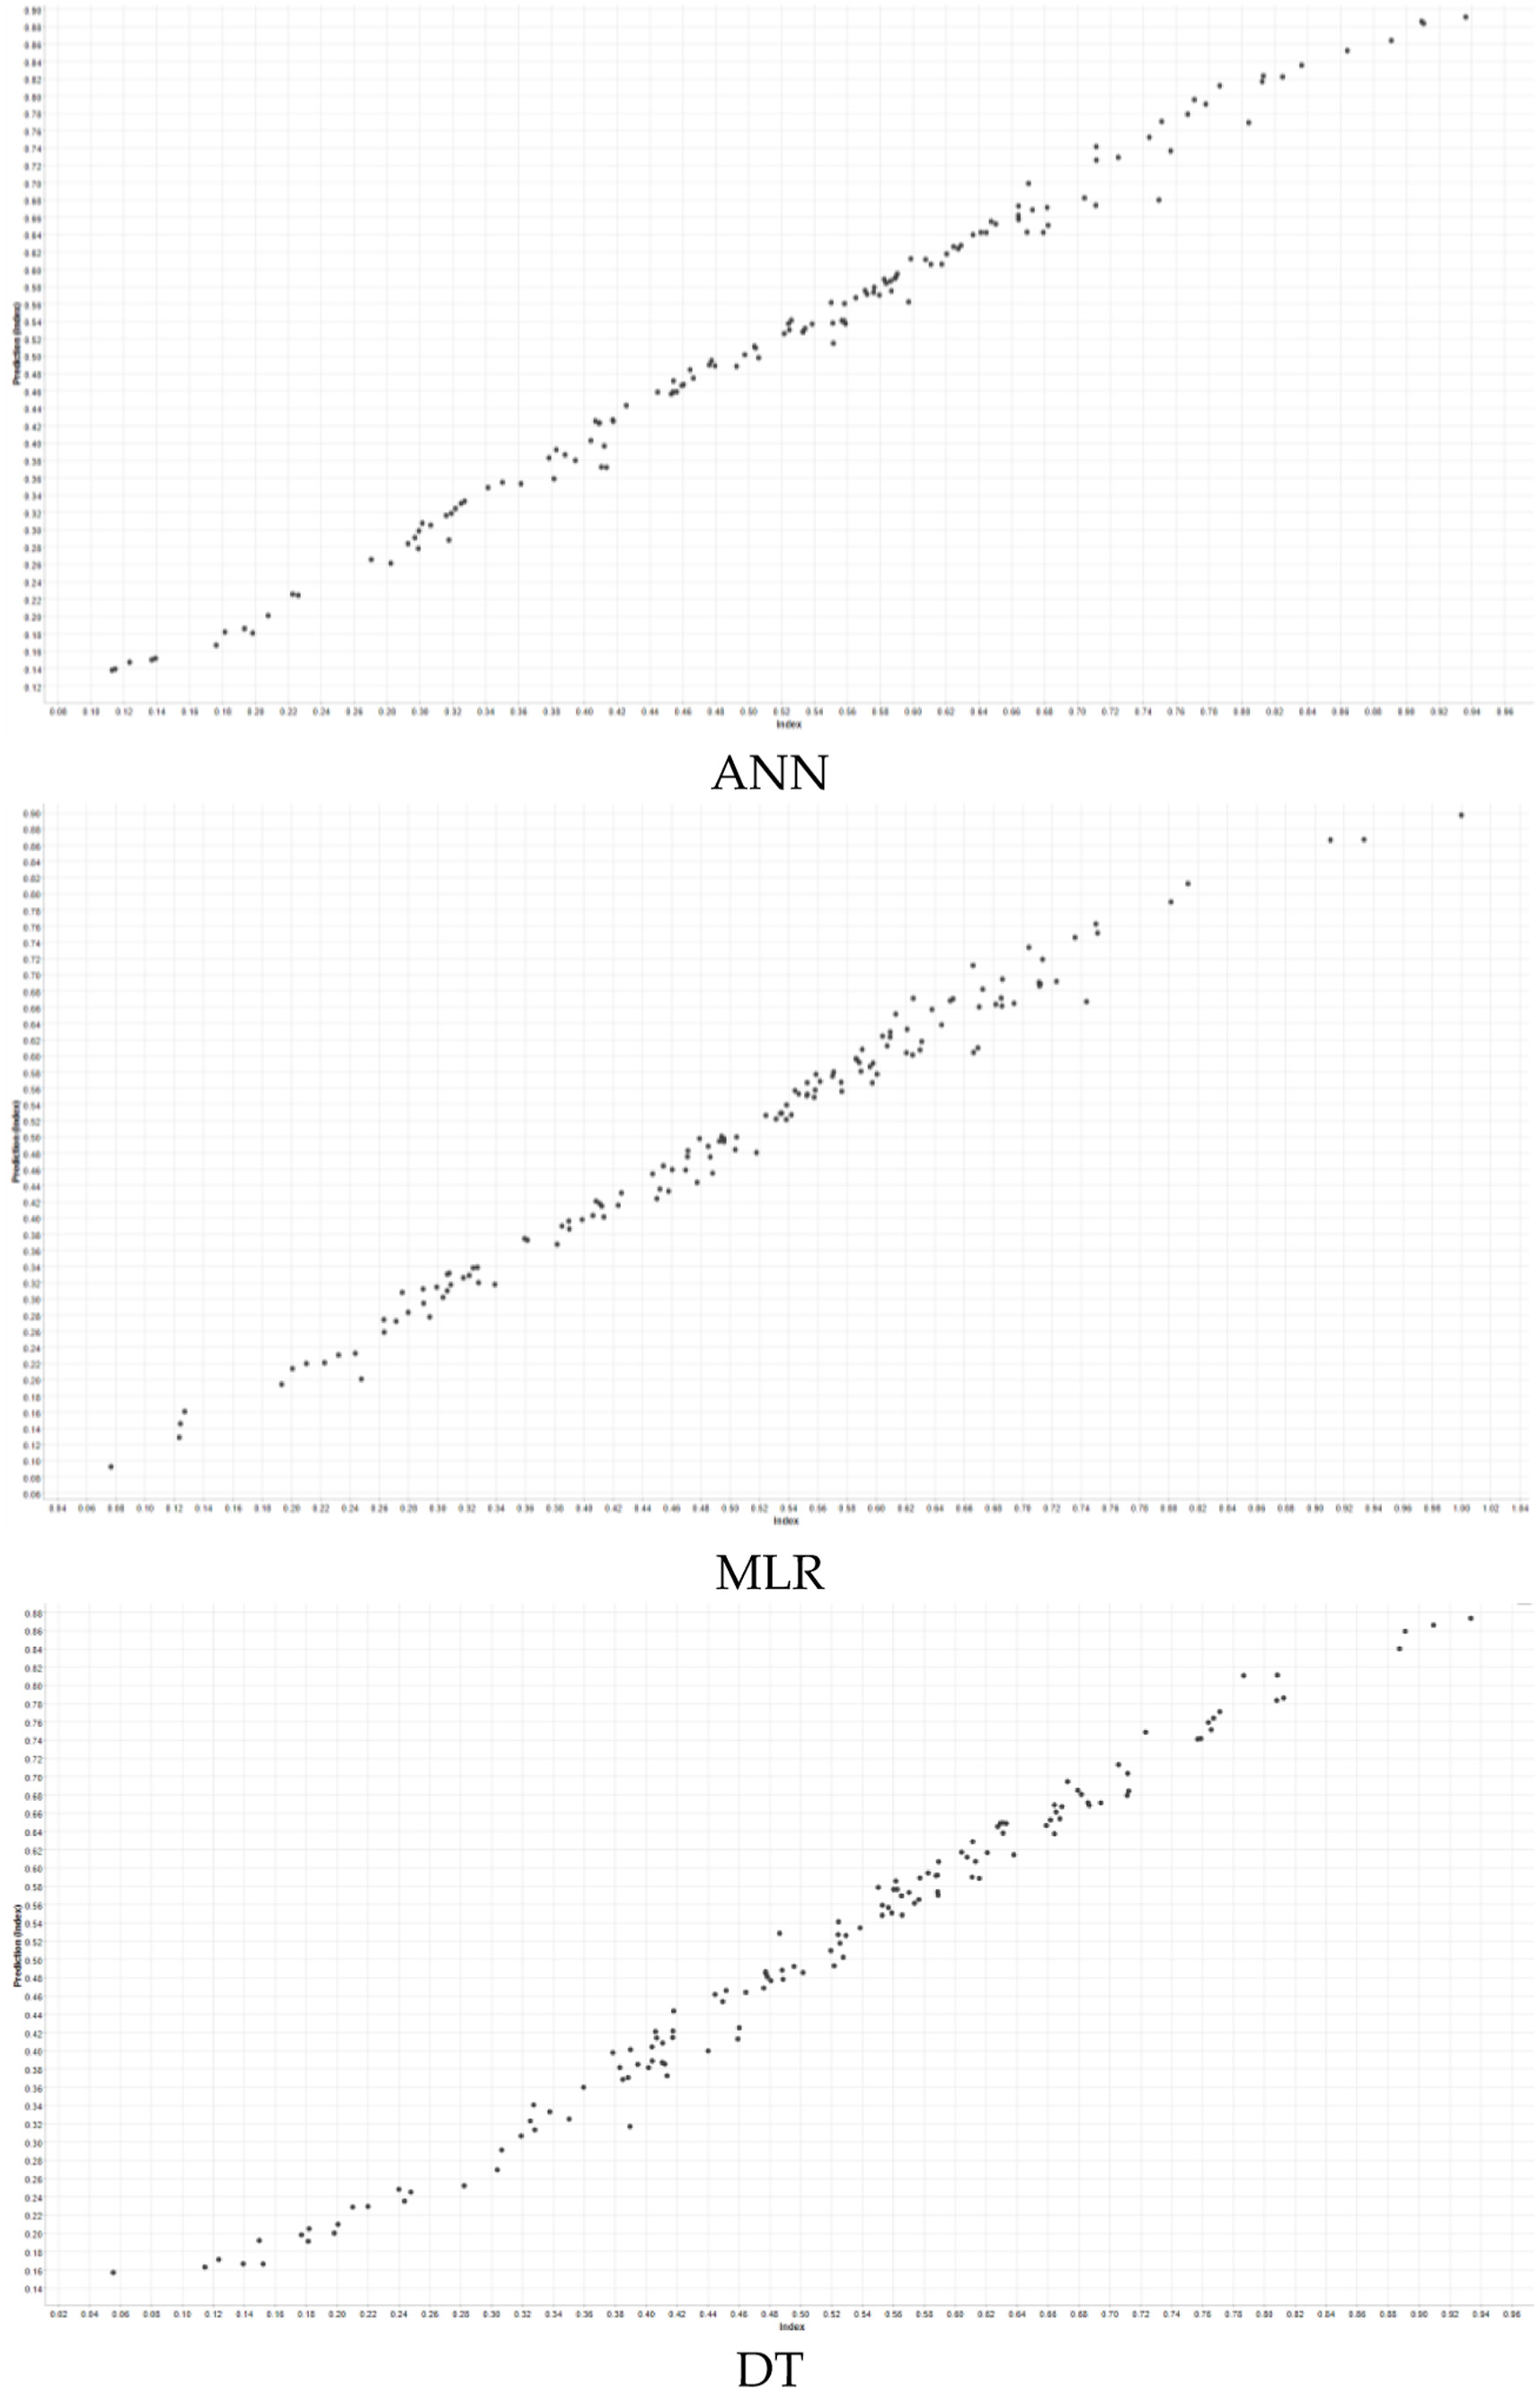
Scatter plot of methods.
Figure 7 presents scatter plots illustrating the relationship between predicted and actual values for the ANN, MLR, and DT models. These visualizations serve to compare the predictive accuracy of each model. In the case of ANN and MLR, the data points are closely aligned along a diagonal line, indicating a strong correlation between predicted and true values, and thus reflecting high predictive accuracy. In contrast, greater dispersion in the DT model suggests lower performance in approximating actual outcomes. Although there are a few deviations in the ANN model, the overall fit is quite good. The MLR model is similarly well fitted to the data but shows a slightly more limited accuracy compared to ANN. In the DT model, the distribution of points is much more irregular and widespread, indicating that this model has a poor fit to the data set and poor prediction performance. This clearly shows that the decision tree model gives less accurate results compared to the other two models.
Figure 8 displays line graphs comparing the predicted and actual values for the Artificial Neural Network (ANN), Multiple Linear Regression (MLR), and Decision Tree Regression (DT) models. These graphs provide a visual representation of each model’s predictive performance. In the plots, the blue line denotes the actual index values, while the green line represents the corresponding predictions generated by the models. A closer alignment between the two lines indicates higher predictive accuracy. In ANN and MLR models, the agreement between predicted and actual values is quite high; the green and blue lines mostly overlap, indicating that these models predict with high accuracy. Although there are small deviations in the ANN model from time to time, its overall performance is favorable. The MLR model shows similar performance, but with small deviations. In the Decision Tree (DT) model, the discrepancy between predicted and actual values is more evident, as reflected by the noticeable divergence between the green and blue lines. This greater variability in predictions indicates a weaker model fit and highlights the relatively lower accuracy of the DT model compared to the ANN and MLR models.

Line plot of machine learning models.
To evaluate the influence of extreme events on model performance, the ANN model was re-estimated after excluding observations corresponding to the 2008–2009 Global Financial Crisis and the 2020–2021 COVID-19 pandemic period. The results remained stable (R2 = .991; MAE = 0.009), suggesting that the model’s predictive performance is robust even when these extreme years are removed from the dataset.
To assess the reliability and generalizability of the machine learning models employed in this study, a 10-fold cross-validation technique was applied to all three models: Artificial Neural Networks (ANN), Multiple Linear Regression (MLR), and Decision Tree Regression (DTR). This approach partitions the dataset into 10 equal subsets, sequentially training the model on nine subsets while validating its performance on the remaining subset in a rotating manner.
The average results of cross-validation are summarized below:
Artificial Neural Network (ANN): R2 = .994, MAE = 0.008, RMSE = 0.012
Multiple Linear Regression (MLR): R2 = .986, MAE = 0.013, RMSE = 0.024
Decision Tree Regression (DTR): R2 = .705, MAE = 0.062, RMSE = 0.109
These values closely align with the original model evaluation results, indicating that the models—especially ANN and MLR—maintain high prediction accuracy across different subsets of the data. This confirms the robustness and reliability of the models in estimating the financial soundness index.
Discussion
In this research, machine learning techniques and traditional methods for predicting the financial soundness of banks are compared and evaluated in terms of their effectiveness. Traditional methods are typically based on static models that assess financial soundness indicators under fixed assumptions. These models are designed to identify patterns by analyzing predefined financial ratios and variables. However, in today’s fast-evolving economic environment, the effectiveness of static models is limited. Traditional econometric approaches can be restrictive when dealing with complex, multidimensional data sets, as they often rely on linear assumptions and may fail to fully capture the intricate relationship within the data set.
Machine learning models, on the other hand, offer the ability to overcome the limitations of traditional methods, enabling more dynamic analyses. ANN stand out due to their capacity to learn complex relationships and handle multidimensional data sets. Unlike static models, ANN can identify patterns in the data without relying on predetermined assumptions and offer a structure that can be continuously updated. This adaptability allows ANN to dynamically adjust to changes in the data set, providing a more accurate prediction of financial soundness than traditional methods. The findings of this study demonstrate that ANN delivers the highest performance (R2 = .9), underscoring its effectiveness in predicting financial stability.
Although MLR model offers more flexibility compared to traditional methods, it may struggle with more complex data due to its reliance on linear relationships. Nevertheless, the MLR model still produced successful results (R2 = .989) in this study, indicating that is an effective tool for simple to moderately complex datasets. However, for more intricate datasets, models like ANN that go beyond linear assumptions provide superior results. Therefore, machine learning methods which extend beyond the limitations of traditional linear models, are particularly well suited for handling large and multidimensional data sets and offering more precise predictions.
DTR showed comparatively lower performance (R2 = .729, MAE = 0.059, RMSE = 0.102) than ANN and MLR. While decision trees offer a simple and intuitive approach to partitioning data sets and making decisions, they can be prone to overfitting, especially with larger data sets. This drawback resulted in lower accuracy compared to ANN and MLR, highlighting the challenges of using decision trees for complex data analysis.
This study considers artificial neural networks (ANNs) as FinTech-based tools that can be used to monitor cross-border financial risks, particularly in European banking systems operating under diverse regulatory frameworks. The model’s strong predictive performance indicates its potential for application in real-time supervisory systems and regulatory sandboxes, offering a more effective monitoring mechanism for supervisory authorities. In this context, ANNs also hold promises for supporting RegTech applications, especially by enhancing early warning systems. Furthermore, the study establishes a conceptual link between financial soundness and long-term institutional viability, where viability is defined in terms of institutional resilience and financial continuity. This approach aims to contribute to the growing literature that explores the relationship between artificial intelligence, financial regulation, and sustainable finance.
Machine learning techniques present several advantages over traditional methods. First, they can process complex and multidimensional data sets and uncover the relationships within the data more flexibly and dynamically than linear models. Additionally, machine learning models can yield effective results even when working with incomplete or imbalanced data, which is a crucial advantage, particularly when dealing with financial data where missing or unbalanced data is common.
The finding of this study aligns with existing literature. For instance, Kisi et al. (2013) found that ANN outperform traditional econometric methods in terms of accuracy rates. Similarly, Abdou et al. (2017) demonstrated that machine learning methods surpass traditional methods in forecasting financial soundness. These studies underscore the growing acceptance of machine learning techniques within the banking sector and in financial soundness assessments and suggest these methods will continue to play a pivotal role in the future of financial market regulations.
In conclusion, this study has shown that machine learning methods offer more accurate and effective prediction of the financial soundness of banks compared to traditional methods. Data-driven models like artificial neural networks hold significant potential for improving financial market forecasts, supporting regulators, and contributing to the development of sustainable financial system in the future.
Future research may consider the use of advanced imputation techniques such as multiple imputation by chained equations (MICE) or leveraging proxy data (e.g., macroeconomic aggregates or market indicators) to broaden country coverage while maintaining data integrity.
The improved accuracy of machine learning models, particularly ANN, offers significant regulatory implications. In the context of the EU’s Sustainable Finance Disclosure Regulation (SFDR), such predictive tools can support banks and regulators in proactively identifying vulnerabilities and allocating capital more efficiently. These models could be incorporated into supervisory stress testing and early warning frameworks.
In summary, this study is novel in constructing a multi-country financial soundness index using IMF indicators and applying comparative machine learning methods. It is among the first to combine PCA-based index estimation with ANN-based prediction in a European banking context, offering a scalable and accurate early warning tool.
Conclusion and Policy Implications
Efficiently functioning financial systems play a crucial role in supporting economic development by ensuring that funds are directed toward productive investment projects. The financial soundness of banks, as essential elements of the financial system, is vital for the effective transfer of capital, and promoting economic growth (Karadağ, 2021). Estimating the financial soundness of banks is not only important for identifying the financial soundness of these institutions but also plays a key role in preventing bank failures and mitigating the risk of banking crises. Financial soundness indicators are of critical importance in minimizing crises, maintaining economic stability, and enabling financial institutions to develop more effective strategies. Therefore, for a sustainable financial system, it is necessary to monitor and evaluate financial soundness indicators.
The financial soundness variables of banks, such as liquidity, capital adequacy, asset quality, profitability, and efficiency, provide valuable insights into the broader socioeconomic conditions of a country. These indicators not only reflect the financial health of individual banks but also offer information crucial for assessing the stability of the financial system. The ability to assess financial soundness across various countries and institutions supports a more integrated and sustainable approach to financial market regulation.
It is important to clarify that the model’s consistent performance during crisis periods does not imply that financial crises had no impact on banking soundness. Rather, the ANN model was able to capture stability in the structural patterns of the indicators. To avoid overgeneralization, we supplemented the results with a case analysis of Greece and Italy, where actual economic disruptions correlated with financial soundness trends.
This study offers an original contribution to the literature by comparing the performance of three different prediction models-ANN, MLR, and DTR for forecasting the financial soundness of banks. The use of performance metrics such as R2, mean absolute error (MAE), and root mean square error (RMSE) shows that the neural network model provides the best fit to the data set with a high R2 value of .996, as well as low MAE (0.007) and RMSE (0.011), indicating its high predictive accuracy. Although the MLR model also yielded strong results (R2 = .989), it is accuracy was slightly lower compared to ANN. The DTR model, with its R2 value of .729 and higher error rates (MAE = 0.059, RMSE = 0.102), was less effective in capturing the complexities of the data.
In the calculation of these indices, it was observed that the GFC2008, covid-19, and Ukraine-Russia war periods, which had effects on the world economy and the banking sector, did not have a significant impact (Table 3).
What sets this study apart from others is its multi-country approach, analyzing 28 European countries from 2008 to 2023 using 12 IMF financial soundness indicators. This enables the assessment of financial soundness not just on a national level, but also at a regional and global scale, offering insights into international financial stability. Furthermore, the study incorporates advanced machine learning techniques, including ANN, MLR, and DTR, providing a more dynamic and comprehensive analysis of banking sector soundness compared to traditional methods.
The findings from this study contribute to the broader field of financial market regulation and sustainable development by highlighting the advantages of machine learning techniques in improving the accuracy and efficiency of financial soundness forecasts. The unified index estimated in the study includes information that can contribute to the estimation of financial soundness in the European banking system and to the development of policies for banks in both short-term and long-term crisis planning and risk management. Thus, it can ensure the adoption of a harmonious approach to banking supervision and regulation that will ensure the viability of the banking system. In addition, the unified (standard) index will provide a comparable measure across different countries and institutions, enabling easy analysis and risk assessment. By assessing the financial stability of banks, this research helps policymakers and regulators identify at-risk banks and take proactive measures to mitigate financial risks. The results emphasize the need for a more integrated approach to financial regulation, particularly as financial markets continue to evolve in the face of global economic challenges.
The main contributions of this study bring an important innovation to the existing literature in the field of financial soundness analysis. The study shows that machine learning techniques (artificial neural networks, multiple linear regression, and decision tree regression) provide higher accuracy and efficiency compared to traditional methods. In particular, the capacity of these techniques to handle data complexity and their ability to produce more accurate results in financial soundness forecasts provide a significant advantage over traditional models. Moreover, the analysis of financial soundness indicators of 28 European countries fills a gap in the literature by providing a regional and global financial soundness perspective as well as a national one. While the integration of the IMF’s broad financial soundness indicators enables a more comprehensive assessment of financial systems, this study contributes to the development of a more integrated and sustainable approach to financial market regulation.
In terms of future research, this study paves the way for incorporating non-financial indicators into the analysis of financial soundness. In addition to the traditional financial ratios, factors such as governance quality, environmental sustainability, and social performance can further enhance the predictive power of financial soundness models. Moreover, the integration of other advanced machine learning techniques, such as deep learning and reinforcement learning, could further improve forecasting accuracy and offer more robust solutions for financial market regulation. For future research, studies that include different methods and variables on the financial soundness indices of the banking system in developed European countries and developing countries can be recommended.
Additionally, it is important to note that a unified index may not capture the nuances of individual countries’ banking systems and economic contexts. Therefore, it will be crucial to complement the single index with country-specific analysis and risk assessments. It will also be important to conduct studies that consider both soundness and profitability indicators for a comprehensive analysis of a bank’s financial soundness.
Although the present study focused on three widely adopted techniques—ANN, MLR, and DTR—future research may benefit from incorporating additional machine learning methods such as Random Forests, Support Vector Machines (SVM), and gradient boosting algorithms (e.g., XGBoost). These alternative models offer specific advantages in areas such as interpretability, the management of unstructured data, and the mitigation of overfitting risks. The selection of ANN, MLR, and DTR in this study was guided by considerations of methodological clarity and computational feasibility. Nonetheless, the inclusion of a broader range of algorithms in subsequent studies could provide a more comprehensive evaluation of predictive performance in financial soundness modeling.
The study’s findings have several practical implications for regulators, bank managers, and policymakers. The high predictive power of ANN models suggests that financial institutions can adopt machine learning-based early warning systems to monitor financial soundness indicators proactively. Regulatory authorities can leverage the unified index developed in this research to assess systemic risks more effectively across multiple jurisdictions. Moreover, banks can integrate such models into their internal risk assessment protocols to enhance capital allocation, liquidity management, and stress-testing procedures. These implications align with global calls for more robust and forward-looking regulatory frameworks in the post-crisis era.
Future research could expand on this framework by incorporating non-financial indicators such as governance quality, ESG scores, or institutional transparency. Additionally, comparative analyses between developed and developing countries may offer new insights into the structural determinants of banking soundness. Another promising direction includes the integration of advanced deep learning techniques or ensemble learning methods to enhance predictive performance. These avenues would contribute to the growing body of research on sustainable finance and financial system resilience.
Footnotes
Ethical Considerations
No ethical approval was required for this study, as it did not involve human participants, animals, or sensitive data.
Author Contributions
Conceptualization, Ayşegül Ciğer and Filiz Yetiz; Data curation, Mehmet Kayakuş, and Aram Shaban Fattah; Investigation, Filiz Yetiz, Ayşegül Ciğer; Methodology, Mehmet Kayakuş and Aram Shaban Fattah; Project administration, Ayşegül Ciğer, Filiz Yetiz and Mehmet Kayakuş; Resources, Aram Shaban Fattah; Software, Filiz Yetiz, Ayşegül Ciğer and Mehmet Kayakuş; Validation, Aram Shaban Fattah; Writing—original draft, Filiz Yetiz, Ayşegül Ciğer and Mehmet Kayakuş; Writing—review & editing, Ayşegül Ciğer and Filiz Yetiz.
Funding
The authors received no financial support for the research, authorship, and/or publication of this article.
Declaration of Conflicting Interests
The authors declared no potential conflicts of interest with respect to the research, authorship, and/or publication of this article.
Data Availability Statement
Data sharing not applicable to this article as no datasets were generated or analyzed during the current study.