
Abstract
The main purpose of this study was to explore major factors at student and teacher/school levels affecting middle-school students’ science self-efficacy among countries with high science academic performance levels in PISA 2015 data by using various regression algorithms of machine learning and multilevel latent profile analysis (MLPA). Out of total of 195 (110 at the student-level and 75 at the teacher/school-level), 88 at the student-level and 38 at the teacher/school-level explanatory variables were finally selected after data pre-processing. Through over 20 regression analysis algorithms of machine learning, 10 variables at the student-level and five variables at the teacher/school-level were found to be significant predictors, consistent with previous studies. Next, MLPA was applied to classify underlying science self-efficacy sub-groups at each level and verify the statistical significance of variables affecting science self-efficacy, chosen from the machine learning. Three classes at the student-level (low, moderate, high) and two at the teacher/school-level (mid-low, mid-high) were selected as the optimal number of latent profiles. At the student-level, students with higher environmental awareness, science activities, interest in broad science topics, instrumental motivation, test anxiety, and achieving motivation were more likely to belong to the moderate or high groups than the low group. At the teacher/school-level, the mid-high group had more considerable science-specific resources, higher instructional leadership, a larger student-teacher ratio, and more science teachers than mid-low group. Finally, the significance of the study was presented, and implications for increasing science self-efficacy in middle school students were suggested.
Introduction
With the development of science and technology in the wake of the Fourth Industrial Revolution, the importance of scientific inquiry and creative problem-solving skills, which are treated as essential competencies, have been particularly emphasized in the 2015 revised curriculum (Cho & Kim, 2018; Ministry of Education, 2015). Students’ improvement in these key competencies depends not only on cognitive factors but also on affective aspects (Park et al., 2018; Tark, 2011). However, according to PISA 2015 results, about 45% of the top 20 countries with high levels of achievement in the scientific field perform below the international average on indicators of affective aspects, such as motivation and interest in science learning (OECD, 2018). As such, many students show high achievement in science, but few have a positive attitude and high interest in the subject. Thus, based on previous research that reported that students who enjoyed science had a high level of scientific achievement (Lee & Jung, 2004), there has been an increasing need to explore the effects of the affective domain in scientific achievement improvement.
Among the diverse variables related to students’ affective factors, self-efficacy has garnered much attention. Especially, science self-efficacy is a kind of subject-specific academic self-efficacy that refers to the perception of the ability to challenge scientific tasks (Britner & Pajares, 2006). It can be defined as a belief in one’s ability to successfully perform the actions necessary to achieve specific results in the learning or exploring process for science-related content (Dalgety & Coll, 2006; Dawes et al., 2000). Several studies have shown that high self-efficacy in complex and challenging subjects like science is essential to overcome a fear of learning (McMillan & Forsyth, 1991) and affects students’ degree of effort and continuity in science learning (Betz & Hackett, 1981; DeBacker & Nelson, 2000; Gwilliam & Betz, 2001). Scientific self-efficacy is also related to learners’ expertise and prior experience in the science field (Bodner et al., 2001; Schunk, 1983). Learners with high scientific self-efficacy gain confidence in science through a variety of knowledge and experiences related to science, and high confidence leads to active participation in science-related learning activities, increasing academic achievement in science. In this way, scientific self-efficacy can be formed by the interaction of various behavioral and psychological factors with previous knowledge and experience and is related to learning attitude, performance, and achievement level in science (Williams, 1994).
Prior research has explored the relationship between science self-efficacy and a variety of influential variables, ranging from gender (Aurah, 2017; Sezgintürk & Sungur, 2020) and internal factors such as intrinsic motivation (Rittmayer & Beier, 2008; Schunk & DiBenedetto, 2021; Ste-Marie et al., 2016), mastery experience (Britner & Pajares, 2006; Dorfman & Fortus, 2019; Rittmayer & Beier, 2008), attitude toward science (Jones & Young, 1995), and interest (Rittmayer & Beier, 2008), to external factors such as parental support (Karaarslan & Sungur, 2011; Scott & Mallinckrodt, 2005) and social comparison with peers (Dorfman & Fortus, 2019; Jansen et al., 2015; Schunk & Meece, 2006). As a demographic variable, gender has been actively discussed. Some studies reported significant gender differences in science self-efficacy (Aurah, 2017; Britner & Pajares, 2001; Huang, 2013), whereas others did not (Britner & Pajares, 2006; Kıran & Sungur, 2012; Sezgintürk & Sungur, 2020). Among the internal factors of students’ science self-efficacy, the mastery experience is the most emphasized element of Bandura’s theory (1997). The mastery experience, in which students gain confidence through achievement, leads to increased motivation and interest in science, which drives them to try harder, increasing the likelihood of high achievement in science subjects. This positive feedback loop can be important in increasing students’ science self-efficacy.
The influence of external factors can be crucial to science self-efficacy. For instance, appropriate praise and support from parents can increase students’ motivation and help them develop positive beliefs about their abilities, leading to increased self-efficacy in science (Senler & Sungur, 2009). However, too much parental control or focus on extrinsic rewards can negatively impact self-efficacy by reducing the internal motivation and experience of mastery that comes from studying. Moreover, previous studies have reported that students compare their abilities to the perceived abilities of their average classmates. This social comparison highlights the negative contextual impact on students’ self-efficacy, even after accounting for individual ability (Jansen et al., 2015). The effect of peers has also been identified as a source of self-efficacy, referred to as “vicarious experience” by Bandura (1997, p. 79).
In addition, teacher- and school-level factors can affect students’ science self-efficacy directly or through interactions with other source of self-efficacy (Srisupawong et al, 2018). According to previous studies, teachers providing students with tasks that are challenging but open to mastery, setting specific learning goals, making a supportive climate, and giving accurate feedback can develop students’ science self-efficacy in learning (Dorfman & Fortus, 2019; Jansen et al., 2015). It is known that science educators can support students in developing self-efficacy beliefs by recognizing the significant impact of mastery experiences and fostering a positive classroom environment with specific teaching methods. By providing an appropriate level of challenge, teachers can facilitate successful experiences that build confidence in new abilities while minimizing failures that may undermine students’ confidence (Bandura, 1997; Britner & Pajares, 2006). Inquiry-based learning, which includes problem-based, design-based, and project-based learning, can empower science learners through collaborative learning and practical experiments (Jansen et al., 2015), compared to less interactive and teacher-centered environments (Darling-Hammond et al., 2020). What is more, it is not only aspects such as teaching methods or classroom climate, but also physical aspects of the school itself that may connect to students’ self-efficacy. Small classes or schools can strengthen the bond between students, and teachers can give students more detailed attention and feedback (Schunk & DiBenedetto, 2021). These strengths of small learning communities can improve students’ motivation, engagement, and self-efficacy (Darling-Hammond et al., 2020; Schunk & DiBenedetto, 2021).
Research Purpose
As mentioned, there is a significant relationship between science self-efficacy and factors related to science learning; therefore, students with high science self-efficacy tend to have higher academic achievement levels (Williams, 1994; Jo, 2011; Joo et al., 2011). However, in previous studies, the relationship between a few influencing factors related to student characteristics and science self-efficacy was discussed sporadically. Little research has verified these factors integrally. Also, most studies have focused on individual characteristics or experiences as factors influencing self-efficacy, and few studies have included school-level variables (Alt, 2015; Jansen et al., 2015). Given that self-efficacy is a crucial variable that significantly affects academic achievement and interest, developing a deep understanding and practical implications to increase students’ science self-efficacy requires a focus on personal and environmental resources (Beghetto, 2007).
From this point of view, this study aims to comprehensively explore the major factors influencing science self-efficacy using machine learning techniques and multilevel latent profile analysis (MLPA) in countries with high national science academic performance levels. To improve science self-efficacy, it’s crucial to first identify the main variables influencing it; and then closely examine their relationships with science self-efficacy. However, previous studies have been limited by their focus on only a few influencing factors, select using conventional statistical techniques. When dealing with hundreds of variables in a single model using conventional statistical methods, issues such as non-convergence and overfitting can arise (Yoo, 2018). Therefore, the first part of this study involved exploring the main predictors of science self-efficacy using machine learning. Machine learning techniques refer to a series of algorithms or processes that learn specific rules and patterns from large datasets, and perform appropriate tasks on new data sets (Dangeti, 2017). By applying machine learning techniques, problems from the conventional statistical methods could minimize by allowing for the simultaneous consideration of numerous explanatory variables (Yoo et al., 2020).
After identifying the major influencing factors on science self-efficacy by levels through machine learning, the MLPA was applied to classify underlying sub-groups at both the student and teacher/school levels. This approach enabled to verify the factors affecting science self-efficacy, using variables selected from machine learning. Latent profile analysis (LPA) is an analysis method that identifies classes- subgroups estimated based on respondents’ response patterns to multiple indicators. It is meaningful to use LPA to examine the characteristics of subgroups consisting of students with similar characteristics and to examine the factors that determine the classification of subgroups (Wang & Wang, 2020). One underlying assumption in LPA is local independence, which refers to the independency of an individual’s responses given the latent class. However, since the data used in this study are multilevel, hierarchical data, this assumption is violated (Vermunt, 2003). The multilevel data structure causes the dependency between the responses of individuals because they belong to the same higher-level unit. To reflect these characteristics and to modify the assumption, MLPA considered both the student and teacher/school levels (Henry & Muthén, 2010; Vermunt, 2003).
Thus, the research objectives of this study were twofold. Firstly, this study aimed to identify optimal algorithms showing excellent performance in predicting science self-efficacy among various machine learning regression models. Subsequently, major variables affecting science self-efficacy at both student and school levels through the feature importance values on variables of each high performing algorithm were pinpointed. Secondly, MLPA was performed in order to examine the effect of selected variables from machine learning techniques at each level. Despite potential differences in variable performance between machine learning regression model and latent profile classification, variables showing a strong relationship with science self-efficacy in the regression models were generally presumed to have a significant impact on the classification analysis. Therefore, the statistical significance of the variables in the latent profile classification was assessed in this study.
The choice of quantitative analysis methods in this study was based on careful consideration of the research objectives and the nature of the data. Machine learning techniques were selected for their capability to handle large datasets and to identify complex patterns within the data. This technique was particularly well-suited for exploring the numerous variables that may influence science self-efficacy. On the other hand, MLPA was employed to explore hierarchical relationships and subgroup differences in science self-efficacy across different levels. By utilizing these complementary methods, this study aimed to comprehensively examine the factors influencing science self-efficacy and gain a deeper understanding of its determinants. Therefore, it was anticipated that the results of this study would provide valuable insights to guide future research on predicting science self-efficacy.
Method
Data
PISA 2015 datasets, with a focus on science as the major domain, were used for this study. The PISA is a cross-national, large-scale study that assesses 15-year-old students’ mathematics, reading, and science performance across OECD countries and partner countries. It has been carried out every 3 years since 2000 (OECD, 2017). It also collects student and school contextual information through student background questionnaires responded to by students and school questionnaires responded to by principals. In this study, among PISA 2015’s 72 participating countries, the five countries, Singapore, Japan, Estonia, Finland, and South Korea, were chosen based on their top performance in science area This selection aimed to improve the clarity of understanding regarding the factors influencing science self-efficacy within exemplary science education settings. Therefore, datasets from these high-performing countries were utilized to analyze the influence of backgrounds and educational context variables in the student- and teacher/school level on students’ science self-efficacy. After excluding 926 students who did not respond to items on science self-efficacy, a total of 28,886 students from 971 schools (51.0% male students, 49.0% female students), including data of 5,999 Singaporeans from 177 schools (51.4% male students, 48.6% female students), 6,489 Japanese from 198 schools (50.2% male students, 49.8% female students), 5,405 Estonians from 206 schools (50.1% male students, 49.9% female students), 5,470 Finns from 168 schools (51.3% male students, 48.7% female students), and 5,523 Koreans from 168 schools (52.2% male students, 47.8% female students), were retained and analyzed.
Measures
Response Variable
Science self-efficacy, the response variable in this study, was measured by asking students’ belief in how easily they are able to accomplish science-related tasks related to scientific literacy, as conceptualized in the PISA science framework (Jansen et al., 2015; OECD, 2017). Eight items were rated about students’ mastery level with a 4-point Likert-type subscale (from 1 = I could not do it to 4 = I could do this easily). The responses were used to create the index of science self-efficacy, which was calculated based on the weighted likelihood estimates (WLE) from item response theory (IRT) modeling (Liu & Wang, 2022). Those WLE scores were transformed into an international metric with a mean of 0 and a standard deviation of 1 across OECD countries, and higher WLE scores corresponded to higher levels of science self-efficacy. The reliability of the science self-efficacy was excellent (Cronbach’s alpha = .899), and those across five countries were a range of .886 and .933. The details of items in science self-efficacy are shown in Table 1.
Details of Items in Science Self-efficacy.

Note. SGP = Singapore; JPN = Japan; EST = Estonia; FIN = Finland; KOR = South Korea.
Predictors
To start, a total of 195 (student level: 110, teacher/school level: 75) variables related to students, teachers, and school characteristics in PISA 2015 were analyzed after excluding variables irrelevant for analysis, such as personal identification, weights, or ones difficult to include in analysis (e.g., code-type and subjective response variables). Among the variables included in the analysis, 22 variables at the student level and 37 at the teacher/school level, including 50% or more missing values were also deleted from the variable pool, due to the challenges of applying the multiple imputation method for those missing values. For the other variables to be included in the analysis, the multiple imputation chained equation (MICE) method of the Light Gradient Boosting Machine model was repeated 10 times to replace the missing value. For all variables except for the binary variable, the WLE scores provided by PISA 2015 were used for analysis. Also, when the correlation between variables was .900 or more, one variable was removed to prevent multicollinearity. All variables were normalized so that they were on the same scale line. Through this data preprocessing process, a total of 88 at the student level and 38 at the teacher/school level from PISA 2015 dataset were finally used as predictors for science self-efficacy. The details of explanatory variables used in this study are given in Appendix.
Analysis
Machine Learning
A machine learning analysis was conducted to derive major variables that affect science self-efficacy at each of the student and teacher/school level. PyCaret was used for this process. PyCaret is a Python library that can perform a process that increases productivity and efficiency by automating machine learning model building, or automated machine learning (AutoML) (Gain & Hotti, 2021). PyCaret is an open-source and low-code library that automates data preprocessing, model selection, and hyperparameter optimization (Ali, 2020; Gain & Hotti, 2021). It also supports algorithms of various machine learning models, such as classification, regression, clustering, and abnormal detection for given learning data. This study compared the performance of more than 20 regression analysis models provided by PyCaret.
The analysis process for the machine learning was as follows. First, prior to the application of regression models, the data were randomly divided into training and test data sets with 8:2 ratio (training data: 17,562 for student level and 17,521 for teacher/school level, test data: 4,622 for student and teacher/school levels). Thus, training and test data were independent but simultaneously followed the same probability distribution (Dangeti, 2017). Second, grid search was applied to search for optimal hyperparameters based on 10 layers of cross-validation, and was repeated 10 times (10-fold CV). Grid search is a method to find the most optimized hyperparameter combination among the values set by the researcher. The model’s performance can be improved based on more accurate learning by deriving the optimal hyperparameter value from the grid search (Bergstra & Bengio, 2012). Third, the top three algorithms showing excellent performance were selected based on various evaluation indexes with the optimal hyperparameter combination derived through the previous process. Lastly, based on the regression coefficient/importance index of the selected top three algorithms, major explanatory variables that affect the prediction of science self-efficacy were explored. Since these values may vary in terms of methods, units, and interpretations across models, raw importance index or regression coefficient values were not presented. Instead, rank values were employed to facilitate a comparative analysis of the relative importance of major variables derived from each algorithm. This process involved assigning ranks to variables in each model based on the regression coefficient or importance index and computing the average rank values to determine the final importance of explanatory variables. Consequently, by using the rank values assigned based on the regression coefficient or importance index obtained for each algorithm, the relative contribution of variables can be effectively gauged, providing valuable insights into their impact on science self-efficacy (Chandrashekar & Sahin, 2014; Guyon & Elisseeff, 2003). This study used the PyCaret 2.3.10 package in Python 3.10 for data preprocessing and machine learning analysis.
Multilevel latent profile analysis (MLPA)
This study applied a nonparametric approach in MLPA to identify the optimal model with an adequate number of latent profiles of science self-efficacy at the student level (level 1) and teacher/school level (level 2) and verified influencing covariates from both levels. The nonparametric approach in MLPA assumes it to be a discrete variable following a multinomial distribution, which can be represented by a set of latent profiles at the higher level. One advantage of nonparametric MLPA is that the former classifies latent classes and clusters for both higher-level and lower-level units (Henry & Muthén, 2010; Vermunt, 2003). For MLPA, the 3-step approach suggested by Lukočienė et al. (2010) was implemented with Latent Gold 6.0 (Vermunt & Magidson, 2021). Latent Gold is a powerful statistical software program that allows to apply the 3-step approach in a multilevel latent class/profile model. For the first step in the 3-step approach, a series of LPA models was conducted to determine the optimal number of classes at level 1 by ignoring the multilevel structure. Second, after fixing the number of level 1 classes from step 1, a series of MLPA models was conducted to determine the adequate number of level 2 classes. Lastly, the number of level 1 classes was re-determined by fixing the number of classes at level 2. With those three steps, it is possible to evaluate the changes in the number of level 1 classes after considering the dependencies among level 1 units from multilevel datasets and exclude the effect of covariates in determining the number of latent classes at both level 1 and level 2 (Lukočienė, Varriale, & Vermunt, 2010).
Various evaluation criteria were used to determine the optimal numbers of latent classes at both levels: information criterion, the quality of latent class separation, and the separated proportion within each latent class. First, information criteria (IC) include Akaike information criterion ([AIC], Akaike, 1974), Bayesian information criterion ([BIC], Schwarz, 1978), Akaike information criterion 3 ([AIC3], Bozdogan, 1987). A smaller information criterion value indicates a better model. Next, the quality of latent class separation was examined with entropy (Ramaswamy et al., 1993) and the proportion of classification errors. Entropy ranges from 0 to 1, and generally, .8 or higher is a good model (Muthén, 2004). Classification error refers to the probability of assigning a level 1 or level 2 unit to a latent class conditional to the actual class, and the closer value to 0 is better. When the LPA model for each level included a specific profile that accounted for the smallest proportion of less than 1%, this model would not be chosen. This is because too small a proportion may not be meaningful as a group (Jung & Wickrama, 2008). In addition to these statistical criteria, theoretical interpretability for the classified groups was considered. This study used Latent Gold 6.0 (Vermunt & Magidson, 2021) for MLPA analysis. The research model for Study 2 is presented Figure 1 .

The research model for Study 2 associated with a level 2 class (
Results
Evaluation of Performance Among Machine Learning Models
The results of evaluating the performance of the top five out of 20 regression models to predict science self-efficacy, with 88 at the student level and 38 at the teacher/school level explanatory variables, were presented in Table 2. At the student level, among the top five algorithms with appropriate performance using learning data of 17,562 samples, it was confirmed that the prediction error of light gradient boosting was the smallest at .960 based on RMSE. Next in order were the Gradient Boosting regressor (.964), the Extra Trees regressor (.969), the Random Forest regressor (.974), and Bayesian Ridge (.985) showing small prediction errors. Next, in the case of the teacher/school level, the prediction error of the Gradient Boosting regressor was found to be the smallest at 1.172 in RMSE. The prediction error was found to be small, in the order of AdaBoost regressor (1.178), Bayesian Ridge (1.179), Least Angle regression (1.180), and Ridge (1.182). In addition, when examined R2, both the student level and the teacher/school level showed high predictive power in the same order as when examined based on RMSE.
Results of Compare Performance for the Top Five Regression models.

Based on these results, the top three models among 20 regression algorithms predicting scientific self-efficacy were selected at student level and teacher/school level, respectively.
Importance of Predictors
Based on the top three algorithms with excellent performance through the re-optimization process, the importance of explanatory variables was examined among 88 at the student level and 38 at the teacher/school level expansion variables. In other words, the Light Gradient Boosting, Gradient Boosting regressor, Extra Trees regressor algorithm for the student level, and the Gradient Boosting regressor, AdaBoost regressor, and Bayesian Ridge algorithms for the teacher/school level were ranked based on feature importance index. After that, the average of the ranking values assigned by the top three algorithms was calculated to confirm the importance of the explanatory variable. Through this process, the final selected explanatory variables that predict science self-efficacy for each level were derived and presented in Table 3 (student level) and Table 4 (teacher/school level).
Student Level—Average of Importance Rank in the Top Three Models.

Teacher/School Level—Average of Importance Rank in the Top Three Models.

The results of correlation analysis among the selected variables at each level are presented in Table 5. Science self-efficacy, the dependent variable in this study, exhibited a significantly positive relationship (ranging from r = .049 to r = .427) with most of the exploratory variables, except for test anxiety and class size. All exploratory variables showed significant relationships with each other; notably, test anxiety displayed relatively lower correlations with the other variables.
The Results of Correlation Analysis.

Note. All coefficient were significant at the .01 level.
1: Science self-efficacy, 2: Environmental Awareness, 3: Index science activities, 4: Epistemological beliefs, 5: Interest in broad science topics, 6: Enjoyment of science, 7: Instrumental motivation, 8: Test Anxiety, 9: Inquiry-based science teaching and learning practices, 10: Achieving motivation, 11: Students’ Perceived Autonomy related to ICT Use, 12: Index science specific resources, 13: Instructional leadership, 14: Student-Teacher ratio, 15: Class Size, 16: Total number of science teachers at school.
Find optimal MLPA Model for Science Self-efficacy
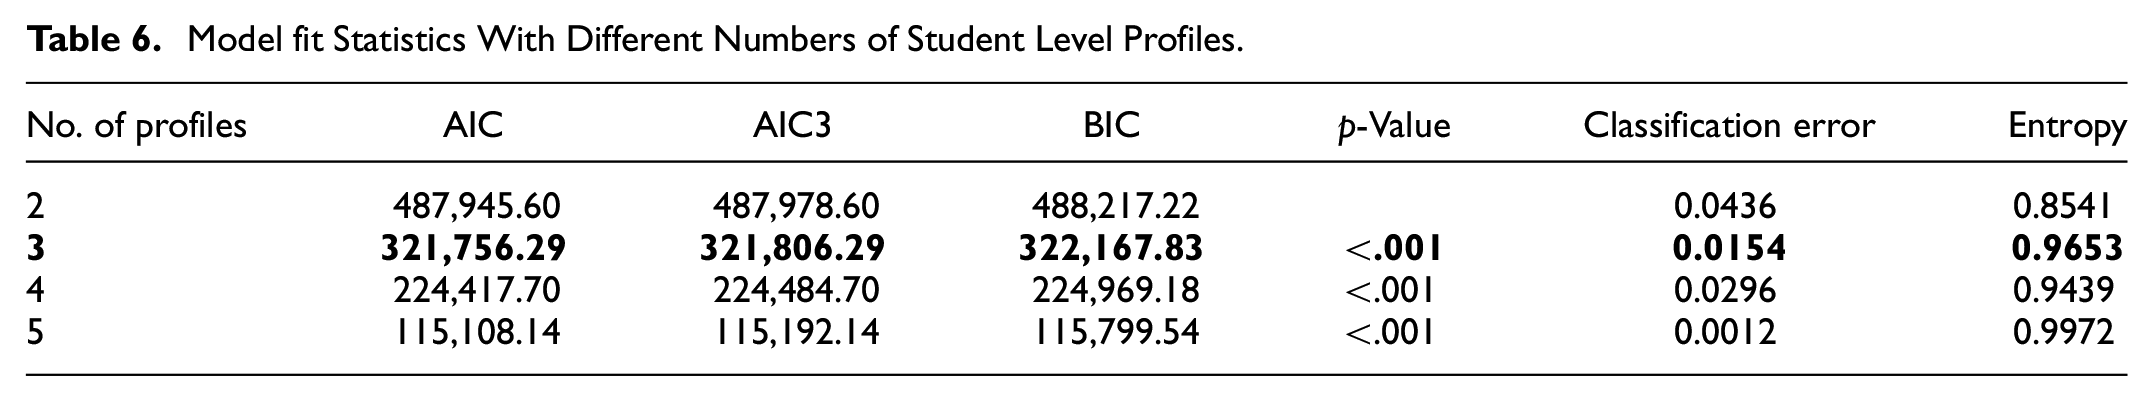
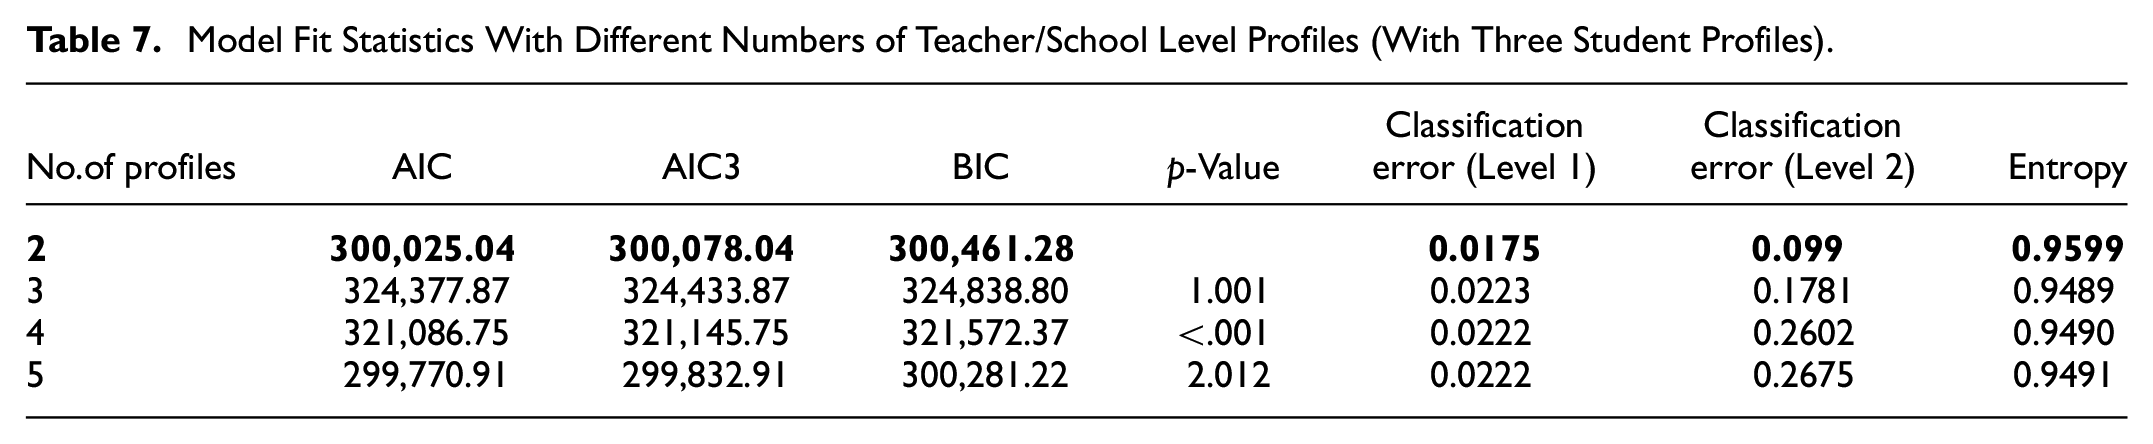
A three-step model-fitting procedure in MLPA suggested by Lukočienė et al. (2010) was implemented to find the optimal number of latent profiles at both the student and teacher/school levels. First, the results of MLPA at the student level represented in Table 6 show that ICs including AIC, AIC3, and BIC become lower as the number of latent profiles increases. According to Nylund-Gibson and Choi (2018), it is common that information criteria decrease as the model becomes more complex, and a sharp drop in information criteria (“elbow point,” p. 9) can be referred to as the decision for the optimal number of latent profiles. Considering the dramatic decrease in all of ICs (AIC, AIC3, BIC), the smallest classification error, model parsimony, and interpretability, three classes were chosen for the student level, as highlighted in bold. Second, the number of teacher/school level profiles was determined, constraining the number of student level profiles decided in the first step. Table 7 shows the result of MLPA models from one to five level-two latent profiles decided in the first step with three student level latent profiles. ICs, AIC, AIC3, and BIC, did not show large differences among models. After excluding the three and five- profile models showing non-significance of the Vuong’s robust likelihood-ratio test p-value, the two-profile model (highlighted in bold), with the lowest classification errors at both levels and the highest entropy, was chosen as the best model. Finally, the number of latent profiles at the student level was re-determined after fixing the number of teacher/school level profiles at two in Table 8. As in the first step, the three-profile model showed the largest drop in information criteria and the lowest classification errors in both levels. Therefore, based on the determination standards and interpretability, three classes at the student level and two at the teacher/school level, as highlighted in bold, were selected as the optimal number of latent profiles.
Model fit Statistics With Different Numbers of Student Level Profiles.
Model Fit Statistics With Different Numbers of Teacher/School Level Profiles (With Three Student Profiles).
Final Model Fit Statistics With Different Numbers of Student Level Profiles (With Two Teacher/School Profiles).

The final MLPA model, which consists of three student level classes with two teacher/school level classes, is shown in Table 9 and Figure 2. The first class at the student level was named the “high group” because all science self-efficacy scores were higher than other groups. The second group at student level was the “moderate group” because all science self-efficacy scores were between the first and third groups. The final group at student level showed the lowest science self-efficacy and was named the “low group.” 50%, 25.4%, and 24.6% of students were included in the high, moderate, and low groups, respectively. Next, at the teacher/school level, the student class proportions differed greatly. The first class had the highest proportions in student class 1 and the lowest in class 3. Conversely, the second class had the highest proportions in student class 3 and the lowest in class 1. Therefore, the first teacher/school class was named the “mid-high group,” and the second was named the “mid-low group.” The scores of science self-efficacy in the mid-high group were higher than the mid-low group in the indicator level.
Overview of Latent Profile for the Three Student-level, Two School-level Profile Model.


Latent profiles at teacher/school level and student level.
Examining the Effect of Level-1 and Level-2 Determinants on Each Level Latent Profiles
Student Level
As presented in Table 10, when comparing the low and moderate groups, students with higher environmental awareness, science activities, interest in broad science topics, instrumental motivation, test anxiety, and achieving motivation were more likely to belong to the moderate group than the low group. In terms of the low group and the high group, students who had higher environmental awareness, science activities, epistemological beliefs, interest in broad science topics, enjoyment of science, instrumental motivation, achieving motivation, perceived autonomy in ICT use, and lower test anxiety were more likely to belong to the high group than the low group. Regarding the moderate and high groups, students with higher environmental awareness, science activities, epistemological beliefs, enjoyment of science, achieving motivation, and perceived autonomy in ICT use were more likely to belong to the high group than the moderate group. Apart from four covariates, including epistemological beliefs, interest in broad science topics, enjoyment of science, and perceived autonomy related to ICT use, all other covariates significantly affected the all-group classification. In contrast, inquiry-based science teaching and learning practice did not significantly affect all group classifications.
Comparison Test of Group Differences in Means of Student Level Covariates.

Note. Estimate = Wald test (df = 1).
Teacher/School Level
The p-value of the different tests are presented in Table 11. At the teacher/school level, he mid-high group had more considerable science-specific resources, higher instructional leadership, a larger student-teacher ratio, and a total number of science teachers than mid-low group. In contrast, the class size of the mid-low group was larger than the mid-high group. Additionally, all group mean differences of covariates were statistically significant.
Comparison Test of Group Differences in Means of Teacher/School Level Covariates

Note. Estimate = Wald test (df = 1).
Discussion
This study aimed to explore major factors affecting science self-efficacy based on selected optimal regression algorithms by machine learning and classify the subgroup’s science self-efficacy both at the student and teacher/school level to examine the significant determinants identifying by the machine learning process and differences in science achievement among the subgroups using MLCA.
In the finding of machine learning, at the student level, Light Gradient boosting, Gradient Boosting regressor, and Extra Trees regressor showed better performance than other machine learning models in predicting students’ science self-efficacy. At the teacher/school level, the performed Gradient Boosting resgressor, the AdaBoost regressor, and the Bayesian Ridge were selected as the optimal algorithms. The top three algorithms selected at each level for predicting scientific self-efficacy in this study consisted of a regularization regression model and an ensemble algorithm. Those results are consistent with existing studies showing that regularization regression models or ensemble techniques perform better in model prediction than single algorithms (Shin & Cho, 2023; Yoo, 2018).
Moreover, aggregating the results of importance rank of a predictor of the three regression models, 10 major factors at student level, including environmental awareness, science activities, epistemological beliefs, interest in broad science topics, enjoyment of science, instrumental motivation, test anxiety, inquiry-based science teaching and learning practices, student attitudes, achieving motivation, and students’ perceived autonomy related to ICT use was selected. It seemed students were more influenced by their own psychological and physical state and the environment provided by their school rather than by the influence of others, such as parents and peers. In addition, affective aspects such as interest and enjoyment in science were found to be more important than objective learning time, which was also included and not selected as a predictor by the models. These results suggest that self-interest, motivation, and creating a positive perception of the learning environment are essential for increasing self-efficacy in science.
At the teacher/school level, science-specific resources in school, instructional leadership of teachers, student-teacher ratio, class size, and total number of science teachers at school were identified as the major variables. These results suggest that the physical environment of the school may have been crucial. Resources devoted to science, class size, number of science teachers, and student-staff ratios were more important than curriculum, extra-curricular activities, school ownership, or autonomy, which were also predictors but not selected by the models. Among teacher characteristics, directive leadership was more important than objective teacher qualities, professional development, and participation. These results suggested enriching a supportive school environment can help increase students’ self-efficacy, rather than specific programs or teachers with unique skills.
Next, in the findings of MLPA, the latent profiles of science self-efficacy at student level were classified into high, moderate, and low groups and at teacher/school level were classified into mid-low and mid-high group. Some may interpret this classification as a reflection of the level of self-efficacy rather than of the heterogeneity of the samples. However, if the sample has a sole characteristic in self-efficacy, one group would have been preferred when choosing the optimal number of latent profiles. In this research, three groups at the student level were chosen, considering statistical information, interpretability, and model simplicity. In other words, students’ science self-efficacy showed qualitative differences in the extent to which their overall scores were high or low rather than differences in specific items at both levels.
Among crucial variables at the student level driven by machine learning, environmental awareness, science activities, interest in broad science topics, test anxiety, and achieving motivation significantly affected all group classifications. This finding means that students with higher environmental awareness, experienced many science activities, had a higher interest in broad science topics, had lower test anxiety, and had higher achieving motivation showed higher opportunities to belong to the group with higher self-efficacy. According to the OECD (2022), students with high environmental awareness foster curiosity and motivation for learning science and have a growth mindset, leading to higher achievement in science. From this, it is possible to conclude that increasing students’ interest in the environment and climate can increase students’ motivation for science and positively impact their scientific self-efficacy and science achievement. The relationship between motivation and self-efficacy can be illustrated through reciprocal interactions (Schunk & DiBenedetto, 2021).
What individuals think of has the potential to impact their actions, which in turn can help shape their environment. For instance, students with high science self-efficacy and confidence in their academic abilities in science area may demonstrate persistence and invest effort in their learning endeavors. Also, social and environmental factors can reinforce the relationship between motivation and self-efficacy (Schunk & DiBenedetto, 2021). From this point of view, fun science activities could reinforce their positive perception of learning progress and motivate them to persist. Since students tend to choose and engage in activities or tasks in which they possess science self-efficacy and solid belief (Kıran & Sungur, 2012) that motivation finally leads to higher science self-efficacy. Furthermore, the relationship between science activities and science self-efficacy can be interpreted as the mastery experience emphasized in Bandura’s social learning theory. Students interpret the result of tasks and activities, use these interpretations to form beliefs regarding their competence to engage in future tasks or activities, and behave with these beliefs (Britner & Pajares, 2006). Moreover, text anxiety is another of Bandura’s psychological indexes, which is a direct predictor of confidence. Anxiety from repeated underachievement can lead to a vicious cycle in which failure in achievement leads to low self-efficacy, which can lead to negative emotions and low motivation.
In addition, epistemological beliefs (the beliefs about the nature of knowledge and acquisition of knowledge), interest in broad science topics, and perceived autonomy related to ICT use significantly impacted the latent group classification distinguishing the high group and others. Higher levels of epistemological beliefs, enjoyment of science, and perceived autonomy related to ICT use were associated with a higher likelihood of belonging to the high group. However, they did not affect the distinction between the low and moderate groups. This finding is consistent with previous studies which found that students who have more sophisticated epistemological beliefs have higher self-efficacy (Schiefer, Edelsbrunner, Bernholt, Kampa, & Nehring, 2022) and that interest in science topics is positively related to self-efficacy (Rottinghaus, Larson, & Borgen, 2003). Regarding ICT autonomy, the opportunities provided by ICT-rich learning environments in schools and homes can support and enhance students’ perceived autonomy in ICT usage, which may contribute to the development of positive attitudes toward science (Areepattamannil & Santos, 2019). However, those variables did not differ between the low and middle groups, suggesting that they may be more helpful in distinguishing the high group. It is also possible that all three variables reflect more stable, higher-level interests and perceptions of the environment than current interests or motivations. Thus, they may have contributed to the high group distinction but not the other two.
On the other hand, inqury-based science teaching and learning practice did not affect distinguishing all group classification at student level. This result contrasts with prior studies that emphasized the effect of inquiry-based learning on science self-efficacy. Previous research showed that activities in inquiry-based learning can make the students feel mastery experience from the active interaction with teachers and peers so that self-efficacy increases (Jansen et al., 2015; Liu & Wang, 2022; Nzomoet al., 2023). However, some studies insisted that the minimally guided instruction in inqury learning is less effective and efficient, especially when students learn science with pure-discovery methods and get little feedback from teachers (Kirschner et al., 2006).
The results of the current study show that enhancing students’ internal interest and cultivating a broader range of knowledge, such as the environment, can help increase science self-efficacy rather than elaborate curricula or specific teaching methods. Therefore, it is essential for schools to actively support a comprehensive range of activities connected to science, such as the environment and ICT, and for classes to provide students with diverse experiences and educational environments for science, rather than just delivering regular curriculum and textbook content. Also, parental, school, and policy efforts are needed to promote a general interest in science through activities and real-life exercises. For example, parents can instill environmental awareness in their children by practicing pro-environmental behaviors at home, such as recycling. Schools can provide unique curricula and activities for students that go beyond what is taught in official textbooks. On the policy side, real-world regulations and policies could be put in place, and national events could be organized for students to participate in so that protecting the environment is not seen as an adult’s job but as something that the whole country should work on together (OECD, 2022). These real-life, hands-on activities will directly build students’ knowledge of science, and they will experience mastery through the hands-on application of their knowledge. It is expected that such experiences will increase students’ motivation and investment in science subjects, leading to higher self-efficacy and achievement, increasing their interest in science-related activities, and creating a virtuous cycle.
Next, at the teacher/school level, the critical variables selected by machine learning were significant for all group classifications. The more science-specific funding a school had, the higher the teacher’s instructional leadership, the higher the teacher-to-student ratio, and the higher the total number of science teachers, the more likely it was to be in the mid-high group than the mid-low group. This result is consistent with prior research (Darling-Hammond et al., 2020; Eccles, 2004). More science-specific funding and more science teachers per student would have led to more support for science-related programs and classes, which would have led to more positive outcomes, such as increased student interest in science and better programs (Eccles, 2004). Teachers’ leadership and the number of teachers to students may be related to feedback. Directive feedback with a clear purpose and detailed feedback that can be personalized to each individual would have effectively increased students’ self-efficacy (Dorfman & Fortus, 2019; Hattie & Timperley, 2007). However, there is little research on the impact of school characteristics on self-efficacy compared to individual characteristics, so future research must look more closely at the impact of school characteristics on students’ self-efficacy.
Conclusions
In this study, the performance of various regression algorithms using machine learning to predict science self-efficacy was evaluated, and algorithms showing excellent performance were selected based on various evaluation indexes. The importance of each variable was selected based on its influence on science self-efficacy. However, the values representing the influence of the variables used in this study provide information about the magnitude of the impact, but it is difficult to confirm the statistical significance or directionality of the influence. Also, interaction between variables may have impacted science self-efficacy.
Despite the above limitations, this study minimizes researcher subjectivity in selecting predictors of science self-efficacy. In the machine learning analysis, no single machine learning model was applied; more than 20 regression models were compared, and variables were selected considering importance rank within the top three models. In addition, the predictors were comprehensively considered at both student and teacher/school levels, rather than through a few variables of interest selected by the researchers. This methodology removes bias in the researcher’s subjectivity from predicting science self-efficacy, resulting in more objective, reliable, and stable results. Based on the results of the significance test of student and teacher/school level predictors affecting latent profile classification, this study suggest specific measures to increase science self-efficacy. Through the result in this study, these findings will enrich the discussion of school and national efforts to increase students’ self-efficacy in science.
Footnotes
Appendix
A summary of student- and teacher/school level variables of interest.

| Variable | Description | |
|---|---|---|
| Student level | Backgrounds | OECD country status, International grade, Gender, Age, ISCED level, Immigration status, Family wealth (WLE), Index of economic, social, and cultural status (WLE) |
| Environment | Language at home, Grade repetition, Duration in early childhood education in years of schooling, Environmental awareness (WLE), Environmental optimism (WLE), Number of school changes, Cultural possessions at home (WLE), Home educational resources (WLE), Home possessions (WLE) | |
| Related to ICT | ICT available at home index (Sum), ICT available at school index (Sum), ICT resources (WLE), Students’ ICT interest (WLE), Students’ perceived ICT competence (WLE), Students’ perceived autonomy related to ICT use (WLE), Age first to use a digital device/computer/Internet, Duration to use the Internet at school in weekday, Duration to use the Internet outside of school in weekday, Duration to use the Internet outside of school on the weekend, ICT use outside of school for schoolwork (WLE), ICT use outside of school leisure (WLE), Use of ICT at school in general (WLE), Students’ ICT as a topic in social interaction (WLE) | |
| Related to learning | Instrumental motivation (WLE), Epistemological beliefs (WLE), Expected occupational status, Sense of belonging to school (WLE), Enjoy cooperation (WLE), Value cooperation (WLE), Perceived feedback (WLE), Teacher fairness (Sum), Changing ‘study program’ status, Total payment to educational providers for services, Teacher support in a science classes of students choice (WLE), Inquiry-based science teaching and learning practices (WLE), Teacher-directed science instruction (WLE), Out-of-School study time per week (Sum), Learning time (minutes per week): mathematics/test language/science/ total, Adaption of instruction (WLE), Number of learning domains with additional instruction, Total hours of additional instruction (Sum), Comparison science school lessons and additional instruction: support/structuredness lessons/structuredness content/teacher-student relation(Mean), Comparison mathematics school lessons and additional instruction: support/structuredness lessons/structuredness content/teacher-student relation(Mean) | |
| Related to personality | Test anxiety (WLE), Achieving motivation (WLE), Parents’ emotional support (WLE), Parental current support for learning at home (WLE), Parental emotional support (WLE) | |
| Related to science/test | Disciplinary climate in science classes (WLE), Enjoyment of science (WLE), Interest in broad science topics (WLE), Index science activities (WLE), Number of science disciplines and subjects with additional instruction (Sum), Child’s past science activities (WLE). Mode of respondent, Language of questionnaire, Language of assessment | |
| Related to parents | Mother’s education (ISCED), Father’s education (ISCED), ISEI of mother, ISEI of father, Index highest parental education in years of schooling, Parents perceived school quality (WLE), School policies for parental involvement (WLE), Parents’ view on science (WLE), Parents concerns regarding environmental topics (WLE), Parents’ view on future environmental topics (WLE) | |
| Teacher/School level |
School background | School location, School size (Sum), Class size, total number of boys, total number of girls |
| School facility | Number of available computers per student at modal grade, Proportion of available computers that are connected to the Internet, School autonomy (Mean), Shortage of educational material (WLE), Shortage of educational staff (WLE) | |
| School support | Educational leadership (WLE), Curricular development (WLE), Instructional leadership (WLE), Professional development (WLE), Teachers participation (WLE), Responsibility for curriculum, Responsibility for resources, Teacher participation (Sum), Index proportion of all teachers fully certified, Total number of all teachers at school, Index proportion of science teachers by all teachers, Index proportion of science teachers fully certified, Index proportion of science teachers with ISCED level 5A and a major in science, Total number of science teachers at school, Creative extra-curricular activities (Sum), Index science specific resources (Sum), Student behavior hindering learning (WLE), Teacher behavior hindering learning (WLE), Student-Teacher ratio, School Ownership | |
| Teacher background | Gender, Age, Year(s) working as a teacher at this school, Year(s) working as a teacher in total, Completed highest level of formal education, Employment status contract, Teacher employment time, Number of schools employed by | |
| Perception | Satisfaction with the current job environment (WLE), Satisfaction with teaching profession (WLE), Educational material shortage teachers view (WLE), Staff shortage teachers view (WLE), Self-efficacy related to teaching science content (WLE), Self-efficacy related to science content (WLE), Transformational leadership teachers view (WLE) | |
| Related to teacher’s teaching | Science teacher collaboration (WLE), Teacher-parent co-operation, Exchange and co-ordination for teaching (WLE), Student assessment practices, ICT skills for teaching, Goal to pursue a career in the teaching profession, Teacher education or training program completion status, Ways to receive teaching qualifications, Participated in professional development in the last 12 months, Knowledge and understanding of my subject field(s), Pedagogical competencies in teaching my subject field(s), Knowledge of the curriculum, Student behavior and classroom management, School management and administration, Approaches to individualized learning, Teaching students with special needs, Teaching in a multicultural or multilingual setting, Teaching cross-curricular skills, Student career guidance and counseling, Internal evaluation or self-evaluation of schools, Use of evaluation results | |
Declaration of Conflicting Interests
The author(s) declared no potential conflicts of interest with respect to the research, authorship, and/or publication of this article.
Funding
The author(s) received no financial support for the research, authorship, and/or publication of this article.
Ethical Approval
This study used a secondary data from the Programme for International Student Assessment (PISA) without identifying information and was exempted from Institutional Review Board approval.
Data Availability Statement
The datasets generated during and/or analyzed during the current study are available from the corresponding author on reasonable request.