
Abstract
In this article, we use eXtreme Gradient Boosting (XGBoost) to examine the factors that determine the success of an IPO and how these factors interact. We find that, among various variables related to the investment history of the investor and investee firms, the total number of fund investors (TNFund), the capital under management of the firm investor (FCUM), the days between the first investment date and the founding date of the firm investor (FIFFD), and the days between the last investment received date and the founding date of the investee company (INLFD) are the four main determinants of a company’s IPO. Using SHapley Additive exPlanations (SHAP), we study the interaction effects between the main factors and discover that FCUM tends to interact with INLFD. We have tested our conclusions with different sub-samples, balanced samples using various balancing methods, and a variety of other machine learning methods such as Gaussian process regression, random forest, neural networks, and support vector machines, and we have found that our main conclusions are robust.
Keywords
Introduction
An Initial Public Offering (IPO) represents a significant milestone in the lifecycle of a company, marking its transition from a private entity to a publicly traded company. Through an IPO, a company offers its shares to the public for the first time, enabling it to raise capital from a broad base of investors. The IPO process serves as a vital mechanism for financing growth, increasing the company’s visibility, and providing liquidity for its founders and early investors (Brau & Fawcett, 2006; Pagano et al., 1998). However, the decision to go public is influenced by a variety of complex factors, which can affect the success of the offering and the company’s long-term performance in the public market.
The decision to conduct an IPO and its eventual outcome is shaped by two key categories of factors: firm-specific characteristics and market conditions. Firm-specific factors include the financial health of the company, its growth potential, governance structure, and the history of its investors and investee relationships (Bodnaruk et al., 2008; Chemmanur et al., 2010). Market conditions, such as investor sentiment, macroeconomic trends, and the regulatory environment, also play a crucial role in determining the timing and success of an IPO (Aslan & Kumar, 2011; Subrahmanyam & Titman, 1999). Understanding these factors is essential for both companies considering an IPO and for investors assessing the potential risks and returns associated with the offering.
In our study, IPO success is defined as a firm’s successful transition from being privately held to publicly traded on a stock exchange. This definition aligns with prevailing perspectives in financial literature, where achieving public listing status is commonly regarded as the benchmark for IPO success (Aghamolla & Thakor, 2022). Our focus is on the completion of the IPO process itself, independent of the firm’s subsequent stock market performance. To operationalize this concept, we represent IPO success as a binary variable, assigning a value of 1 if the firm completes an IPO within the observation period and 0 if it does not.
In this study, we use machine learning techniques such as XGBoost and SHAP to assess the importance of various factors and examine their interdependencies. Our findings suggest that factors such as the total number of fund investors, the capital under management by investors, and the timing of investments relative to the company’s founding date are key determinants of an IPO. Notably, we uncover significant interactions between some of these factors, further enhancing our understanding of the IPO process.
By focusing on the investor-investee relationship and leveraging advanced machine learning methods for factor interaction analysis, this research contributes to a more nuanced understanding of IPO dynamics, providing valuable insights for both academic research and practical decision-making in the investment community (Arroyo et al., 2019; Żbikowski & Antosiuk, 2021).
This study aims to explore the factors that most strongly influence a company’s IPO, with a particular focus on the history of investor-investee relationships. The main objective of our research is to provide a comprehensive understanding of how investment history affects IPO outcomes through advanced machine learning techniques. Specifically, we aim to:
(a) Identify the key variables tied to the investment histories of both the firm and its investors that are most associated with the IPO decision and its outcomes.
(b) Investigate how these factors interact with one another using the SHAP (SHapley Additive exPlanations) method, a tool that interprets the complex relationships between factors in predictive models.
(c) Provide actionable insights for both academic research and practical decision-making in the investment community.
This research is significant for several reasons. For companies contemplating an IPO, understanding the factors that influence IPO success can assist in decision-making and strategy development (Colak et al., 2022). Likewise, investors can benefit from understanding how historical investment behaviors impact IPO outcomes, guiding their investment decisions (Munshi et al., 2022). Furthermore, by employing the SHAP method to analyze interactions between factors, we provide a clearer understanding of how different elements combine to influence IPO outcomes, offering insights that go beyond simple factor importance.
The remaining sections of this paper are organized as follows. In section “Literature,” we review some relevant literature and introduce our main contributions to the literature. We provide an overview of XGBoost and SHAP techniques in section “Methodology.” In section “Data and Results,” we present the data, results, and robustness checks. Finally, we conclude our study in section “Conclusion.” We have included some tables and figures in Appendix A for further reference.
Literature
The literature on IPOs provides valuable insights into the factors that influence a company’s decision to go public and its performance in the IPO process. A significant body of work has emphasized the critical role that venture capital (VC) plays in shaping both the decision to go public and the post-IPO performance of firms. For instance, Gompers (1995) found that venture capitalists typically target companies with lower industry ratios, higher market-to-book ratios, and greater research and development (R&D) intensities. These characteristics, according to Gompers, make firms more attractive to investors and increase the likelihood of a successful IPO. Moreover, venture capitalists gather periodic information to decide whether to continue investing in these companies, and through professionalization measures, such as implementing human resource policies and stock option plans, they can reduce the costs associated with going public (Hellmann & Puri, 2002; Megginson & Weiss, 1991). In this way, venture capitalists can increase the probability of a successful IPO by improving the firm’s governance and marketability.
Chemmanur et al. (2021) found that strong venture capital backing, combined with a high-quality executive team, results in better IPO valuations. Venture capitalists play a critical role by helping firms select and effectively implement higher-quality projects, thereby reducing the asymmetric information faced by companies during the IPO process. These findings suggest that the involvement of venture capitalists affects not only the timing and structure of the IPO but also enhances the company’s attractiveness to investors.
However, not all research supports the idea that venture capital always facilitates IPO success. Liu et al. (2021) observed that in China, venture capital-backed IPOs are less likely to gain regulatory approval unless the venture capitalists possess strong political connections and significant ownership stakes in the company. This highlights that the role of venture capital can vary significantly depending on geographical and regulatory contexts, suggesting that its influence is not universally positive.
In addition to venture capital, several external factors have been identified as influencing a company’s decision to go public. Market and industry stock returns, industry market-to-book ratios, information availability, and regulatory environments are all crucial determinants (Anderson & Dyl, 2008; Aslan & Kumar, 2011; Brau & Fawcett, 2006; Subrahmanyam & Titman, 1999). Companies are also more likely to go public when they observe the IPOs of their competitors, reflecting peer effects (Aghamolla & Thakor, 2022). Firm-specific characteristics, such as size, sales growth, capital intensity, total factor productivity, and industry competitiveness, also play a significant role in the likelihood of an IPO (Aslan & Kumar, 2011; Chemmanur et al., 2010; Pagano et al., 1998). Moreover, managers who build a reputation for treating minority shareholders fairly increase the chances of a successful IPO (Gomes, 2000). Firms with controlling shareholders who hold less diversified portfolios are also more likely to go public (Bodnaruk et al., 2008).
Recent advancements in machine learning have opened new avenues for predicting IPO outcomes, an area that has seen growing interest in recent years. Studies have employed machine learning methods to predict startup success (Arroyo et al., 2019; Colak et al., 2022; Munshi et al., 2022; Ross et al., 2021; Yin, Li, & Wu, 2021; Żbikowski & Antosiuk, 2021), financial distress (Tang et al., 2020), and IPO initial returns (Baba & Sevil, 2020; Quintana et al., 2017). Machine learning models have demonstrated their ability to predict IPO outcomes with increasing accuracy, offering valuable tools for decision-making for investors and firms alike.
One notable technique in this domain is Gradient Boosting, specifically XGBoost, which has proven effective in IPO prediction. Arroyo et al. (2019) analyzed various machine learning methods using data from Crunchbase and found that Gradient Tree Boosting was the most effective for predicting a startup’s subsequent funding rounds. Similarly, Żbikowski and Antosiuk (2021) compared three supervised machine learning methods—logistic regression, support vector machines, and gradient boosting classifiers—and found that the gradient boosting classifier performed best in predicting business success. XGBoost has also been found to be highly accurate for predicting startup success (Yin et al., 2021), IPO performance (Munshi et al., 2022), and IPO failure risk (Colak et al., 2022).
In addition to predicting IPO outcomes, machine learning has been used to forecast financial distress, enhancing the accuracy of these predictions by incorporating both financial and textual data (Tang et al., 2020). Quintana et al. (2017) and Baba and Sevil (2020) also utilized random forest methods to predict IPO initial returns, further contributing to the growing body of research employing machine learning for IPO analysis.
More recent studies have further advanced the application of machine learning in IPO research. Alahmadi (2025) introduced a deep learning-based ensemble framework to optimize IPO performance prediction, incorporating advanced techniques such as hyperparameter optimization and dynamic metric adaptation. This research highlights the potential of deep learning approaches to enhance IPO prediction accuracy in volatile financial markets.
Li et al. (2024) employed machine learning to investigate the effects of firm and CEO characteristics on stock price crash risk, finding that XGBoost was the most effective model for prediction. Using the SHAP method to interpret feature importance, they discovered that average weekly return contributed most significantly to crash risk, followed by factors such as volatility, IPO age, and firm size. Their research demonstrates the value of combining machine learning with interpretability techniques like SHAP to provide insights into complex financial phenomena.
A hybrid approach combining logistic regression and decision trees was proposed by researchers in 2025 to predict the initial three-year post-IPO performance of companies (Supsermpol et al., 2025). This hybrid methodology leverages the strengths of both traditional statistical methods and machine learning techniques to improve prediction accuracy while maintaining interpretability, addressing a key challenge in financial forecasting.
Research Gap and Hypotheses Development
Despite the growing body of research on machine learning for IPO prediction, the majority of studies have not explored the complex interactions between the various factors influencing IPO outcomes. While existing literature has identified numerous individual factors affecting IPO success—such as venture capital backing, firm-specific characteristics, and market conditions—there has been limited research on how these factors interact to collectively shape IPO outcomes. Prior studies often focus on isolated factors without examining the complex interactions between them. This represents a significant research gap, as understanding these interactions is critical for providing a comprehensive view of IPO dynamics.
Furthermore, while machine learning techniques have been increasingly applied to IPO prediction, there remains a need for interpretable models that can not only predict outcomes but also provide insights into the underlying mechanisms. The black-box nature of many machine learning approaches limits their utility for decision-makers who need to understand the rationale behind predictions. Recent advances in explainable AI, particularly SHAP, offer promising solutions to this challenge, but their application in IPO research remains limited.
Based on our review of the literature and identification of research gaps, we propose the following hypotheses:
Our research builds upon the existing literature by not only predicting IPO success but also by investigating how different factors—such as venture capital backing, firm-specific characteristics, and market conditions—interact to influence IPO outcomes. By testing these hypotheses, our study aims to provide a more comprehensive model of IPO dynamics. The use of SHAP represents a novel approach in IPO research, allowing us to offer actionable insights into the factors that matter most for IPO success.
In summary, our study addresses the research gap by exploring the interactions between IPO determinants using machine learning and SHAP. We hypothesize that venture capital backing, firm-specific characteristics, and market conditions interact in ways that significantly affect IPO outcomes. This approach adds value to the literature by providing a deeper, more nuanced understanding of IPO success and by offering a new methodology for interpreting complex factor interactions.
Methodology
In this section, we introduce two key machine learning concepts: eXtreme Gradient Boosting (XGBoost) and SHapley Additive exPlanations (SHAP), and explain how these methods are used to test our hypotheses regarding IPO success factors and their interactions. Our methodological approach is designed to address the research gap identified in the literature review by enabling the analysis of complex, non-linear relationships between investment history factors and IPO outcomes.
Machine Learning Approach
Our study employs XGBoost to model the relationships between IPO success and a range of constructed factors. Unlike traditional linear regression, which assumes linear relationships, XGBoost is capable of capturing non-linear, hierarchical, and complex associations between variables. This is because XGBoost is based on decision trees, which, similar to random forests, allow for greater flexibility in modeling complex interactions (Chen & Guestrin, 2016). The XGBoost algorithm builds an ensemble of decision trees sequentially, with each new tree correcting errors made by previously trained trees, making it particularly effective for predicting binary outcomes such as IPO success.
However, one challenge of using such complex models is interpreting their results. SHAP addresses this issue by providing an intuitive method for understanding model predictions (Lundberg & Lee, 2017). SHAP explains how each factor contributes to the outcome by computing Shapley values, which represent the individual contributions of each variable. Moreover, SHAP is particularly useful for exploring interaction effects between different factors, which is central to our research objectives.
XGBoost
XGBoost is a gradient boosted tree with more efficiency. In other words, XGBoost is an ensemble ML method by combining a number of weak decision trees to make a strong model. Given a dataset with n samples of

where

where l is a loss function and
In practice, greedy algorithms are used to evaluating a split. Mathematically,
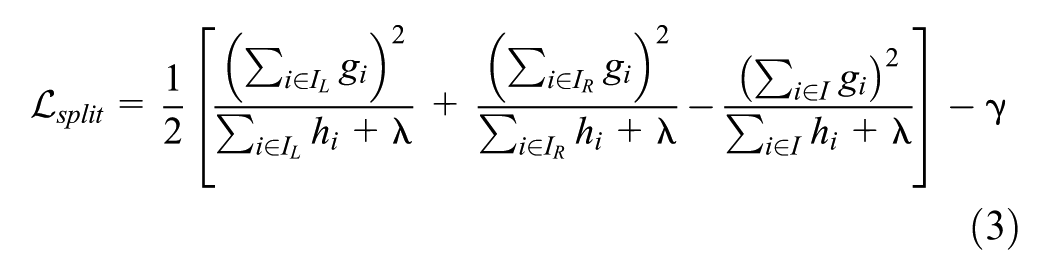
where
SHAP
Lundberg and Lee (2017) proposes SHAP which is based on game theory (Štrumbelj & Kononenko, 2014) and local explanations (Ribeiro et al., 2016), and is a means to compute the contribution of each factor. Consider a dataset with

SHAP can be used to study interaction effects which are computed as follows:

where
Why XGBoost and SHAP
Traditional regression methods can model non-linear relationships through polynomial terms, splines, or interaction terms. However, they often require the prior specification of the functional form, which can lead to model misspecification if the true relationships are complex or not well understood. In contrast, XGBoost, a powerful machine learning algorithm, eliminates the need for predefined functional forms. It automatically learns complex, non-linear, hierarchical, and high-order interactions from the data using decision tree ensembles. This makes XGBoost particularly suited for datasets with intricate patterns and relationships, as it adapts to the data without relying on assumptions about the underlying structure.
Moreover, XGBoost excels in handling high-dimensional datasets, a challenge that traditional regression models often struggle with. When dealing with multicollinearity or large numbers of predictors, regression models require careful feature selection or regularization to prevent overfitting. XGBoost addresses this issue by incorporating built-in regularization techniques, such as L1 (lasso) and L2 (ridge) penalties, which control model complexity and enhance generalization. It also provides feature importance ranking, allowing researchers to pinpoint the most influential predictors, even in high-dimensional spaces. From a computational perspective, XGBoost is optimized for speed and scalability, utilizing parallel and distributed computing to accelerate training on large datasets, making it ideal for analyzing real-world data like ours, sourced from Thomson Reuters Eikon, which includes thousands of firms and numerous features.
SHAP complements XGBoost by offering interpretability and transparency, which are often a challenge in machine learning. Traditional regression methods provide interpretability through coefficients, but SHAP enhances this by calculating Shapley values from cooperative game theory. Shapley values quantify the marginal contribution of each feature to the model’s prediction, enabling a more detailed understanding of how individual variables and their interactions influence the outcome. SHAP’s ability to visualize feature importance and interaction effects provides insights that are not immediately obvious from coefficients or summary statistics.
Together, XGBoost and SHAP balance the trade-off between accuracy and interpretability, which is a critical challenge in machine learning. XGBoost delivers high predictive performance, while SHAP ensures that the results are interpretable and actionable. This combination is particularly valuable in our study, where we aim to generate robust predictions while providing meaningful insights into the factors influencing IPO success. By using both methods, we can offer accurate predictions that are also comprehensible and actionable for stakeholders.
In the context of our study on IPO success, XGBoost and SHAP provide a powerful combination for both prediction and interpretation. Traditional regression methods, while useful, often struggle to capture the complex, non-linear relationships and high-order interactions that influence IPO outcomes. By using XGBoost, we can automatically model these intricate patterns, identifying key factors such as the total number of fund investors (TNFund), capital under management (FCUM), and investment history variables that impact IPO success. XGBoost’s ability to handle high-dimensional data with regularization techniques also ensures that our models are both accurate and generalizable, even when dealing with large datasets like the one sourced from Thomson Reuters Eikon.
SHAP, in turn, enhances the interpretability of our XGBoost models by providing clear insights into how individual factors, as well as their interactions, contribute to the prediction of IPO success. For example, our study highlights how the interaction between FCUM and INLFD can influence IPO outcomes, a relationship that is difficult to capture with traditional regression models. By calculating Shapley values, SHAP allows us to understand these complex interactions in a meaningful way, making the results not only predictive but also actionable for firms and investors. This combination of XGBoost and SHAP in our study addresses the need for both robust prediction and clear interpretation, helping stakeholders make informed decisions based on the factors that truly drive IPO success.
Hypothesis Testing Framework
The primary goal of our study is to identify the key factors influencing IPO success and analyze the interactions between these factors. To achieve this, we utilize machine learning techniques, specifically XGBoost and SHAP, which are well-suited for capturing non-linear relationships and the interactions that traditional econometric models may overlook. Our hypothesis testing framework is structured as follows:
Testing H1 (TNFund’s influence on IPO success): We evaluate the importance of the total number of fund investors (TNFund) in our XGBoost model through SHAP values, which quantify the contribution of this variable to the prediction of IPO success. Additionally, we analyze how this effect varies with company operating history by examining interaction plots between TNFund and company age.
Testing H2 (FCUM’s relationship with IPO success): We assess the impact of firm investor’s capital under management (FCUM) on IPO outcomes through SHAP values and partial dependence plots, which visualize the marginal effect of FCUM on the predicted probability of IPO success while accounting for the average effects of all other variables.
Testing H3 (Timing of investments and IPO outcomes): We examine the importance of investment timing variables (FIFFD and INLFD) through their respective SHAP values and analyze their relationships with IPO success through partial dependence plots. This allows us to determine whether earlier investments (FIFFD) and more recent pre-IPO investments (INLFD) are positively associated with IPO success.
Testing H4 (Interaction effects between factors): We utilize SHAP interaction values to quantify and visualize the interaction effects between key investment history factors, with particular focus on the interaction between FCUM and INLFD. This approach allows us to determine whether these factors interact in ways that influence IPO outcomes beyond their individual effects.
Model Variables and Data
The independent variables in our model are selected based on theoretical significance and practical relevance, as informed by the literature. These include:
TNFund: Total number of fund investors, which captures investor confidence and signaling effects.
FCUM: Firm investor’s capital under management, which reflects financial stability and expertise.
FIFFD: Days between the first investment and the founding date of a firm investor, representing early investment activity.
INLFD: Days between the last investment received and the founding date of the investee company, indicating recent investment.
We also include control variables to account for firm-specific characteristics and external factors, such as industry classification, firm age, and market conditions.
Robustness Testing
To ensure the robustness and validity of our findings, we implement a comprehensive validation strategy:
Alternative machine learning methods: We test our hypotheses using multiple machine learning algorithms beyond XGBoost, including Gaussian process regression, random forest, neural networks, and support vector machines. This approach helps verify that our findings are not artifacts of a specific modeling technique.
Balanced datasets: We address potential sampling biases by applying various balancing techniques to our dataset and re-testing our hypotheses on these balanced samples.
Sub-sample analysis: We validate our findings across different sub-samples of our data to ensure consistency across various market segments and time periods.
This multi-faceted validation approach strengthens the credibility of our findings and ensures that our conclusions regarding the factors influencing IPO success and their interactions are robust and generalizable.
By employing this methodological framework, we are able to address the research gap identified in the literature review, specifically the need to understand how different factors interact to collectively shape IPO outcomes. Our approach goes beyond identifying individual determinants of IPO success to provide insights into the complex interplay between these factors, offering a more nuanced understanding of IPO dynamics.
Data and Results
Firstly, we will introduce the dataset used in this study and provide a summary of its key statistics. Secondly, we will apply Logit regression to analyze the data and present our results. Thirdly, we will utilize XGBoost and SHAP to conduct feature importance and dependence analyses, allowing us to identify the most significant factors influencing the outcome variable and explore how they interact. Fourthly, we will perform robustness checks by applying alternative machine learning methods and using different subsamples to ensure the reliability and generalizability of our findings. Finally, we summarize the results.
Data
In our study, we focus on firms that have engaged in venture capital activities and are potential candidates for an initial public offering (IPO). The data used for the analysis is sourced from Thomson Reuters Eikon, a reputable financial database known for its accuracy and reliability. This dataset encompasses firm-level characteristics, historical investment records, and IPO outcomes across a wide range of industries and geographies.
To construct our sample, we applied the following inclusion criteria: Firms must have full records of investment history, including both the timing and magnitude of investments. Firms must have a definitive IPO outcome (successful or unsuccessful) recorded within the observation period. Firms with missing or inconsistent data were excluded from the analysis to maintain the integrity of the results.
As a result, our final sample includes 9,177 firms, of which 404 successfully achieved an IPO, accounting for approximately 4% of the sample. The remaining 8,773 firms did not achieve an IPO. The low proportion of IPOs underscores the competitive and selective nature of the IPO process, highlighting the importance of identifying the key factors that influence IPO success. The oldest companies in our sample are Friedrich Air Conditioning Co. Ltd. and Hawaiian Telcom Communications Inc., both of which were founded in 1883. However, neither of these companies was able to achieve an IPO. The oldest firm and fund investors in our sample are MDeer Management Co. LLC and Vantage Partners, L.P., established in 1911 and 1999, respectively. Additionally, HelpSystems Inc. holds the record for the highest round number at 24 but has yet to undergo an IPO.
We provide a detailed breakdown of the key variables (Table 1) used in our analysis, along with their summary statistics (Table 2). Notable variables include.
Definitions of Variables.
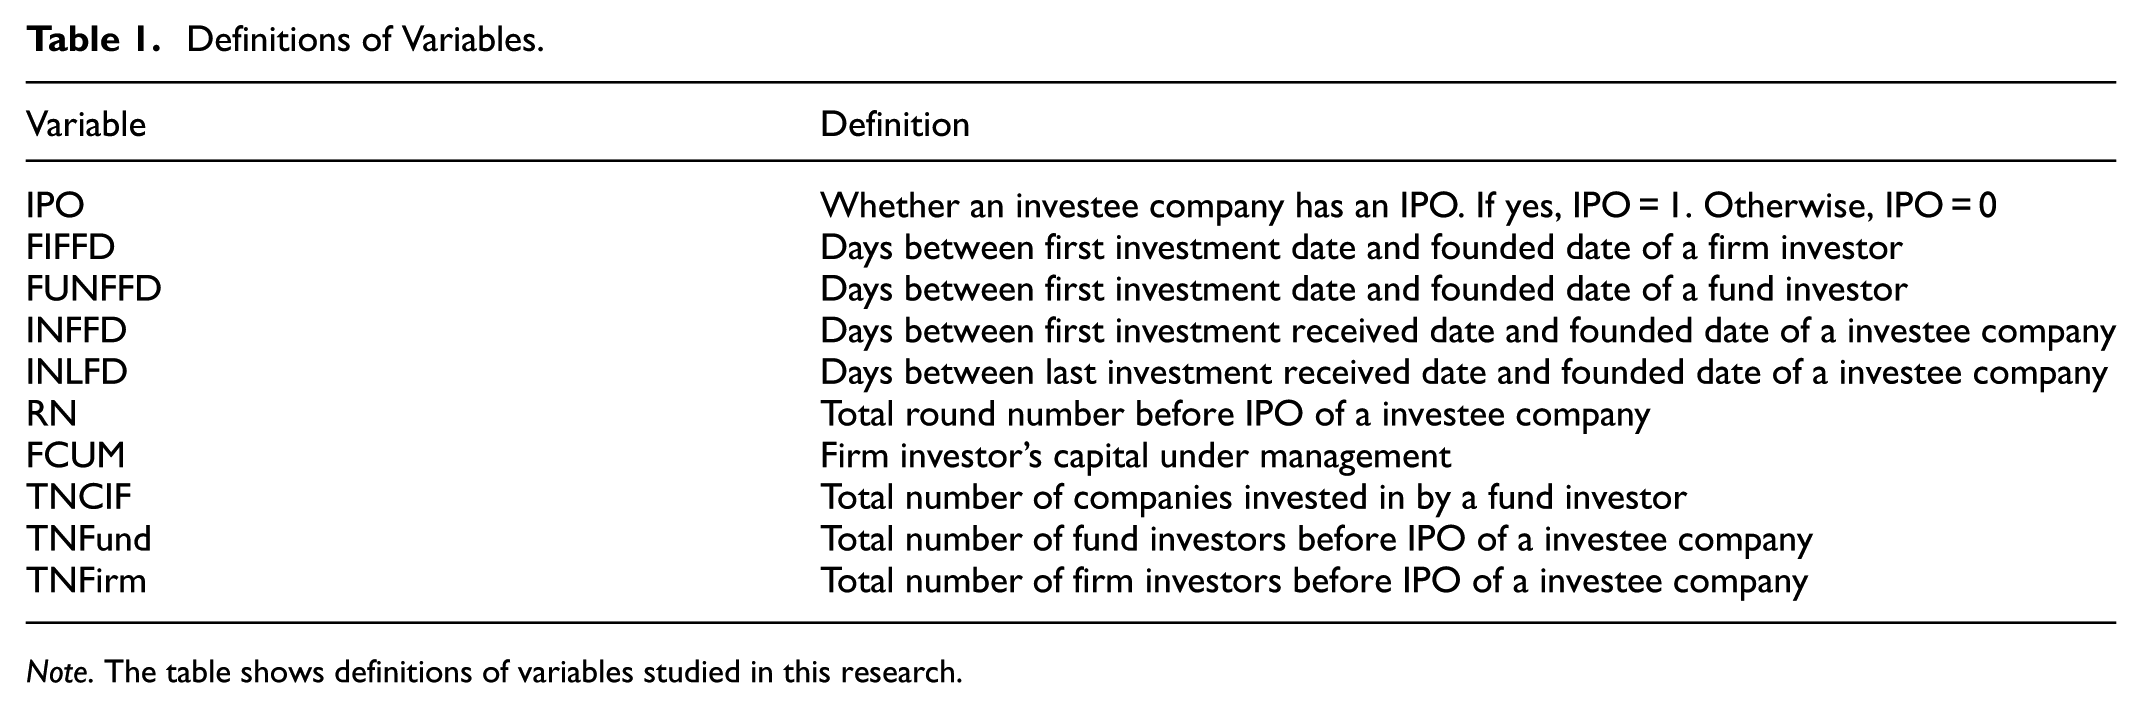
Note. The table shows definitions of variables studied in this research.
Summary Statistics.

Note. The table shows summary statistics. The data is from Thomson Reuters Eikon. FIFFD, FUNFFD, INFFD, INLFD are in years, FCUM in million.
FIFFD (mean = 2.93 years): The average time between the first investment and the founding date of the firm investor.
TNFund (mean = 4.61): The average total number of fund investors per investee firm.
IPO success rate: Firms with higher values of TNFund and FCUM are more likely to achieve an IPO, as demonstrated by the data summary and correlation tables.
We also explore the distribution of the data and its implications for our analysis. Our findings indicate that firms with successful IPOs tend to have higher values for variables such as TNFund and FCUM, suggesting that these factors are critical predictors of IPO success. To address potential biases arising from the imbalance between IPO and non-IPO cases, we implement data-balancing techniques, such as oversampling and undersampling, during the analysis process.
We also present visual summaries such as correlation matrices and descriptive statistics. These tools offer a clearer understanding of the data structure and the relationships between variables. This approach ensures that the data selection and processing steps are transparent and aligned with the goals of the study. Table 3 displays the correlations between variables, while Figure 1 provides a visual representation of these correlations. We observe a strong correlation between IPO and both TNFund and TNFirm. TNFund is also highly correlated with INFFD and RN, making it a key factor to consider.
Correlations Between Variables.

Note. The table shows correlations between variables. The data is from Thomson Reuters Eikon. FIFFD, FUNFFD, INFFD, INLFD are in years, FCUM in million.

Correlations between variables.
A comparison of IPO and non-IPO companies reveals that those that achieved an IPO tend to have higher values for FIFFD, RN, FCUM, TNCIF, TNFund, and TNFirm, but lower values for FUNFFD and INLFD. It is also noteworthy that non-IPO companies tend to have higher maximum values for all factors, as we truncate the data by the IPO date. This means that values occurring after a company has gone public are not considered in our analysis.
Logit Regression Results
In this section, we present the results obtained using traditional regression methods, specifically Logit regression. Tables 4 and 5 display the Logit regression results with and without interaction terms, respectively. According to Table 4, the coefficient for TNFund is approximately .20, which translates into an odds ratio of
Logit Regression Results.

p < .1. **p < .05. ***p < 0.01.
Logit Regression With Interactions.

p < .1. **p < .05. ***p < .01.
Table 5, which includes some interaction terms, shows that the positive associations between TNFund and FCUM with IPO are quite robust. Furthermore, we discovered that INLFD (days between last investment received date and founded date of an investee company) has a negative interaction with FCUM, whereas FIFFD (days between first investment date and founded date of a firm investor) also has a negative interaction with FCUM. The interaction term between FCUM and INLFD has a negative coefficient, suggesting that the positive impact of FCUM on IPO likelihood diminishes as INLFD increases. This is an evidence that delayed investments (higher INLFD) may signal reduced investor interest or stagnation, which offsets the benefits of high capital backing.
It is worth noting that when conducting Logit regression, the assumption is that the specification is correct, meaning that the IPO is linked to the factors as we specify. However, we do not have knowledge of how the IPO is connected to these factors and how these factors correlate with others. Therefore, it is prudent to choose a method that does not require us to specify the relationship beforehand but allows the method itself to learn the relationship from the data. This is why machine learning methods are necessary.
The practical implications of these findings are crucial for both firms seeking to go public and investors looking to maximize the likelihood of an IPO. First, the positive association between TNFund (total number of fund investors) and IPO success suggests that firms should prioritize securing a diverse and reputable group of investors early in their lifecycle. By attracting a higher number of investors, firms can significantly increase their chances of successfully going public. For investors, this emphasizes the importance of participating in multiple investments to strengthen their influence and improve the likelihood of IPO success for the companies they support.
Moreover, the positive relationship between FCUM (capital under management by investors) and IPO success suggests that firms with substantial financial backing are more likely to achieve an IPO. Firms aiming for an IPO should focus on securing investors with significant capital resources, as this not only boosts their financial stability but also enhances their credibility in the eyes of potential IPO investors.
However, the interaction effects uncovered by the analysis—particularly the negative interaction between FCUM and INLFD (the time between the last investment received and the founding date of the investee company)—suggest that timing plays a critical role. While a high capital base is beneficial, if the firm experiences long gaps between investments (as indicated by a high INLFD), this could signal stagnation or waning investor interest, thereby diminishing the positive impact of strong financial backing. Consequently, firms should maintain a steady flow of investments up until the IPO process to ensure that they do not lose momentum.
The finding that FIFFD (the time between the first investment and the founding date of the firm investor) also negatively interacts with FCUM further emphasizes the importance of maintaining an ongoing and active investment relationship. Firms should seek early, consistent backing from investors to signal long-term commitment, as this engagement is positively associated with IPO success.
In summary, for firms aiming to secure an IPO, it is essential to foster strong, long-term relationships with a diverse group of investors who can provide both financial capital and strategic support. For investors, the results suggest that maintaining consistent involvement with their investee firms is critical for enhancing IPO prospects. Additionally, the study highlights the need for a balanced approach to investment timing, as delayed investments can counteract the benefits of having substantial financial backing.
Next, we utilize XGBoost to model the relationship between IPO and factors. Subsequently, we conduct feature importance and dependence analysis to study which factors are the most important in predicting IPO and how the selected main factors interact with each other.
Feature Importance and Dependence Analysis
The results of the feature importance analysis using XGBoost are presented in Figure 2, indicating that TNFund, FCUM, FIFFD, and INLFD are the four key factors. In the left panel of Figure 2, we can observe that TNFund and FCUM exhibit a positive correlation with the likelihood of obtaining an IPO, which is in line with the outcomes obtained from Logit regression, as demonstrated in Tables 4 and 5. Figure 3 illustrates the interactions among the four primary factors. Although we do not notice any apparent interactions among them, we do detect weak interaction effects between FCUM and INLFD. Specifically, when FCUM is high, INLFD tends to be high as well, and INLFD appears to mitigate the influence of FCUM on IPO. This finding is consistent with the outcomes depicted in Table 5.

Average impacts on IPO.
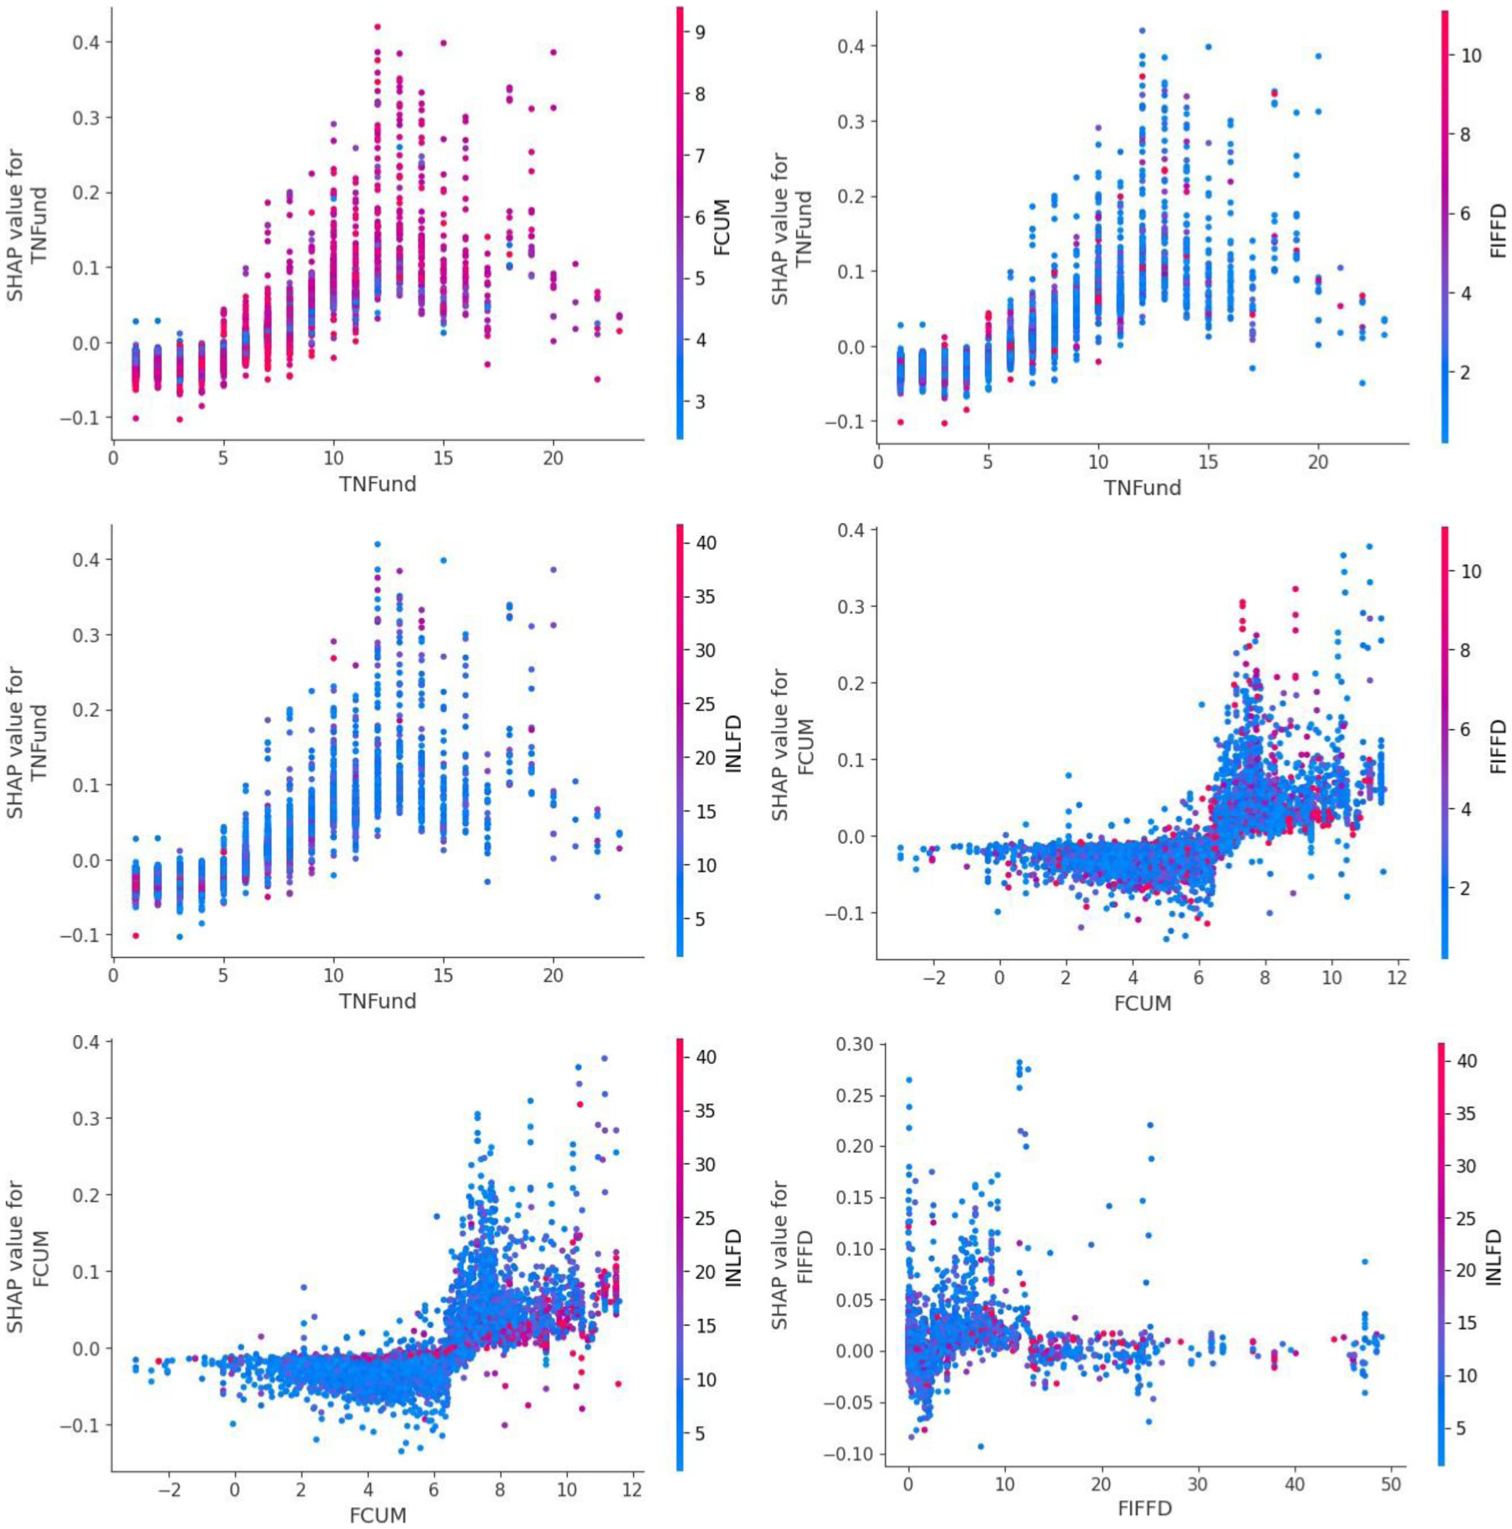
Interaction effects between main factors.
Specifically, the hypotheses are evaluated as follows:
Robustness Checks
In this section, we present several robustness checks to validate our results. Firstly, we divide the sample into two subsamples based on TNFund. Secondly, we balance the sample using multiple methods. Thirdly, we employ other machine learning techniques. Our findings indicate that the main results presented earlier are highly robust. Fourthly, we make a summary for the robustness checks. Lastly, we provide some discussion on strategic suggestions from SHAP.
Data Separation
In this section, we’ve categorized the dataset based on TNFund, which is the most significant predictor for IPO, and conducted similar research as earlier. Specifically, we’ve divided the data into two groups: one with TNFund greater than 4, and the other with TNFund less than or equal to 4. Table 6 in the Appendix presents the summary statistics for these subsets, revealing that the IPO ratio is considerably higher for the high TNFund group than the low TNFund group (.09 vs. .02). This result is consistent with higher TNFund predicting a higher likelihood of IPO, as demonstrated in Table 4 and Figure 2. Tables 7 and 8 in the Appendix exhibit the Logit regression results without and with interaction terms. We observe that when TNFund > 4, the positive relationship between TNFund and IPO is significant. However, when TNFund ≤ 4, the connection is not always significant, although it remains positive. Finally, Figure 4 in the Appendix illustrates the feature importance results. When TNFund is greater than 4, FCUM, TNFund, and FIFFD are among the top four most important factors. However, when TNFund is less than or equal to 4, the top five factors are similar to those selected using the full sample. It’s worth noting that TNFund is considered the least important factor when it’s less than or equal to 4, which is expected due to the limited variation of TNFund in that case.
Balancing Data
In this section, we present results obtained from a balanced dataset using a range of techniques. The methods used for balancing the data include random undersampling, random oversampling, undersampling based on Tomek links, synthetic minority oversampling, and nearmiss undersampling. Figure 5 in the Appendix shows the feature importance results. We can see that the top five factors are very similar the ones selected using the full sample as shown in Figure 2.
Other Machine Learning Methods
To ensure the robustness of our findings, we also applied various machine learning (ML) techniques such as Gaussian process regression, random forest, neural networks, and support vector machine. The feature importance analysis results are presented in Figure 6 in the Appendix, while Figures 7 and 8 in the Appendix display the interaction effects using random forest. We found that our primary results were consistent and not affected by these alternative methods (Figure 9 in the Appendix).
Summary for Robustness Checks
Figures 4 to 8 serve as robustness checks, reinforcing the key findings presented in Figure 3. Specifically, these figures display feature importance rankings and interaction effects derived from alternative machine learning methods, including random forests and Gaussian process regression. Despite differences in their underlying algorithms, these methods consistently highlight the same key variables—TNFund, FCUM, INLFD, and FIFFD—as critical predictors of IPO outcomes. The consistency of these results across different techniques reinforces their robustness and reliability.
About additional interactions appearing in Figures 4 to 8 but not discussed in Figure 3, the criteria used to prioritize interactions in the primary analysis are different. The interactions highlighted in Figure 3 were selected based on their statistical significance, practical relevance, and alignment with the theoretical framework of the study. For example, the interaction between FCUM and INLFD was emphasized because it reveals how delayed investments can offset the benefits of high capital under management, which has important implications for investor behavior.
Finally, we summarize the role of Figures 4 to 8 in supporting the primary results. By showing that the key predictors and their interactions remain consistent across various methods and robustness checks, these figures provide strong evidence for the validity of our conclusions. We explicitly address this in the revised manuscript to ensure that readers understand the importance of these supplementary analyses. Additionally, we applied various machine learning techniques, including Gaussian process regression, random forests, neural networks, and support vector machines, to further validate our findings. The results of the feature importance analysis can be found in Figure 6 in the Appendix, while Figures 7 and 8 display interaction effects using random forests. These alternative methods confirm that our primary results are robust and unaffected by the choice of technique.
Discussion on Strategic Suggestions from SHAP
SHAP values provide a powerful tool for identifying the features that significantly influence IPO success, offering actionable insights for firms and investors alike. By analyzing these values, firms can pinpoint the factors most critical to enhancing their chances of going public. For example, our findings highlight TNFund (Total Number of Fund Investors) and FCUM (Firm Investor’s Capital Under Management) as the most impactful predictors of IPO success. To increase their IPO prospects, firms should prioritize strategies that attract a diverse pool of investors or collaborate with investors who manage substantial financial resources.
Additionally, SHAP helps uncover potential challenges by analyzing feature interactions. For instance, the observed interaction between FCUM and INLFD (Days Between the Last Investment and Founding Date of the Investee Company) reveals that firms with strong financial backing but extended periods without recent investment may face reduced IPO success rates. Armed with this knowledge, firms can adjust their strategies, such as conducting more frequent fundraising rounds or actively re-engaging past investors to maintain momentum and market confidence.
For investors, SHAP offers a systematic approach to identifying firms with high IPO potential by revealing the factors most strongly associated with success. This insight can inform investment decisions and enable investors to provide targeted support to portfolio companies, enhancing their readiness and prospects for a successful IPO.
A Summary
Our analysis identifies four key factors influencing IPO success—TNFund, FCUM, FIFFD, and INLFD—validated through XGBoost and SHAP, with robustness confirmed across multiple methods (e.g., random forests, neural networks) and data-balancing techniques. These findings align with existing theories and provide empirical support for our hypotheses:
These findings were robust across multiple machine learning methods, including XGBoost, random forests, and neural networks, and various data-balancing techniques, reinforcing their reliability. These results highlight the nuanced roles of investor diversity, financial resources, and investment timing, with interactions like FCUM-INLFD suggesting that strong backing is less effective without recent investment activity. Practically, firms should secure diverse investors early and maintain investment momentum, while investors should target firms with these characteristics to enhance IPO prospects.
Also, using SHAP we uncovered interaction effects, such as the relationship between FCUM and INLFD, where the positive impact of higher FCUM diminishes when the gap in investment (INLFD) is long, suggesting that strong financial backing may be undermined by a lack of recent investor interest. Additionally, TNFund amplifies the effect of early investment activity (FIFFD) on IPO success, indicating that early and diversified investor involvement enhances a firm’s credibility. Statistical results, including SHAP values and logit regression coefficients, confirm the dominant role of TNFund and FCUM in predicting IPO outcomes. Practically, these insights suggest that firms should secure a diverse pool of investors early and maintain active investment relationships, while investors should prioritize firms with strong fundamentals and consistent engagement. This study not only identifies key IPO success predictors but also makes a novel contribution by examining the interaction of these factors, filling a gap in the literature and providing a foundation for future research on dynamic relationships in financial decision-making.
The findings align closely with signaling theory, market efficiency, and alternative perspectives such as resource-based and agency theories, offering a comprehensive framework for interpreting IPO success dynamics.
Signaling theory: The positive impact of TNFund (Total Number of Fund Investors) on IPO success strongly supports signaling theory, as a higher number of investors reduces information asymmetry and signals firm quality to the market. Similarly, the positive association of FCUM (Firm Investor’s Capital Under Management) with IPO outcomes reflects how strong financial backing serves as a robust signal of firm stability and potential. However, the negative interaction between FCUM and INLFD (Days Between the Last Investment and Founding Date of the Investee Company) illustrates how prolonged periods without investment weaken this signal, potentially indicating stagnation or reduced market confidence. This interaction underscores the nuanced role of temporal signals in maintaining investor trust and market appeal.
Market efficiency: Findings related to FCUM and INLFD also align with market efficiency theory. The diminishing effect of FCUM with longer INLFD gaps suggests inefficiencies in how markets value firms with delayed or inconsistent investor engagement. While markets aim to reflect all available information, these inefficiencies highlight the importance of timely and consistent signals to ensure accurate valuation during IPO pricing. Additionally, TNFund’s amplification of early investment activity (FIFFD) supports the idea that diversified and early investor involvement enhances the market’s ability to assess a firm’s value.
Resource-based perspective: The role of FCUM in IPO success aligns with resource-based theory, emphasizing the strategic advantage provided by substantial financial resources. Early investments reflected in FIFFD support this theory, highlighting the value of investor confidence and resource allocation in the formative stages of a firm. Together, these factors underline the criticality of resource availability and strategic deployment in facilitating successful IPOs.
Agency theory and corporate governance: The interaction effects identified—such as TNFund enhancing the impact of FIFFD—suggest that diversified investor involvement reduces agency risks and bolsters the credibility of managerial decisions. A diverse and engaged investor base likely mitigates concerns about mismanagement, fostering greater trust in the firm’s governance and strategic direction.
Practically, these insights emphasize the importance of securing a broad and reputable investor base early in a firm’s lifecycle while maintaining consistent investment activity to sustain market confidence. This study also advances the literature by exploring dynamic interactions between these factors, providing a richer understanding of the mechanisms underpinning IPO success and offering a foundation for further research into multi-factor and temporal effects in financial decision-making.
Conclusion
This article explores the relationship between IPO and factors related to the history of investee and investor firms, as well as the interaction between these factors, using machine learning methods and SHAP. The main findings of our study highlight four critical determinants of IPO success: TNFund, FCUM, FIFFD, and INLFD. These factors underscore the importance of investor histories and their nuanced effects on IPO outcomes. Notably, we contribute to the literature by revealing interaction effects, such as the mitigating impact of high INLFD on the benefits of FCUM, emphasizing the complexity of how investment histories shape IPO prospects. By demonstrating the predictive power of historical investment factors, our study adds to signaling theory and resource-based perspectives in finance, and introduces SHAP as a novel tool for interpreting these interaction effects, offering a new methodology for balancing predictive accuracy with interpretability in financial research.
From a practical standpoint, our findings offer clear guidance for firms and investors aiming for IPO success. Firms should prioritize securing diverse and reputable investors early in their lifecycle (high TNFund), maintain consistent investment activity leading up to the IPO (low INLFD), and collaborate with investors possessing significant capital (high FCUM). For investors, the results emphasize the importance of nurturing active, ongoing relationships with investee firms to enhance their IPO potential. Policymakers could also benefit from these insights, as regulatory frameworks supporting transparency in venture capital investments, along with incentives for long-term investor involvement, could improve IPO success rates. While our study focuses on quantitative factors from a single financial database, future research could explore qualitative dimensions like managerial quality and investor reputation, as well as extend the analysis across different geographic regions to uncover variations in IPO determinants. Ultimately, our study sheds light on the complex interplay of factors influencing IPO success and offers both theoretical and practical insights that aim to support stakeholders in making informed decisions.
Footnotes
Appendix A
The section includes Tables and Figures which are not included in the main text.
Funding
The authors disclosed receipt of the following financial support for the research, authorship, and/or publication of this article: The authors received financial support for the publication of this article from the Distinguishing Academics of Shenzhen's “Pengcheng Peacock Plan”.
Declaration of Conflicting Interests
The authors declared no potential conflicts of interest with respect to the research, authorship, and/or publication of this article.
Data Availability Statement
The data used for this study were obtained from Thomson Reuters Eikon.