
Abstract
Green innovation has become one of the most effective ways to deal with ecological problems such as environmental pollution, global warming and resource depletion. A comprehensive and accurate understanding of regional differences and influencing factors of green innovation level is of great significance further to promote green innovation and to realize the harmonious coexistence between man and nature. This paper analyzes the regional differences of green innovation level in China from 2011 to 2020 by using GDI, Moran’s I, Getis-Ord Gi*, and other indices at provincial, urban agglomeration and prefecture-level city scales, and identifies with geographical detectors, the leading factors influencing the spatial differentiation of green innovation level as well as their interactions. The results show that from 2011 to 2020, the overall level of green innovation in China gradually improves and the regional differences gradually decrease, and that the smaller the scale, the greater the regional differences. Green innovation level increases with the increase of urban agglomeration level and the expansion of city scale. There are differences in the spatial structure features of green innovation level at different scales, the degree of spatial agglomeration decreases as the scale reduces. At provincial and prefecture-level city scale, areas of higher green innovation level are mainly located at the east side of Hu Line, while at the urban agglomeration scale, they are mainly national urban agglomerations such as Yangtze River Delta and Pearl River Delta, and regional urban agglomerations such as Ha Chang and Shandong Peninsula Urban Agglomeration. The leading factors influencing the spatial differentiation of green innovation level and their interactions vary with the different scales. At provincial and prefecture-level city scales, the core factors are venture capital level, quality of faculty and education level. On the scale of urban agglomeration, the core factors are venture capital level and economic level.
Plain language summary
This paper analyzes the regional differences of green innovation level in China from 2011 to 2020 by using GDI, Moran’s I, Getis-Ord Gi*, and other indices at provincial, urban agglomeration and prefecture-level city scales, and identifies with geographical detectors, the leading factors influencing the spatial differentiation of green innovation level as well as their interactions. The results show that from 2011 to 2020, the overall level of green innovation in China gradually improves and the regional differences gradually decrease, and that the smaller the scale, the greater the regional differences. Green innovation level increases with the increase of urban agglomeration level and the expansion of city scale. There are differences in the spatial structure features of green innovation level at different scales, the degree of spatial agglomeration decreases as the scale reduces. At provincial and prefecture-level city scale, areas of higher green innovation level are mainly located at the east side of Hu Line, while at the urban agglomeration scale, they are mainly national urban agglomerations such as Yangtze River Delta and Pearl River Delta, and regional urban agglomerations such as Ha Chang and Shandong Peninsula Urban Agglomeration. The leading factors influencing the spatial differentiation of green innovation level and their interactions vary with the different scales. At provincial and prefecture-level city scales, the core factors are venture capital level, quality of faculty and education level. On the scale of urban agglomeration, the core factors are venture capital level and economic level.
Keywords
Introduction
In recent years, along with the rapid socio-economic development, emerges global ecological problems such as environmental pollution, climate warming and resource depletion (M. Wang & Li, 2021). To tackle these challenges, countries around the world have launched their a green and low-carbon development model. In this context, green innovation has become one of the heated topics focused and discussed by scholars all over the world. Although researchers has not come to a unified definition of green innovation, a consensus has been reached that it refers to innovative behaviors that are conducive to resource conservation and environmental protection, and that it takes into account both novelty and value (X. Li, 2015; Schiederig et al., 2012). The outbreak of COVID-19 pandemic in 2019 once again raised the awareness of the importance of green innovation and development among mankind. China is both an advocate and a practitioner of green innovation. As early as 2005, President Xi put forward the conviction that “lucid waters and lush mountains are invaluable assets.” Reports to the 18th and 19th CPC National Congress both highlighted the need to “unswervingly implement a new concept of innovative, coordinated, green, open and shared development,” and the Fifth Plenary Session of the 19th CPC Central Committee further put forward the sustainable development philosophy of “promoting green development and cultivating-harmony between humans and nature.” Meanwhile, in China’s 14th Five-Year Plan “accelerating green and low-carbon development” is clearly listed as one of the important goals. It can be seen that promoting green innovation is particularly important to the harmony between man and nature, to the sustainable socio-economic development and to the realization of a better life for human beings. Therefore, firm grasp of the spatial-temporal pattern of China’s green innovation level and its dominant factors will help relevant government departments formulate targeted and constructive strategies and policies suiting local conditions, so as to improve green innovation level and reduce regional differences.
In the research on regional differences and influencing factors of green innovation, some scholars have discussed the spatio-temporal differentiation of green innovation efficiency in regions such as Guangdong-Hong Kong-Macau Greater Bay Area and Yangtze River Delta urban agglomeration (Bao et al., 2022; Dong et al., 2021). Some scholars analyzed the spatio-temporal differences and evolution characteristics of green innovation performance at the provincial level (C. Wang & Li, 2019). Some scholars have verified the influence of economic, innovation and institutional factors such as economic development, industrial structure, financial development, openness and environmental regulation on regional green innovation (Sun & Shen, 2021; Y. Xu & Liu, 2022). In terms of research methods, scholars mainly use multiple regression analysis, spatial econometric analysis and so on. It can be seen that scholars at home and abroad have discussed the regional differences and influencing factors of green innovation from different perspectives, and these research results are also rich, but there are still some deficiencies and worthy of in-depth discussion. First, the research perspective of regional differences in green innovation is mostly on a single scale, such as economic circle and urban agglomeration, and there is a lack of research on regional differences in different scales of provincial, urban agglomeration and prefecture-level cities. Second, the existing research on some factors affecting green innovation, have obtained contradictory research conclusions, how to understand the theoretical mechanism and boundary conditions behind these conclusions? Third, the analysis of the influencing factors mostly uses multiple regression, DID model and other empirical analysis methods, but ignores the region itself and the interaction of various factors. In order to fill the gaps in the existing research, this paper intends to use GDI, Moran’s I, Getis-Ord Gi* index to analyze the regional differences of green innovation from different scales such as provincial, urban agglomeration and prefecture-level cities, and use geographical detectors to explore the impact of various factors and interactions on the regional differentiation of green innovation, in order to provide decision-making reference for national and local governments to formulate relevant policies to promote the development of green innovation according to local conditions.
The innovation and contribution of this paper are as follows: first, we make a comparative analysis of the regional differences of green innovation from different scales, which expands the research perspective of green innovation. Second, we analyze the leading factors in the formation of the temporal and spatial pattern of green innovation, so as to provide decision-making reference for relevant government departments to formulate targeted policies to improve the level of green innovation. Third, we analyze the interaction of the factors that affect the regional differences of green innovation, in order to provide new ideas for further exploring the mechanism of driving factors of green innovation.
Literature Review and Theoretical Basis
In the research on regional differences of green innovation, existing studies agree that there are differences in time and space of green innovation. For example, Mingran (2021) uses the method of exploratory spatial data analysis to study the regional differences of green technology innovation efficiency at the provincial level. The results show that China’s provincial green innovation efficiency shows a significant spatial autocorrelation, and the spatial distribution shows an obvious non-random geographical agglomeration pattern. Long et al. (2020) uses panel unit root test and coefficient of variation to analyze the differences of green innovation efficiency in different regions of China. The results show that the convergence degree of green innovation efficiency in Northeast China is the highest, followed by the eastern, western and central regions. Bao et al. (2022) uses Theil index and Hurst index to analyze the temporal and spatial characteristics of green innovation efficiency in the Yangtze River Delta region. The results show that the urban green innovation efficiency in the Yangtze River Delta region increases and fluctuates back and forth, and the regional differences gradually decrease. J. Liu and An (2020) discussed the spatial pattern evolution characteristics of the green innovation efficiency of the tourism industry around the Bohai Sea by using the global spatial autocorrelation. The results show that there is a significant spatial positive correlation of the green innovation efficiency of the tourism industry around the Bohai Sea. And the spatial agglomeration characteristics are obvious.
In the research on the influencing factors of regional differences in green innovation, the existing research results are relatively rich, mainly discussing the influence of economic development factors, innovation environment factors and system-oriented factors. In terms of economic development factors, Liao and Li (2022) believe that promoting economic development and the development of secondary industry is conducive to promoting urban green innovation. B. Wang et al. (2020) believe that the level of economic development is the main factor restricting the imbalance of green innovation output. Ge et al. (2022) believe that industrial structure has a significant impact on the performance of green innovation. Other studies have shown that low-level industrial structure has a negative effect on green innovation (Peng et al., 2019). In terms of innovation environment, Zhang et al. (2022) believes that the degree of opening to the outside world has a different impact on the efficiency of regional green technology innovation. C. Liu et al. (2020) believes that the allocation efficiency of green financial resources plays a significant role in improving the efficiency of green innovation in high-tech industries. Dong et al. (2021) believe that scientific and technological innovation factors such as the degree of opening to the outside world and the level of financial development are the driving force of green innovation. In terms of system-oriented factors, Zhang et al. (2022) believes that the level of education can promote the efficiency of industrial green technology innovation. The study of Zheng and Zhang (2022) shows that there is a U-shaped relationship between environmental regulation and local green innovation efficiency. Bi et al. (2013) believe that the intensity of environmental regulation has a significant positive impact on the regional differences in the performance of green process innovation. Y. Xu and Liu (2022) believe that increasing the input of teachers and strengthening environmental regulation will improve the efficiency of regional green innovation. Other studies have shown that environmental regulation has no obvious effect on improving the efficiency of green innovation (Tian et al., 2021).
To sum up, the existing research on regional differences and influencing factors of green innovation is relatively rich, which provides a good basis for the study of this paper. However, there is still room for further study. The existing literature mainly uses Theil index, or coefficient of variation, or exploratory spatial data analysis to study the regional differences of green innovation, but seldom combines various methods together. The research perspective is also one of the scales of provincial, economic circle and urban agglomeration, and there is a lack of comparative analysis from different scales. The methods of multiple linear regression and spatial econometric analysis are often used to study the influencing factors, but the disadvantage is that the region itself and the interaction of various factors are ignored. In addition, there are some contradictory conclusions in the existing research results. Therefore, in order to solve the above problems, on the basis of existing research, this paper will use GDI (a comprehensive index to explore spatio-temporal differentiation), Moran’s I, Getis-Ord Gi* index to analyze the regional differences of green innovation, and make a comparative analysis of different scales; geographical detectors will be used to explore the impact of various factors and interactions of economic development, innovation environment and policy guidance on the regional differentiation of green innovation.
Research Design
Research Area
The research of this paper makes a comparative analysis from the three scales of provincial, urban agglomeration and prefecture-level cities. The provincial scale research area is 31 provinces and municipalities in China except Hong Kong, Macao and Taiwan. The study area of urban agglomeration scale is based on China’s urban agglomeration planning: focus on the construction of five major national urban agglomerations: the Yangtze River Delta, the Pearl River Delta, Beijing, Tianjin, Hebei, the Middle reaches of the Yangtze River and Chengdu and Chongqing; steadily build nine regional urban agglomerations in Ha Chang, Shandong Peninsula, The middle and south of Liaoning, West Coast of the Taiwan Strait, Guanzhong, Central Plains, Jianghuai, Beibu Gulf and the northern slope of Tianshan Mountain; and guide the cultivation of six local urban agglomerations in Hubao Eyu, Jinzhong, Ningxia along the Yellow River, Lanxi, Central Yunnan and Central Guizhou. The prefecture-level city scale research area is 337 prefecture-level cities in China. In addition, the following classification of cities of different sizes is based on the Circular of the State Council on adjusting the criteria for the Division of Urban size, cities are divided into five categories: super mega-cities (≥10 million), mega-cities (5–10 million), big cities (1–5 million), medium-sized cities (0.5–1 million), and small cities (≤0.5 million).
Research Methods
Global Differentiation Index
Coefficient of Variation (CV), Theil Index (T), Global Entropy Index (GE), and Atkinson Index (A) are several common indexes used to measure the difference between time and space of things (Zhao et al., 2020), Y. Wang et al. (2013) constructs the global differentiation index (GDI) on the basis of these four indexes. GDI maps the characteristics of these indices at the same time, and the result is more stable. Therefore, GDI is used to estimate the distribution of green patent applications in order to explore the regional differences of green innovation. The calculation formula and process of GDI are as follows.
Global differentiation index:

Among them, coefficient of variation:

Theil index:

Global entropy index (C = 0):

Atkinson index:

In the formula:
The weight
Data standardization:

Calculate the specific gravity of the j index value of the I year:

Calculate the information entropy of indicators:

Information redundancy:

Calculation of index weight:

In the formula:
Exploratory Spatial Data Analysis
Moran’s I in exploratory spatial data analysis is used to analyze the spatial autocorrelation and distribution of green innovation level. The hot and cold points of green innovation level are estimated by Getis-Ord Gi* index. The calculation formulas of Moran’s I and Getis-Ord Gi* are as follows.

In the formula,
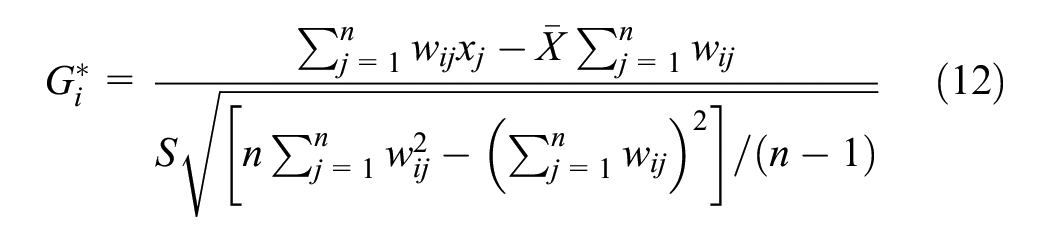
In the formula,
Geographical Detector
Geographical Detector is a new statistical method to analyze the spatial differentiation characteristics of things and reveal the driving factors behind them, this method has no linear hypothesis (J. Wang & Xu, 2017). Its core idea is based on the assumption that if an independent variable has an important influence on a dependent variable, then the spatial distribution of the independent variable and the dependent variable should be similar (J. F. Wang & Hu, 2012). Geographical detector includes four detectors: factor detection, interactive detection, risk detection, and ecological detection. This paper uses its factor detection to analyze the extent to which each factor (Xi) explains the spatial differentiation of green innovation level (Y), and uses interactive detection to analyze whether the interaction of various factors (Xi) will enhance or weaken the explanatory power of green innovation level (Y). Geographic detector q statistics, which can measure spatial differentiation, detect interpretation factors and analyze the interaction between variables, has been applied in many fields of natural and social sciences (J. F. Wang et al., 2010). The expression of q is as follows.

In the formula:
Green innovation is a complex system of multi-agent and multi-factor interaction, and its influencing factors not only come from the innovation subject, but also consider the innovation environment factors inside and outside the system. Therefore, on the basis of the above theory, combined with the characteristics of green innovation and existing research results, this paper selects eight indicators of economic development, scientific and technological innovation and policy guidance (Table 1) to analyze the leading factors affecting the regional differences of green innovation level (Y). Among them, economic factors are the basis of green innovation, scientific and technological factors are the driving force of green innovation, and institutional factors are the guarantee of green innovation.
Influencing Factors of Regional Differences in Green Innovation.

The level of regional green innovation (Y) is a dependent variable. This paper uses the number of regional green patent applications to measure the level of regional green innovation. The reasons are as follows: first, green patents most directly reflect the output of green technology innovation activities, with quantification and spillover inside and outside the industry, and compared with R&D investment, avoid overestimating the level of green innovation (Gu & Gao, 2022). Second, the number of patent applications is less affected by external factors such as the work efficiency of patent application institutions (X. Wang & Wang, 2021). Compared with the lag of patent authorization data, patent application data is more stable, reliable and timely. In addition, learn from the practices of Qi et al. (2018) and J. Xu and Cui (2020) to build the number of regional green patent applications. First, the patent application data of each province and prefecture-level city are obtained from the patent search database of the State intellectual property Office, and then it is matched with the “Green list of International Patent Classification” issued by the World intellectual property Organization (WIPO). Finally, the number of green patent applications of each province and prefecture-level city is calculated.
The eight factors of economic development, scientific and technological innovation and policy orientation are independent variables. Economic factors are characterized by economic development level (X1) and industrial structure (X2). Green innovation is matched with certain economic conditions, good economic output conditions provide more complete infrastructure, scientific and technological research and development conditions and efficient market trading system. B. Wang et al. (2020) believe that the level of economic development is the main factor restricting the imbalance of green innovation output. Drawing lessons from its research, this paper uses per capita GDP to measure the economic development level of provincial and prefecture-level cities. Economic environment is an important factor restricting the development of green innovation. Research shows that there is a close relationship between industrial structure and green innovation, and a reasonable industrial structure can promote the development of green innovation (Peng et al., 2019). Therefore, this study selects the ratio of the added value of the secondary industry to GDP to represent the industrial structure.
The factors of scientific and technological innovation are characterized by the level of opening to the outside world (X3), the level of financial development (X4) and the level of venture capital (X5). In an open economic environment, regional exchanges with the outside world help to introduce innovative factors such as foreign high-level technology, high-quality talents and FDI. Raising the level of opening to the outside world can make it easier for the region to obtain international spillover effects and improve its own innovation ability, but it may also lead to the entry of polluting industries into the region, thus becoming a “pollution paradise” (Z. Xu, 2016). In this paper, the ratio of total foreign investment to GDP is used to represent the opening level of provincial scale; in view of the availability of data of prefecture-level cities, the ratio of the number of foreign-invested enterprises to the number of industrial enterprises is used to express the opening level of prefectural-level cities. Improving the financial system can not only provide financial support for enterprise innovation and R&D activities, but also disperse the corresponding risks for investors and promote the rational allocation of innovation resources within the scope of the market. In fact, only the financial system matched with the real economic structure can effectively exert the above functions. In this paper, the proportion of loan balance of financial institutions to GDP is used to express the level of regional financial development. The entry of venture capital helps to alleviate the financial constraints of green innovation and promote the vitality of enterprise innovation, but it may also be limited to the pressure of return on investment and can not engage in green innovation activities for a long time. This paper uses venture capital events to measure the level of regional venture capital.
Policy-oriented factors are characterized by the level of education (X6), the strength of teachers (X7) and the intensity of environmental regulation (X8). The continuous improvement of innovation ability is an important driving force to support the steady improvement of the level of green innovation, and independent innovation within the region is one of the important factors to enhance innovation ability. Education, as an important source of human capital accumulation, is a major means to improve the ability of internal independent innovation, and is an indispensable part of the national independent innovation system (J. Li et al., 2017). The higher the education level of residents is, the stricter the requirements for green products and environmental quality are, the more they can force enterprises to carry out green innovation. In addition, teachers are also an important human capital for independent innovation within the region, providing high-end technical personnel support for regional green innovation R&D and achievement transformation activities. In this paper, the number of students in ordinary colleges and universities is used to measure the level of regional education, and the number of full-time teachers in ordinary colleges and universities is used to express the strength of teachers. The focus of debate on the impact of environmental regulation on green innovation is innovation compensation effect and compliance cost effect. Porter hypothesis holds that reasonable external environmental regulation can offset the cost of environmental regulation for a long time, thus achieving regional environmental and economic benefits at the same time, which is conducive to the promotion of green innovation (Porter & Linde, 1995). Follow cost effect holds that the increased governance cost of environmental regulation will crowd out innovation investment, which is not conducive to green innovation (Slater & Angel, 2000). In view of the availability of data, this paper uses the investment in industrial pollution control to measure the intensity of environmental regulation at the provincial scale, and the annual average concentration of fine particles to measure the intensity of environmental regulation at the prefecture-level city scale.
Data Source
This paper uses the green patent application data and corresponding impact factor data of provincial and prefecture-level cities in China from 2011 to 2020. The patent application data of provincial and prefecture-level cities come from the State intellectual property Office, and match the green patent data according to the “Green list of International Patent Classification” issued by the World intellectual property Organization (WIPO), so as to construct the green patent application data of provincial and prefecture-level cities. The data of provincial economic factors, innovation factors and institutional factors from 2011 to 2020 come from the China Statistical Yearbook and local statistical yearbooks from 2012 to 2021, while the data of prefecture-level cities’ economic factors, innovation factors and institutional factors come from the China Urban Statistical Yearbook. Among them, venture capital events come from the private recruitment database. In particular, in view of the incompleteness of the relevant data of Hong Kong, Macao and Taiwan, the study area does not include Hong Kong, Macao, and Taiwan.
Research Results and Analysis
Based on the above research methods and models, firstly, the regional differences in the time dimension of green innovation are analyzed. Then the spatial differentiation characteristics of green innovation level are analyzed, firstly by using Moran’s I to test the spatial autocorrelation and spatial distribution of green innovation level, the second is to draw the spatial distribution pattern of green innovation level by ArcGIS10.2, and the third is to identify the hot and cold areas of green innovation level with the help of Gi* index. Finally, the influencing factors of green innovation are analyzed, one is to detect the influence of each factor, and the other is to analyze the interaction between each factor. The specific results are analyzed below.
Regional Differences of Green Innovation in Time Dimension
Provincial Scale
The overall level of green innovation in China showed a steady growth trend from 2011 to 2020. The number of green patent applications increased from 83,647 in 2011 to 499,331 in 2020, with an average annual growth rate of 22.28% (Figure 1a). Among them, the growth rate in 2015 and 2016 was relatively high, reaching over 30%. The reason may be that the State Council issued “the opinions on accelerating the Construction of Ecological Civilization” in 2015, which has greatly promoted the development of green innovation in China. In 2016, the Ministry of Environmental Protection formulated “the National regulations for the Management of demonstration areas for the Construction of Ecological Civilization (for trial implementation),” which has greatly promoted the development of green innovation in China. This also illustrates the better implementation of national policies related to the promotion of ecological civilization in 2015 and 2016.
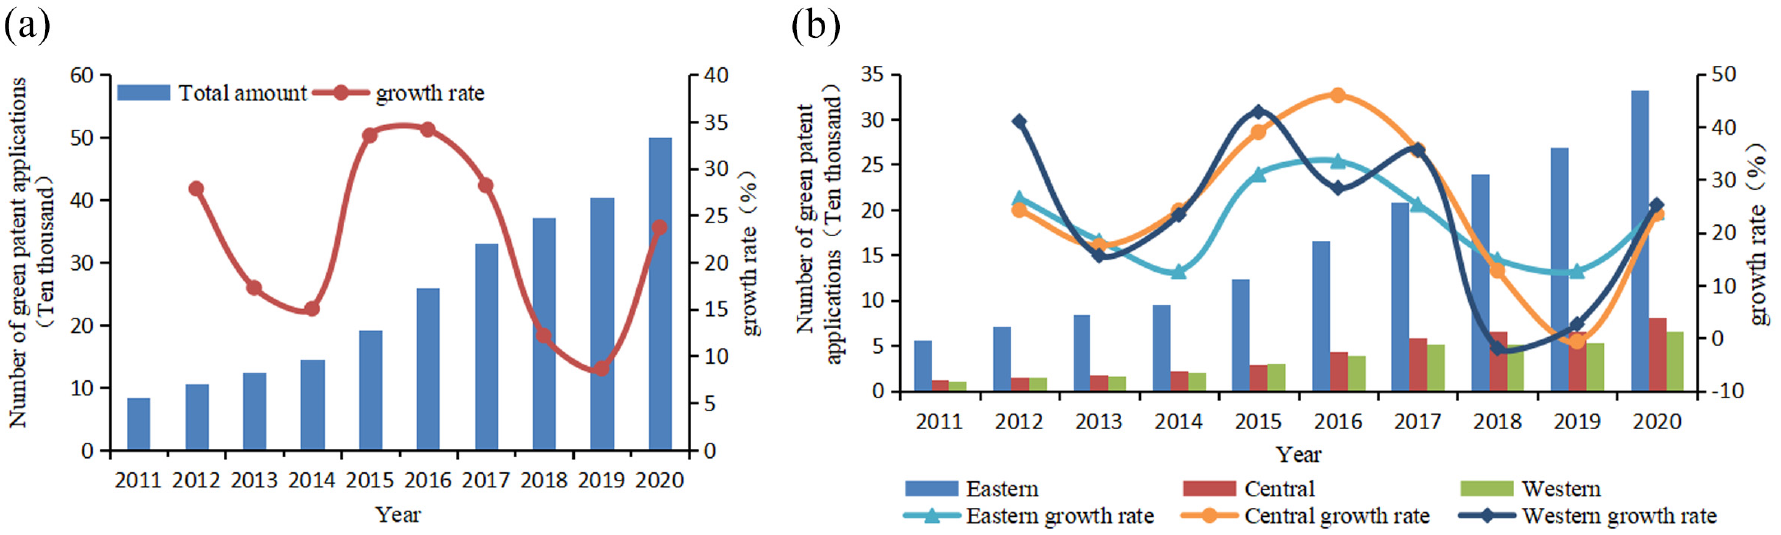
Variation trend of green innovation level in China: (a) the number of green patent applications and its growth rate in China and (b) the number and growth rate of green patent applications in Eastern, Central, and western provinces.
Specifically (Figure 1b), the overall level of green innovation in the eastern, central and western regions shows an increasing trend, in which the total amount of green patent applications in the eastern provinces is the most, while the total green patent applications in the central and western regions are similar, and less than 1/3 of those in the east. This also shows that the level of green innovation in the central and western regions is far lower than that in the eastern part. However, from the point of view of the growth rate, the development speed of green innovation in central China is the fastest, which increased by about 5.9 times from 2011 to 2020, while that in the east and west increased by 4.9 times and 5.2 times respectively. The reason may be that in 2012, “some opinions of the State Council on vigorously implementing the Strategy of promoting the rise of the Central region” and “the State Council’s reply on the 12th five-year Plan for the large-scale Development of the Western region” emphasizes the need to “strengthen environmental protection and ecological construction,” it has greatly promoted the level of green innovation and development in the central and western regions. However, due to the differences in the level of economic development, education and some historical reasons, there are still great regional differences in the level of green innovation among the eastern, central and western regions.
From 2011 to 2020, the GDI of green innovation level showed a decreasing trend, with a decline of 17%, indicating that the regional difference in green innovation level is gradually decreasing (Figure 2). Among them, the GDI of green innovation level in western provinces is the most obvious, reaching 42.4%, that is, the regional difference of green innovation level in western provinces is significantly reduced. On the other hand, the change of GDI in the eastern and central provinces is relatively small, fluctuating between 0.25 and 0.3, between 0.1 and 0.15 respectively, with an overall decline of only 2.8% and 7.4%, respectively, indicating that the regional difference in the level of green innovation between the eastern and central regions is also narrowing, but not as significantly as in the west. The possible reason is that in recent years, the country has been practising the new development concept and strengthening the management and control of environmental policies. While at the same time, the country is also implementing the strategy of the rise of central China and the large-scale development of the western region, thus vigorously promoting the balanced development of green innovation and gradually reduced its regional differences, especially in the western region.

Change trend of GDI of green innovation level in China.
Urban Agglomeration Scale
The average number of green patent applications in national urban agglomeration reached 68,000 in 2020, while the average number of green patent applications in regional and local urban agglomerations was only 14,000 and 3,000 respectively, indicating that the level of green innovation decreased with the decrease of the level of urban agglomeration (Figure 3a). However, GDI shows the phenomenon of polarization. The value of GDI of green innovation level of regional urban agglomeration is the largest, while that of national and local urban agglomeration is relatively small, indicating that the regional difference of green innovation level of regional urban agglomeration is larger than that of national and local urban agglomeration. The reason may be that there are great differences in the level of economic development, scientific and technological financial environment and educational resources among regional urban agglomerations, resulting in great differences in the level of green innovation as well.

Urban agglomeration scale green innovation and its GDI: (a) green patent application and GDI in different grades of urban agglomeration and (b) green patent applications and GDI in each urban agglomeration.
Further analysis reveals that in the national urban agglomeration, the number of green patent applications in the Yangtze River Delta and Pearl River Delta is greater than the average, and the number of green patent applications in the Yangtze River Delta alone accounts for 29%. Among the regional urban agglomerations, the Central Plains urban agglomeration has the largest number of green patent applications, followed by Shandong Peninsula and the west bank of the Taiwan Strait. Jianghuai is slightly larger than the average, and the rest are less than the average. Among the local urban agglomerations, the number of green patent applications in central Yunnan urban agglomeration is the most, the urban agglomeration in central Guizhou and Lanxi is slightly above the average, and the rest are below the average. It can be seen that the larger the scale and the higher the level of urban agglomeration, the higher the level of green innovation, which may be due to the differences in the level of economic development, openness to the outside world, financial development and education among urban agglomerations. For example, the Yangtze River Delta, which belongs to the national urban agglomeration, is one of the regions with the highest level of economic development, the largest degree of opening to the outside world and the most active financial and technological activities, and its level of green innovation is also far higher than that of other urban agglomerations.
Prefecture-Level City Scale
The average value of green patent applications at the prefecture-level city scale in 2020 is 1,482. The level of green innovation in cities of different sizes decreases with the decrease of city size (Figure 4a), among which only the number of green patent applications in super mega-cities and mega-cities is higher than the national average, and the rest are lower than the national average. The possible reason is that resources and policies will favor large-scale cities, resulting in a higher level of economic development, a better innovation environment and a higher level of green innovation. On the other hand, the regional difference in the level of green innovation is polarized, that is, the larger the size and the smaller the size of the city, the smaller the regional difference, and the greater the regional difference of the middle scale (Figure 4b). The reason is that the larger and smaller cities are, the level of economic development, the environment of scientific and technological innovation and the orientation of policy and system are relatively similar, so the difference in the level of green innovation is relatively small. Whereas the number of cities in the middle scale is larger. The level of economic development, scientific and technological innovation environment and policy and institutional orientations differ more, and therefore the differences in their levels of green innovation are larger.

Green innovation and its GDI at prefecture-level cities scale: (a) the number and average of green patent applications in cities of different sizes and (b) green innovative of GDI of cities of different sizes.
By comparing the regional differences of green innovation levels on different scales, it is found that the provincial scale green innovation level shows a steady growth trend from 2011 to 2020, and its regional differences are gradually decreasing. In 2020, the level of green innovation on the scale of urban agglomeration decreases with the decrease of the grade of urban agglomeration, and the regional difference is polarized. The difference of regional urban agglomeration is the biggest, and the difference between national and local urban agglomeration is small. The level of green innovation at prefecture-level city scale in 2020 decreases with the decrease of city size, and its regional difference is polarized. The larger and smaller the city is, the smaller the regional difference is, and the greater the regional difference is among the cities of middle scale. This indicates that the changing trend of regional differences in the level of green innovation at different scales varies.
Regional Differences of Green Innovation in Spatial Dimension
Provincial Scale
In order to explore the structural characteristics of the spatial distribution of green innovation in provinces in China, the data of green innovation in 2011, 2016, and 2020 are selected to make a comparative analysis of evolution, and an overview map of the spatial distribution of green innovation is drawn (Figure 5). From the transformation of the level of green innovation in various provinces, the higher-level and high-level areas of green innovation increased significantly from 2011 to 2016, while the low-level areas decreased significantly. A total of 51.6% of the provinces transferred to relatively high-level areas. Among them, the level of green innovation in most provinces increased step by step, and a few showed a leaping increase, indicating that the level of green innovation is gradually improving. From 2016 to 2020, the areas above the medium level increased significantly, of which the high level areas increased by 42.9%, while the below-middle level areas decreased by 46.2%, indicating that the level of green innovation has been greatly improved, and it is still dominated by successive transformation. In terms of the spatial distribution of the level of green innovation by province and region, the areas below the middle level are mainly distributed in the northwest, and the areas above the medium level are mainly distributed in the southeast coastal areas.
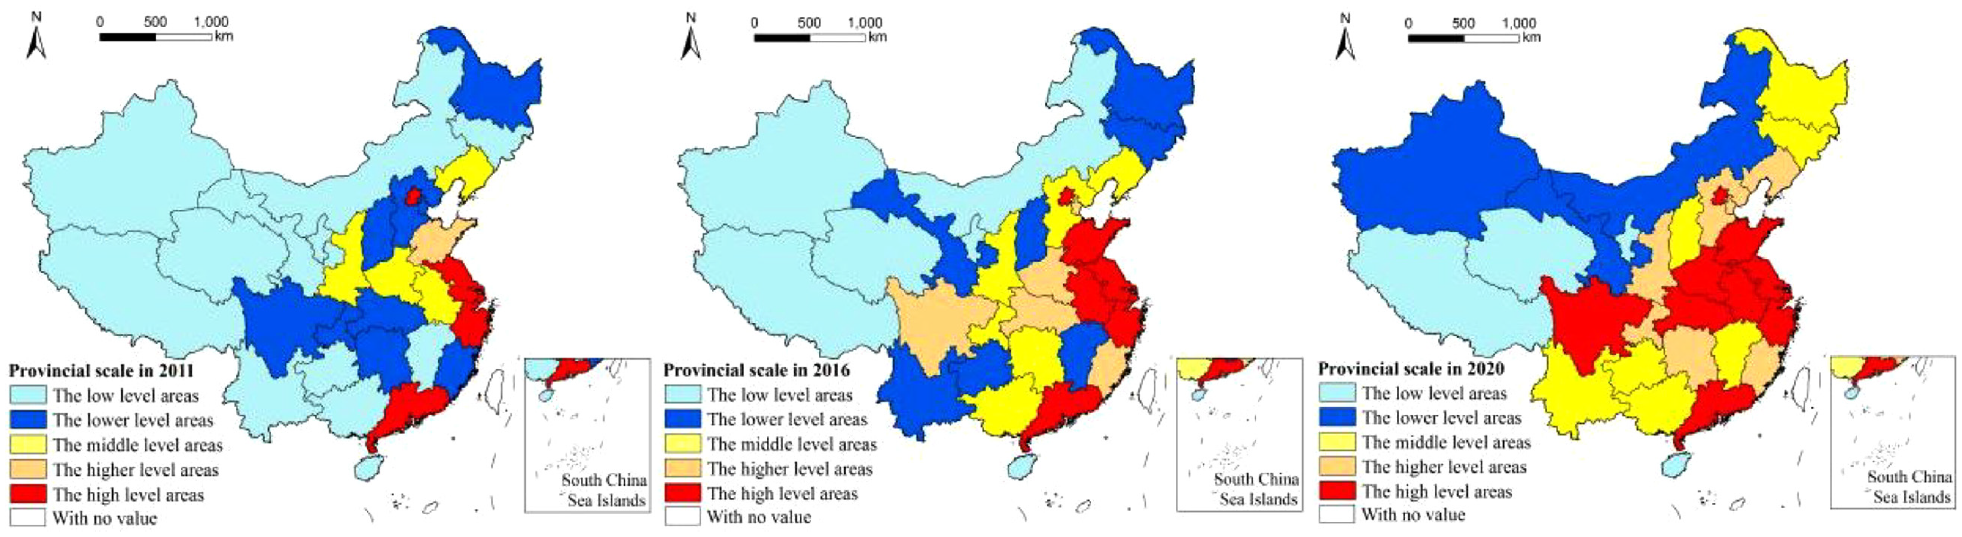
Changes of spatial distribution of green innovation.
Specifically, from 2011 to 2016, the low level area was gradually narrowing to the west of the Hu line and was characterized by a continuous distribution, while the lower level area showed sporadic distribution characteristics; the above medium level area gradually expanded from the eastern coastal area to the central region, the middle and high level areas showed zonal distribution characteristics, and the higher level areas showed sporadic distribution characteristics. The level of green innovation from 2016 to 2020 takes the Hu line as the dividing line to form an obvious spatial distribution pattern, where the sub-middle level area is mainly located on its western side and is characterized by a contiguous distribution. And the middle and above horizontal areas are located in the east. The higher and high level areas show the characteristics of circle structure along the middle and lower reaches of the Yangtze River, and the middle level areas show sporadic distribution characteristics.
Generally speaking, from 2011 to 2020, the level of green innovation showed a spatial distribution pattern of decreasing successively from east to west, and gradually evolved into a spatial distribution pattern with the Hu line as the dividing line, that is, the low and lower level areas gradually transformed into relatively higher level areas, and its scope gradually narrowed to the west of the Hu line, while the above medium level areas were mainly distributed to the east of the Hu line. It shows that the level of green innovation in the provinces of the country is gradually improving, but its regional differences still exist.
From the spatial correlation test results (Table 2), the Moran’s I values of 2011, 2016, and 2020 are all greater than zero, p values are all less than .05. It shows that there is a positive spatial autocorrelation in the level of green innovation at the provincial scale. The Z value decreases in fluctuating changes, indicating a weakening of the spatial clustering of green innovation levels. According to the results of cold and hot spot analysis (Figure 6), the spatial relationship of green innovation level changed greatly from 2011 to 2016, with Anhui transforming from a sub-hot spot zone to a hot spot zone, Liaoning transforming from a hot spot zone to a sub-hot spot zone, Guangxi transforming from a sub-cold spot zone to a sub-hot spot zone, Shaanxi transforming from a sub-hot spot zone to a sub-cold spot zone, Guizhou transforming from a cold spot zone to a sub-cold spot zone, and Jilin transforming from a sub-cold spot zone to a cold spot zone, with no change in other provinces and regions. The spatial relationship of green innovation level changed little from 2016 to 2020, with Hebei and Shaanxi transforming from sub-cold spot zone to sub-hot spot zone, Liaoning and Guangxi transforming from sub-hot spot zone to sub-cold spot zone, with no change in other provinces and regions. Generally speaking, the phenomenon of partial transformation between the hot and cold areas of green innovation level from 2011 to 2020, but the overall change is not significant, indicating that the phenomenon of spatial agglomeration of green innovation still exists. The spatial pattern tends to be stable gradually, in which the eastern coastal areas of Beijing, Shandong, Jiangsu, Shanghai, Zhejiang, Guangdong are stable hot spots, while most western areas such as Inner Mongolia, Ningxia, Gansu, Qinghai, Xinjiang, Tibet are stable cold spots, that is, the pattern that the level of green innovation decreases gradually from east to west is gradually obvious.
Spatial Auto-Correlation Test Results of Green Innovation.

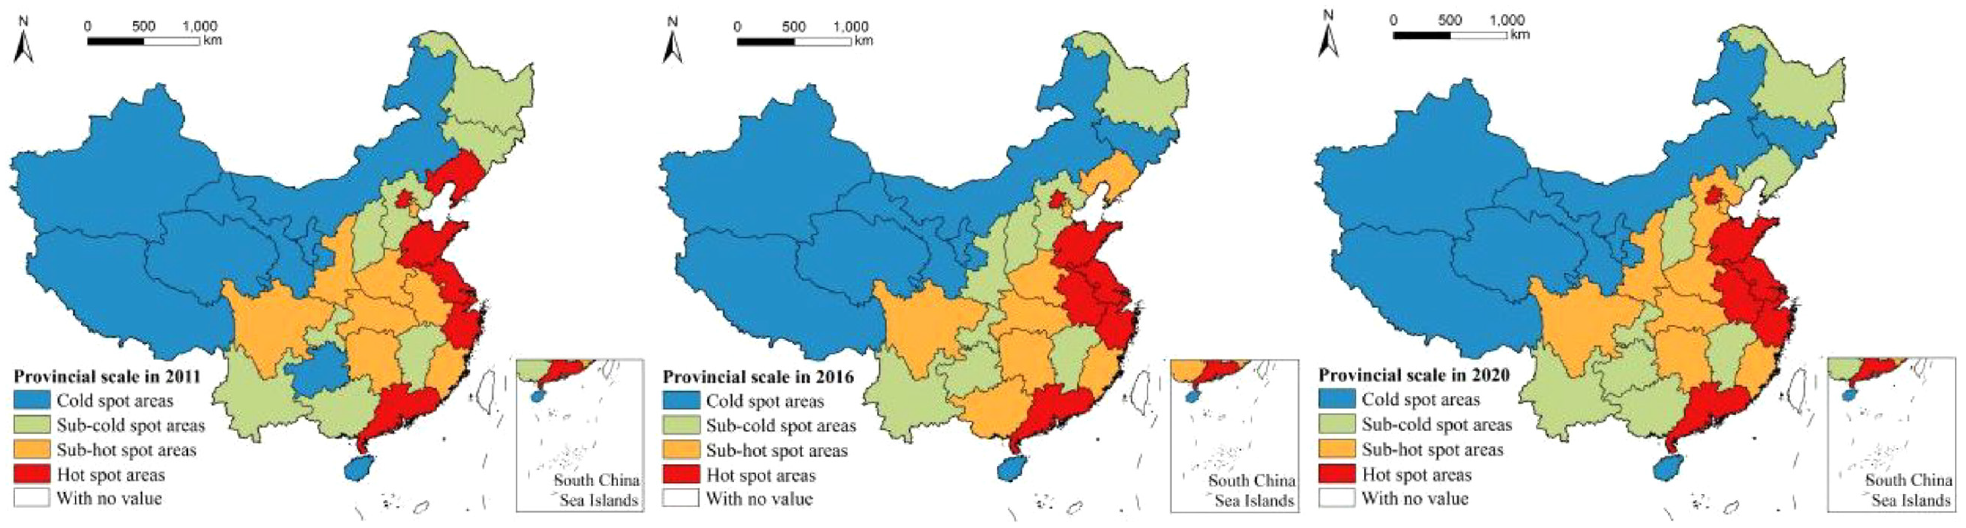
Distribution changes of cold hot spots of green innovation.
Urban Agglomeration Scale
In order to explore the spatial structure characteristics of green innovation level at a smaller scale, a general map of its spatial distribution was drawn based on the green innovation data of 337 prefecture-level cities in 2020. From the perspective of urban agglomeration (Figure 7a), the higher-level areas of green innovation are mainly distributed in the Yangtze River Delta, Pearl River Delta, Beijing-Tianjin-Hebei, Chengdu, and Chongqing, as well as the urban agglomeration of Hachang, Shandong Peninsula and the west coast of the Taiwan Strait. Specifically, the “core-edge” structure of the green innovation level of each urban agglomeration is relatively obvious, the high and higher level are mainly distributed in the central cities of each urban agglomeration, and the low and lower level areas are mainly distributed in the marginal cities of each urban agglomeration. From the spatial correlation test results (Table 2), the Moran’s I value is greater than zero, and the p value is less than .01, indicating that there is a significant positive spatial autocorrelation in the level of green innovation on the scale of urban agglomeration.
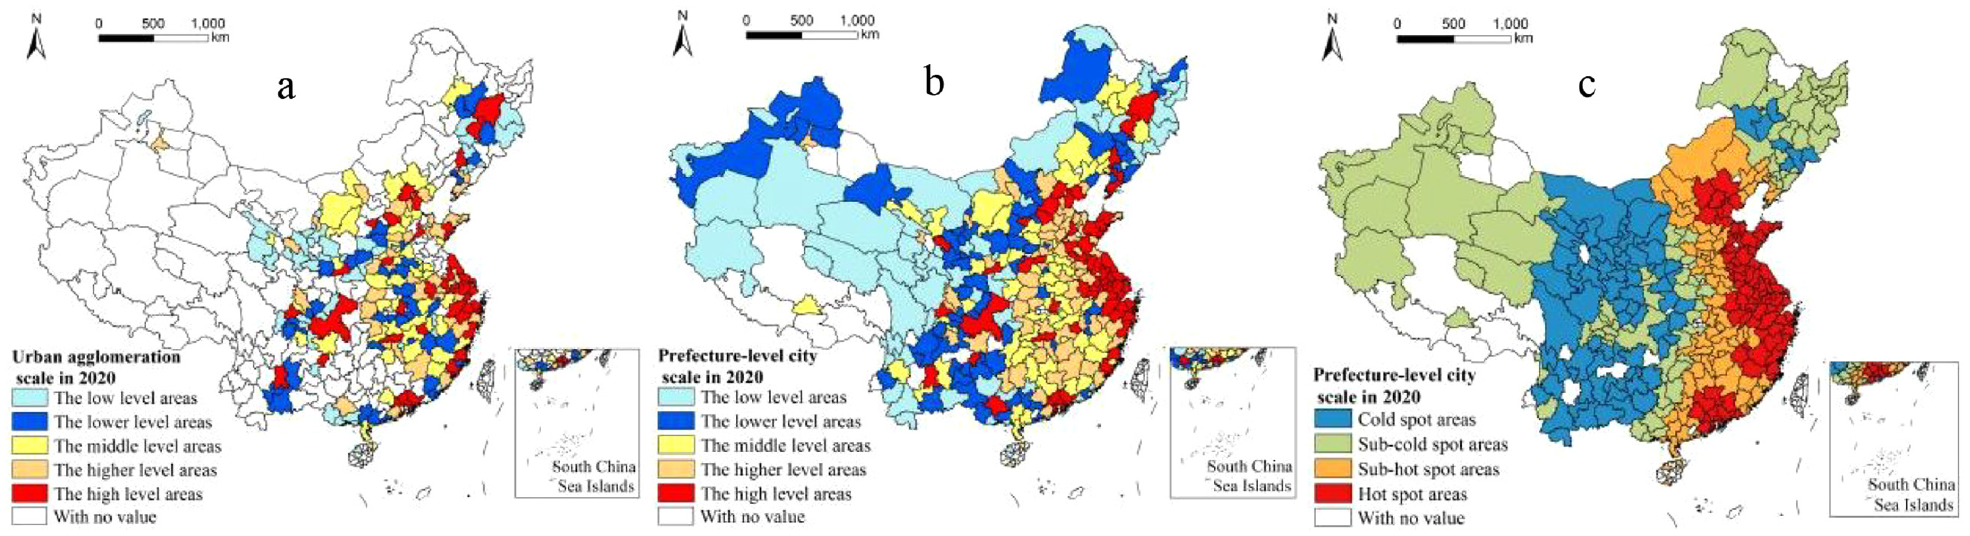
Spatial distribution of green innovation in prefecture-level units: (a) spatial distribution of green innovation in urban agglomerations, (b) spatial distribution of green innovation in prefecture-level cities, and (c) distribution of cold-hot spots of green innovation in prefecture-level cities.
Prefecture-Level City Scale
At the scale of prefecture-level cities (Figure 7b), the level of green innovation forms a spatial pattern with the Hu line as the dividing line, that is, the below-middle level area is mainly located in its west side, and the middle and above level area is mainly located in its east side. Specifically, the high-level areas are concentrated in the eastern coastal and provincial capital cities, the higher and medium-level areas are concentrated in the central region and the surrounding cities of the provincial capital, and the lower and low-level areas are concentrated in the western cities. From the spatial correlation test results (Table 2), the Moran’s I value is greater than zero, and the p value is less than .01, indicating that there is a significant positive spatial autocorrelation in the level of green innovation at the prefecture-level city scale. According to the results of hot spot analysis (Figure 7c), the hot spots are mainly concentrated in the Yangtze River Delta, Pearl River Delta, Beijing-Tianjin-Hebei, and Shandong Peninsula urban agglomerations. The cold spots are mainly concentrated in Guanzhong, Lanxi, Ningxia along the Yellow River, Beibu Gulf and central Guizhou, and the distribution of sub-hot spots and sub-cold spots is scattered.
In general, the spatial structure characteristics of green innovation level differs between scales. On the provincial and prefecture-level city scale, the higher level areas of green innovation are mainly located in the east of Hu line. On the scale of urban agglomeration, the higher level areas are mainly distributed in the Yangtze River Delta, Pearl River Delta, Beijing-Tianjin-Hebei, Chengdu, and Chongqing, as well as the urban agglomerations of Hachang, Shandong Peninsula and the west coast of the Taiwan Strait. The Moran’s I value of each scale is greater than zero, which means that there is a significant positive spatial autocorrelation of green innovation level in each scale, and the Moran’s I value of prefecture-level city scale is the smallest, indicating that the smaller the scale is, the smaller the spatial agglomeration degree of green innovation level is.
Influencing Factors of Regional Differences in Green Innovation
Provincial Scale
In order to explore the impact of the above factors on the regional differences of green innovation at the provincial scale, the relevant data of 2011, 2016, and 2020 are selected for comparative analysis. From the results of factor detection (Table 3), the level of venture capital, the strength of faculty and the level of education have great influence on the regional differences of green innovation, and the influence is increasing, and they all pass the significance test at the same time. It shows that these three factors are important factors in promoting the increasing level of green innovation. The level of economic development also has a certain impact on the temporal and spatial pattern of green innovation, but its influence is gradually weakening; although the influence of the level of opening to the outside world tends to increase, it only passes the significance test in 2016, indicating that its impact on green innovation is unstable; the influence of industrial structure, financial development level and environmental regulation intensity do not pass the significance test, indicating that its impact on green innovation is not significant. Specifically, in 2011, the level of venture capital, economic development, teachers and education are the leading factors affecting the spatial differentiation of green innovation; in 2016, the level of venture capital, economic development, education, opening to the outside world and teachers are the leading factors affecting the spatial differentiation of green innovation; in 2020, the level of venture capital, teachers and education are the leading factors affecting the spatial differentiation of green innovation. Generally speaking, the level of venture capital and the strength of teachers have a significant impact on the spatial differentiation of green innovation.
Influence of Impact Factors at Different Scales on Green Innovation.
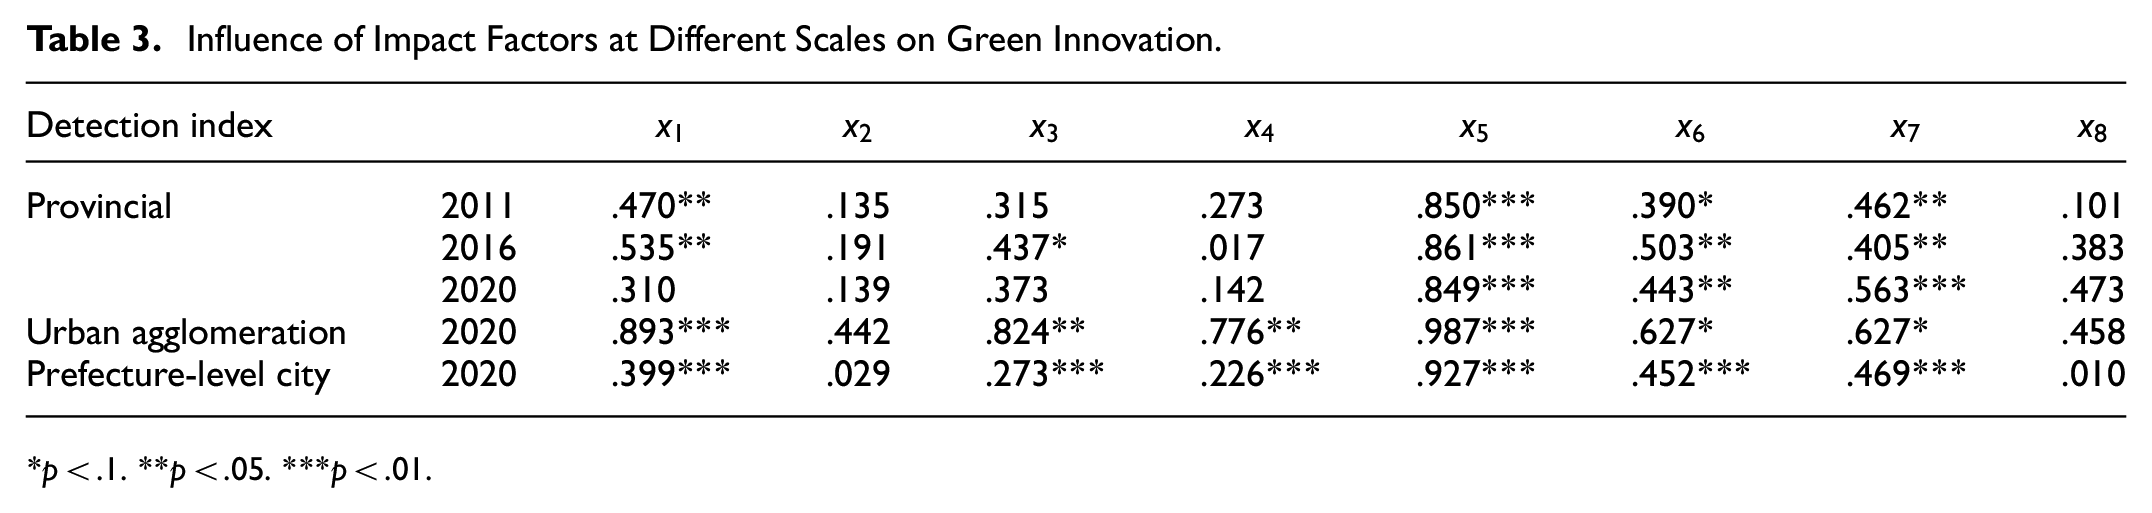
p < .1. **p < .05. ***p < .01.
From the results of interactive detection (Table 4), the interaction of various factors on green innovation shows two modes: two-factor enhancement and non-linear enhancement. Among them, the interaction between the level of economic development and the level of opening to the outside world and the intensity of environmental regulation, the interaction between industrial structure and educational level and the intensity of environmental regulation, the interaction between the level of opening to the outside world and the level of financial development, the interaction between venture capital and teachers, and the influence of the interaction between education and teachers on green innovation is on the rise. The interaction between financial development level and venture capital level has a decreasing influence on green innovation, and the interaction of other factors show fluctuating changes. Specifically, the interaction of each factor accounts for half of each other in 2011 and 2016. Among them, the interaction between financial development level and education level is the strongest in 2011, and the interaction between venture capital level and education level is the strongest in 2016. The interaction of various factors is mainly nonlinear enhancement in 2020, among which the interaction between venture capital level and teachers is the strongest. Overall, the interaction between the level of venture capital, faculty strength and various factors has a relatively significant impact on the spatial differentiation of green innovation.
Interaction of Impact Factors at Different Scales.

Urban Agglomeration Scale
In order to explore the impact of various factors on the regional differences of green innovation at a smaller scale, the influence of various factors and interactions on green innovation is analyzed based on the relevant data of prefecture-level cities in 2020. From the scale of urban agglomeration, the results of factor analysis show (Table 3) that the influence values of venture capital level, economic development level, opening up level and financial development level on the spatial differentiation of green innovation level are all above .7, with strong influence, among which the influence of venture capital level and economic development level is the most significant, showing that the level of venture capital and economic development are the leading factors to promote the level of green innovation in urban agglomeration. The influence values of education level and teacher strength are both .627, which are slightly weaker, but both pass the significance test of .1, indicating that education level and teacher strength are the secondary factors affecting the improvement of urban agglomeration green innovation level; while the influence of industrial structure and environmental regulation intensity do not pass the significance test, indicating that they have no significant impact on the improvement of urban agglomeration green innovation level.
The results of interaction analysis show that the interaction of all factors on green innovation is a two-factor enhancement effect (Table 4). Among them, the interaction between venture capital level, economic development level and other factors has the most obvious influence on the level of green innovation, and the interaction between venture capital level and environmental regulation intensity, education level and teachers is the strongest. The interaction between education level and teachers is the weakest. It can be seen that the interaction between the level of venture capital and the intensity of environmental regulation, education level and teachers has a significant impact on the spatial differentiation of green innovation level in urban agglomeration.
Prefecture-Level City Scale
At the scale of prefecture-level cities, the factor detection results show (Table 3), the influence of the level of venture capital, teachers, education, economic development, opening to the outside world and financial development on the spatial differentiation of green innovation level has passed the significance test of .01, among which the influence of venture capital level is the greatest, followed by teachers and education level. It shows that the level of venture capital, teachers and education are the leading factors to promote the level of green innovation at the prefecture-level city scale. While the level of economic development, the level of opening to the outside world and the level of financial development are also important factors to promote the level of green innovation at the prefecture-level city scale. The influence of industrial structure and environmental regulation intensity on the prefecture-level city scale failed the significance test, indicating that it has no significant impact on the enhancement of the level of green innovation. The results of interactive detection show that the interaction of various factors is mainly nonlinear enhancement (Table 4). The interactions between venture capital level and faculty strength with other factors have a more pronounced effect on the spatial differentiation of green innovation level. Among them, the interaction between the level of venture capital and the intensity of environmental regulation is the strongest, while the interaction between industrial structure and the intensity of environmental regulation is the weakest, showing that the interaction between the level of venture capital and the intensity of environmental regulation has an important impact on the spatial structure of green innovation level at the prefecture-level city scale.
By comparing the relationship between the factors and the level of green innovation on different scales, it is found that, first, the dominant factors affecting the spatial differentiation of the level of green innovation differ at different scales. The core factors on the provincial and prefecture-level city scale are the level of venture capital, the strength of teachers and the level of education, while the key factors on the scale of urban agglomeration are the level of venture capital and the level of economic development. Second, the influence of the interaction of various factors on the spatial differentiation of green innovation level varies at different scales. The interaction of venture capital level, teachers and various factors has a significant impact on the spatial differentiation of green innovation on the provincial and prefecture-level city scale, among which the interaction between financial development level and education level is the strongest at the provincial scale. The interaction between the level of venture capital and the intensity of environmental regulation is the strongest on the prefecture-level city scale. On the scale of urban agglomeration, the interaction of venture capital level, economic development level and other factors has the most obvious impact on the level of green innovation, among which the interaction between venture capital level and the intensity of environmental regulation, education level and teachers is the strongest. Furthermore, it is worth noting that neither industrial structure nor the intensity of environmental regulation alone has a significant impact on the improvement of the level of green innovation at all scales, but the interaction with other factors may have an important impact on the spatial structure of the level of green innovation.
Research Conclusion and Discussion
Research Conclusion
Starting from the different scales of provincial, urban agglomeration and prefecture-level cities, this paper uses GDI, Moran’s I and Getis-Ord Gi* to analyze the regional differences of green innovation level in China from 2011 to 2020, and uses geographic detector to identify the leading factors affecting the spatial differentiation of green innovation level and the interaction of various factors. The specific research conclusions are as follows.
(1) From 2011 to 2020, the level of green innovation in China gradually increases, and the regional differences gradually decreases, and the smaller the scale, the greater the regional differences. The level of green innovation increases with urban agglomeration rank and with city size, while the regional differences are polarized at both urban agglomeration and prefecture-level city scales. That is, the higher the level, the larger the scale, and the lower the level, the smaller the scale, the smaller the regional difference is, and the greater the regional difference in the middle level is. Local governments should, while implementing the overall strategy of national green and low-carbon development, formulate matching policies and guidance to promote the development of green innovation in accordance with the level of local economic development, the level of venture capital, the level of education and the strength of teachers, so as to truly realize the harmonious symbiosis between man and nature.
(2) There are differences in the spatial structure characteristics of green innovation level at different scales, but all have significant positive spatial autocorrelation, and the smaller the scale is, the smaller the spatial agglomeration degree of green innovation level is. The higher level areas of green innovation in provincial and prefecture-level cities are mainly located in the east of Hu line. The higher level areas of urban agglomeration are mainly distributed in the Yangtze River Delta and Pearl River Delta, as well as in urban agglomeration such as Hachang and Shandong Peninsula, and the characteristics of “core-edge” structure are obvious, with the high and higher levels mainly distributed in the central cities of each urban agglomeration, while the low and lower level areas mainly distributed in the marginal cities of each urban agglomeration.
(3) The leading factors affecting the spatial differentiation of green innovation level and the interaction of various factors vary at different scales. The core factors on the provincial and prefecture-level city scale are the level of venture capital, the strength of teachers and the level of education. Among them, the interaction between venture capital level, teachers and other factors is more significant. The core factors on the scale of urban agglomeration are the level of venture capital and economic development, and the interaction between these two factors and other factors is relatively significant. So local governments and enterprises should be good at making use of local advantages and characteristic resources to attract venture capital projects, and promote the development of venture capital; at the same time, they should enrich teachers, vigorously develop education, thereby promoting the development of green innovation. Furthermore, it is worth noting that neither industrial structure nor the intensity of environmental regulation alone have a significant impact on the improvement of the level of green innovation at all scales, but the interaction with other factors may have an important impact on the spatial structure of the level of green innovation. Therefore, local governments should formulate environmental policies that match the level of local economic development and the environment of scientific and technological innovation, so as to give full play to the interaction between environmental policies and other factors in promoting the level of green innovation.
Discussion
This paper uses GDI, Moran’s I, Getis-Ord Gi* and geographic detector to study the regional differences and influencing factors of green innovation, which expands the research perspective of green innovation and enriches the research content of green innovation. However, the research of this paper still has some shortcomings and is worthy of further improvement in the future.
(1) This paper measures the level of regional green innovation by the number of green patent applications, only considering the dimension of green innovation output, and only involving one aspect of this dimension. Regional green innovation is not only green patented invention, but also includes green innovation investment, management and service. In addition, this paper takes the number of green patent applications as the measure of the level of green innovation, although it pays attention to the early investment of green innovation, but does not consider the actual output of green innovation-the amount of green patent authorization. Therefore, the future research needs to comprehensively consider the number of green patent applications, the amount of authorization, and the ratio of the two.
(2) By using geographical detector, this paper analyzes the leading factors and the interaction of various factors affecting the regional differences of green innovation level from three aspects: economic development, innovation environment and policy guidance. Although it avoids the multiple collinearity and other problems that may be caused by conventional linear regression. However, at present, the number of influencing factors considered in various aspects is less, and green innovation itself is a more complex system, and its regional differences should also be the result of the comprehensive action of many factors. Therefore, the future research needs to bring more aspects and more factors into the analysis framework of the influencing factors of regional differences in green innovation.
Footnotes
Acknowledgements
I would like to thank my senior brother Bingsheng Zhu for his help in the translation of this article. I would like to thank Beiquan Chang and Yuzhong Lu for their suggestions on the revision of the paper. This work is supported by the Youth Foundation for Humanities and Social Sciences Research of the Ministry of Education in 2023 (Grant No. 23YJC630128).
Authors’ Contributions
Meng Li: Conceptualization; Writing—Original Draft; Writing—Review and Editing. Zengrui Tian: Conceptualization; Supervision. Qian Liu: Writing—Review and Editing. Xinru Li: Supervision.
Declaration of Conflicting Interests
The author(s) declared no potential conflicts of interest with respect to the research, authorship, and/or publication of this article.
Funding
The author(s) disclosed receipt of the following financial support for the research, authorship, and/or publication of this article: Youth Foundation for Humanities and Social Sciences Research of the Ministry of Education in 2023 (Grant No. 23YJC630128).
Data Availability Statement
The data supporting the conclusions of this study came from public and third-party databases. The patent application data are openly available in the State Intellectual Property Office, at https://tysf.cponline.cnipa.gov.cn/am/#/user/login. The factor data are openly available in China Statistical Yearbook and local statistical yearbooks, at https://www.stats.gov.cn/sj/. The venture capital events are available from the private recruitment database, at ![]() ; Restrictions apply to the availability of these data, which were used under licence for this study.
; Restrictions apply to the availability of these data, which were used under licence for this study.