
Abstract
In the digital age, the role of information technology (IT) management in organizations is fundamentally changing, especially in aligning business and IT. This study examines the relationship between organizational culture and business-IT alignment. It juxtaposes two four-component models in a novel way and presents a sound methodology for dealing with multiplicative ipsative rating scales of a questionnaire. Such measures have in common that the items’ alternatives relate to each other or the whole and need corresponding compositional data analysis. Linear regression and the resulting log-ratio coefficients reveal a culture/alignment combination of hierarchy with service- and adhocracy with investment orientation. This study claims to be one of the first papers to successfully employ the established compositional methodology on a composition-to-composition model in IT management research.
Plain language summary
Purpose—This paper examines the relationship between organizational culture and business-IT alignment moderated by digitalization based on established models from IT and management research. Methodology—Ipsative data from 450 respondents of an online questionnaire were analyzed using compositional data analysis and linear regression. Findings—The results show that culture and alignment are interrelated. Hierarchy and adhocracy culture types in IT are paired with the alignment performance criteria of a service center and an investment center; digitalization moderates and amplifies the effects. Research limitations/implications—This study compares two four-component models in a novel way and applies compositional data analysis to explain the culture-alignment relationship. However, it represents only a general snapshot; sample or group differences remain to be explored. Practical implications—The findings indicate that a combined cultural mindset of stability and innovation can help IT management and staff better align IT and business and achieve strategic and operative goals. Originality/value—Comparing two established IT culture and alignment models, this paper presents a sound methodology for dealing with forced-choice questionnaire data.
Keywords
Introduction
In the digital age, the role of information technology (IT) management in organizations is fundamentally changing. Organizations tend to be less hierarchical, improve collaboration, and connect distributed workplaces and teams (Schwab, 2017). Accordingly, the reputation and influence of IT management are growing considerably (Reichstein, 2019). IT management expands from providing an effective, efficient, and secure IT infrastructure to creating value, developing new digital or digitally enhanced products and services, and helping the business realize digitalization opportunities (Deiser, 2018; Kahre et al., 2017). New technologies regularly lead to a need for different skills and mindsets; the organization’s ability to attract talented and digital-savvy employees, integrate them, and bridge potential cultural differences are particular challenges in digitalization (Urbach et al., 2019). In this context, organizational culture (OC) impacts the changing role of IT management, especially in aligning business and IT. Recent studies underpin the importance of culture for the digital transformation of enterprises (Grover et al., 2022; Tuukkanen et al., 2022), especially in the current business environment, which is characterized by volatility, uncertainty, complexity, and ambiguity (Sackmann, 2021). Regarding business-IT alignment (BITA), these requirements demand that business and IT behave as one, rather than being culturally separated in an “us” versus “them” (Chew & Gottschalk, 2013). Despite the growing economic importance of IT (Pradhan et al., 2019) and the challenges of agile and digital transformation (Gajardo & La Paz, 2019), there is still a lack of research on the relationship between OC and BITA (El-Mekawy et al., 2016; Ravishankar et al., 2011).
To date, IT has been viewed primarily as functional and essentially subordinate to the business. This perspective originated from executives’ perceptions of IT as a cost factor because it did not provide the expected competitive advantage in the 1980s and 1990s (Chew & Gottschalk, 2013). The relationship between business and IT remains potentially conflictual, for example, concerning the users and developers of information systems (IS) and their often contradictory visions (Leidner & Kayworth, 2006). However, the partnership between business and IT also depends on IT departments’ business orientation, management knowledge, and the perceived value of IT (Manfreda & Indihar Štemberger, 2019). These findings are consistent with research from 20 years ago, in which IT management admitted in multiple case studies that it was necessary to increase its business knowledge (Peppard & Ward, 1999). However, leveraging benefits and being accountable for success is not just IT management’s responsibility but requires effort throughout the entire organization (Peppard & Ward, 1999). It is a veritable shift in the mindset and attitude of many companies that IT is no longer primarily responsible for supporting the business to generate profits but beyond that to identify and proactively drive the value creation potential. Improving competitive measures also means that IT management can become a facilitator of organizational agility (Tallon et al., 2019).
Against this background, this paper investigates the influence of OC on BITA. It asks whether particular cultural dimensions enable IT executives, teams, or departments to align their strategy with the business accordingly. This question is examined by conducting a survey. The survey uses the original ipsative scale of Cameron and Quinn’s (2011) competing values framework for measuring OC and applies it to Henderson and Venkatraman’s (1993) strategic alignment model for BITA. This procedure implies a series of methodological consequences. The essence of this scale is that the respondents must divide 100 points among four response alternatives to several items. These responses result in compositional data that only allow the comparison of the components in the composition as parts relative to each other or the whole (Alenazi, 2021; Coenders et al., 2011; Mateu i Figueras et al., 2016; van Eijnatten et al., 2015; Vives-Mestres et al., 2016). Compositional data analysis is becoming increasingly popular in social sciences (Coenders & Ferrer-Rosell, 2020). This paper discusses the advantages and disadvantages of ipsative versus normative scales. In particular, it presents the methodology for dealing with multiplicative ipsative rating scales and the resulting compositional data. The main property of such scales and data is the interdependence of item ratings resulting in spurious correlations. So, the primary goal of this paper is to suggest a sound procedure to handle such data. A second goal is the application of appropriate statistical methods and functions to the underlying theoretical model and hypotheses. The article recommends the main routines for analyzing data with two interacting compositions.
The remainder of this article is organized as follows: The theoretical background shows the models for understanding the OC/SA relationship, formulates hypotheses for applying subsequent regression analysis, presents a literature review about ipsative and normative scales, and lays the foundation for compositional data analysis. The aftermath section addresses the survey procedure, participants, measures and scales, and methods applied. Then, after the descriptive statistics with the variations in the OC and SA compositions, the results of the linear regression analysis and the corresponding centered log-ratio coefficient matrix used to test the hypotheses follow. In light of the introduction and theoretical background of this work, the subsequent section reflects on the results, highlights the theoretical and methodological contributions, and explains their practical implications. After a brief discussion of the main limitations and recommendations for future research, the article concludes with a statement of this work’s findings, which enrich the understanding of handling ipsative scales and the resulting compositional data.
Theoretical Background
Organizational Culture of IT Management
The domain of organizational culture (OC) is not easy to capture; various definitions and models can be found in the literature. Probably the most frequently cited definition stems from Schein (1984), which assumes three levels: at the bottom, there are primarily invisible basic assumptions about nature, people, and relationships; based on these at the middle, values are created with greater awareness and reflected at the top in visible behavior, artifacts, and outcomes. This perspective highlights a company’s culture as unique and difficult to decipher because it is based on taken-for-granted assumptions (Schein, 1984) and requires interpretation and reasoning (Alvesson, 2013). In contrast, a functional perspective views culture as a measurable and comparable organizational characteristic (Cameron & Quinn, 2011) and a shared understanding among organizational members (Wallach, 1983).
This study relies on Cameron and Quinn’s (2011) competing values framework (CVF). This framework originates from research on organizational effectiveness, is widely accepted, and is regularly studied further (Hartl & Hess, 2017; Hartnell et al., 2011; Heritage et al., 2014). The CVF in Figure 1 identifies four ideal types of culture that relate to each other in the dimensions of flexibility versus stability and internal focus versus external focus (Cameron & Quinn, 2011).

Competing values framework.
At first, the clan represents an internal and inclusive orientation with high flexibility and freedom to act. It is like an extended family and a friendly workplace where people personally share a lot of themselves. Second, the outward-looking adhocracy culture prevails typically in an innovative and entrepreneurial environment that welcomes risk-taking and a willingness to change. The spirit of experimentation and innovation is the glue that holds the organization together until the mission is accomplished; then, it is quickly restructured, and new opportunities are seized. Opposite the clan is the third type of market culture, which focuses on external orientation, stability, and control. Its core values are competitiveness and productivity; the goal is to gain an advantage through sales, exchange, and contracts. Finally, the counterpart of adhocracy is hierarchy culture, which emphasizes internal alignment, stability, and control. Hierarchical cultures occur in organizations where formalisms, structures, and procedures prevail. The objective is a smoothly functioning and tightly coordinated organization, unified by formal rules and guidelines.
IT Management Performance in Terms of Business-IT Alignment
Strategic alignment (SA) and business-IT alignment (BITA) and their impact on performance have been on the research agenda since the 1970s (Hiekkanen et al., 2013; Kahre et al., 2017; Luftman & Brier, 1999). BITA affects the delivery of business value (Van Grembergen, 2004), business performance (Avison et al., 2004; Chan & Reich, 2007), and competitive advantage (Hiekkanen et al., 2012). However, there is no straightforward definition of alignment in the literature; scholars struggle with the terms fit, linkage, or integration (Chan & Reich, 2007).
This study uses Henderson and Venkatraman’s (1993) definition and model; their strategic alignment model (SAM) is widely empirically supported (Avison et al., 2004; Chan & Reich, 2007; Kahre et al., 2017). It is one of the standards in research for information systems’ strategic alignment, and many researchers build on this (De Haes & Van Grembergen, 2015). Another often-used and cited model is Luftman’s (2000) strategic alignment maturity model. However, this paper does not measure BITA maturity, which would be the subject of a longitudinal case study. In addition, Luftman (2000, pp. 19–20) explicitly mentions culture in his strategic alignment maturity criteria called “skills.” This would violate this paper’s assumptions of organizational culture and strategic alignment being independent.
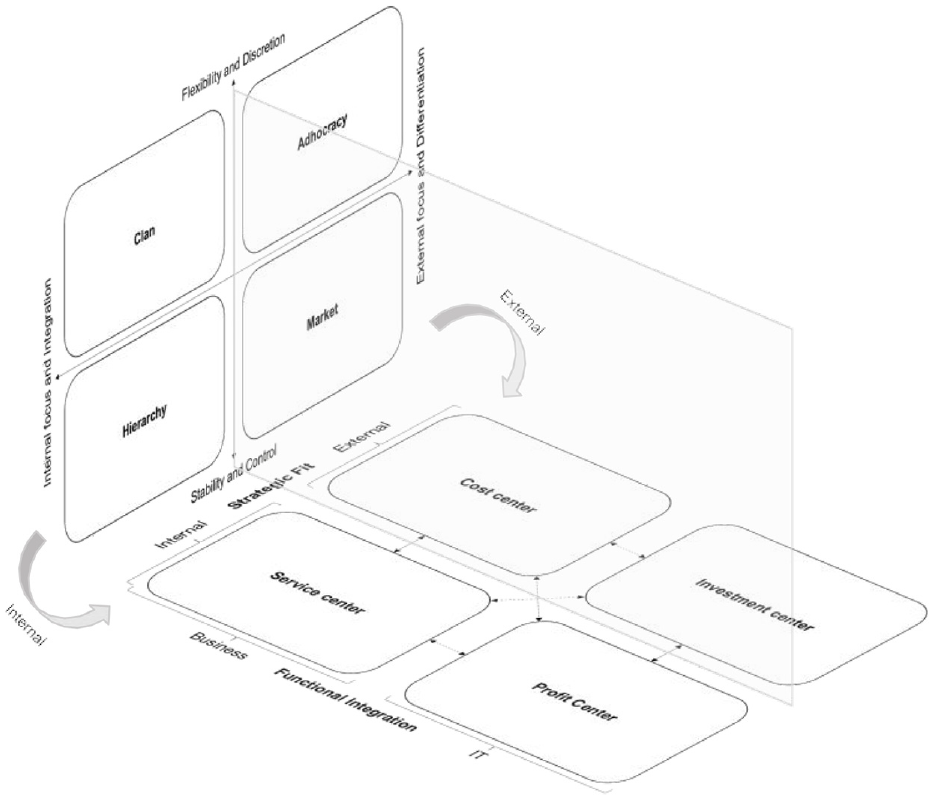
Henderson and Venkatraman (1993) emphasize that SA is not a state but a continuous process of adaptation and change. The SAM is about the strategic fit and the functional integration of business and IT in four interconnected perspectives across external and internal domains, as shown in Figure 2.

Strategic alignment model.
First, the business strategy, functionally integrated on the business side and strategically aligned with the external domain, drives the IT perspective according to the performance criteria of a cost center. Second, when IT strategy dominates with the ideal of technology leadership in the external domain, management formulates a technology vision and IT acts as an investment center in the role of an architect. Third, IT operates as a profit center and catalyst for information systems (IS) infrastructure and processes, while management sets the corporate vision. Finally, IT is becoming more integrated back into the business as a service center and is focused on meeting the infrastructure and process needs of the business, with management setting priorities and allocating resources.
After this brief presentation of the CVF and SAM, the comparison of both models and the corresponding hypotheses are explained below for a better understanding of the methodology used.
Hypotheses
Research has regularly shown that aligned business and IT strategies affect performance and that companies with such alignment perform better than those without (Avison et al., 2004; Chan & Reich, 2007). Various approaches can be found in the literature, with much attention paid to strategic IT alignment but little to cultural aspects (Chan & Reich, 2007); only a few studies examine the role of OC in the process of IT alignment (Leidner & Kayworth, 2006). Davids and Van Belle (2017) remain theoretical; they state that they “only touched on the Strategic Alignment Model” (p. 286). Chtourou Ben Amar and Ben Romdhane (2019) examined the influence of OC on SA of information systems (IS). However, the authors did not argue with the SAM; instead, they justified the informal dimensions of IS alignment as an essential element of a clan culture (Chtourou Ben Amar & Ben Romdhane, 2019). Finally, for the relationship between organizational factors and enterprise IT adoption, Jing-hua et al. (2010) found no significant impact on BITA. Although the authors did not apply the SAM, some of the arguments about clarifying IT planning with the business and working with IT for operational efficiency are similar to the SAM perspectives of strategy implementation and service level (Jing-hua et al., 2010).
Thanks to their integrative view and similar relative dimensional characteristics, SAM and CVF are ideal for explaining business and IT alignment through OC. Henderson and Venkatraman’s (1993) SAM distinguishes business and IT in a theoretically robust and understandable way and includes the internal and external domains. Consequently, it perfectly fits the CVF with similar dimensions. The juxtaposition of these models in Figure 3 addresses a gap in IS research and contributes to the understanding of “cultural-specific antecedents to alignment” and “integrated IT and management in terms of culture, skills, and responsibilities” (Chan & Reich, 2007, p. 311).
First, the CVF market culture, with its external focus and need for stability and control, fits the externally oriented SAM cost center, which is functionally integrated into the business side. The result of a study on the relationship between IT capabilities and the performance of so-called “born global” firms shows that “market orientation, international entrepreneurial orientation, and organizational learning” (Zhang & Tansuhaj, 2007, p. 68) are crucial and give these firms competitive advantages. Considering the relative reasoning of the CVF and SAM dimensions, the first hypothesis is formulated as follows:
H1: Influenced by the prevailing market culture of IT management compared to the other three CVF culture types, strategically aligned IT performs like a cost center relative to the remaining SAM perspectives.
Second, CVF’s outward-looking adhocracy culture, focusing on differentiation, flexibility, and discretion, corresponds to the SAM investment center, which helps the organization acquire IT capabilities and new technologies. Büschgens et al. (2013) found their hypothesis supported that innovative organizations are most likely to have an adhocracy culture. Lopez-Nicolas and Meroño-Cerdán (2009) found a link between adhocracy and the use of information and communication technology (ICT) for knowledge management; an adhocracy culture emphasizes the use of ICT for codification, that is, for evaluating and searching information, and for simulation and prediction. Thus, these relationships lead to the following hypothesis:
H2: Influenced by the prevailing adhocracy culture of IT management compared to the other three CVF culture types, strategically aligned IT performs like an investment center relative to the remaining SAM perspectives.
Third, the internal and integrative perspective of the CVF clan culture fits the SAM profit center with an internal IT focus. Clan culture also positively affects ICT used for knowledge management. Companies with certain clan characteristics use ICT specifically for personalization, that is, for collaboration and communication (Lopez-Nicolas & Meroño-Cerdán, 2009). For IS SA, Chtourou Ben Amar and Ben Romdhane (2019) found a significant impact of clan culture, especially on the success of enterprise resource planning systems. The third corresponding hypothesis is then:
H3: Influenced by the prevailing clan culture of IT management compared to the other three CVF culture types, strategically aligned IT performs like a profit center relative to the remaining SAM perspectives.
And, fourth, CVF’s inward-looking, stability-oriented hierarchy culture harmonizes with the SAM service center, which provides IT services to the organization. Looking at the results of a study on the co-production of services, the integrative and optimizing function is also an essential factor in IT companies (Tsou & Hsu, 2015). Consequently, hierarchy culture also contributes strategically to better-performing organizations, leading to the following hypothesis:
H4: Influenced by the prevailing hierarchy culture of IT management compared to the other three CVF culture types, strategically aligned IT performs like a service center relative to the remaining SAM perspectives.
It is understood that the digitalization and digital transformation phenomena challenge organizations to a considerable extent (Gajardo & La Paz, 2019; Grover et al., 2022; Tuukkanen et al., 2022). However, related research questions about direct relationships between digitalization and OC or SA are out of this paper’s scope; digitalization significantly frames this study. Subsequently, the organizational characteristics of digitalization serve as moderators of the relationship between the CFV culture types and SAM perspectives since the observation focus of this paper lies on the institutional, that is, organizational side. Although none of the papers reviewed here perceived a similar effect, at least one study included digital resources in its investigation. Tsou and Hsu (2015) adapted Sambamurthy et al.’s (2003, p. 247) “digital options” as capabilities in the form of digitized processes and knowledge assets. Accordingly, readiness to use digital resources, defined as knowledge and process richness, moderates the impact of the co-production of services on firm performance (Tsou & Hsu, 2015). This moderating effect could serve as a proxy for the following hypothesis:
H5: The organizational characteristics of digitalization moderate the relationship between the interrelated OC types and the relative constructs of IT management SA performance.
Figure 4 illustrates these hypotheses in a conceptual research model.

Conceptual research model with hypotheses.
Comparison of Ipsative and Normative Scales
An increasing number of studies use Cameron and Quinn’s (2011) original ipsative scale to measure OC (Braunscheidel et al., 2010; Reis et al., 2016; Sasaki et al., 2017; Suppiah & Singh Sandhu, 2011; van Eijnatten et al., 2015; Wiener & Boer, 2019). Other investigations adopted the original scale and applied a 5-point Likert scale (Heritage et al., 2014; Lopez-Nicolas & Meroño-Cerdán, 2009; Wang et al., 2021). There are extensive and ongoing methodological discourses on the advantages and disadvantages of ipsative and normative scales (Baron, 1996; Batista-Foguet et al., 2015; Meade, 2004; Pavlov et al., 2019; Saville & Willson, 1991; Watrin et al., 2019; Wetzel & Frick, 2020).
Ideally, ipsative scales lead to more nuanced assessments; respondents actively reflect on trade-offs between alternatives. Essentially, this forced response reveals that “life is about choices” (Saville & Willson, 1991, p. 222) and that it discloses “the real choices that a person has to make in life” (Baron, 1996, p. 53). In contrast, normative scales, such as Likert scales, may exhibit a central tendency bias, making respondents reluctant to choose extreme categories or, conversely, to give an affirmative, socially desirable response (Baron, 1996; Pavlov et al., 2019; Watrin et al., 2019; Wetzel & Frick, 2020). For example, respondents in an innovative, entrepreneurial setting would most likely choose an adhocracy item to meet presumed expectations in the cultural stimuli, even if they were comfortable with hierarchical conditions.
However, a disadvantage of ipsative scales is that the allocation of scores between response options can be challenging (Meade, 2004; van Eijnatten et al., 2015). In the present study, this limitation was mitigated by verbalizing the questions as clearly as possible and by technically designing the questionnaire with sliders that provide values from zero to 100 for each alternative. In addition, comparisons between respondents in raw data are problematic (Baron, 1996; Saville & Willson, 1991; van Eijnatten et al., 2015). Therefore, this study used compositional data analysis, which offers appropriate methods to address such circumstances.
Basics of Compositional Data Analysis
Since the OC and SA scales are ipsative scales adding up to 100, and their components form parts of the whole, they yield compositional data. The corresponding items are four-part compositions that form the vector
However, zero values are problematic for log ratios and require the same attention as missing values. In data cleaning, zeros are usually replaced by small amounts that are hardly detectable (Batista-Foguet et al., 2015; Coenders et al., 2011). Lubbe et al. (2021) simulated and discussed several imputation methods, of which a constant substitution by 0.65 times the detection limit worked well.
One of the main properties of compositional data is, that as one of the components increases, other components decrease; this leads to negative and spurious correlations (Coenders et al., 2011; van Eijnatten et al., 2015). Standard correlation-based methods such as factor analysis (van Eijnatten et al., 2015) or structural equation modeling (Coenders et al., 2011) are not feasible for multiplicative ipsative data. Instead, summary statistics are presented in this study using closed geometric means, standard deviations, minimum and maximum, and the variation matrix. In the context of compositional data analysis, the variation matrix is a matrix of all possible logarithmic relationships between the components, and the mean values are the respective midpoint of the compositions (van den Boogaart & Tolosana-Delgado, 2013; van den Boogaart et al., 2022). The variation matrix has the same structure as a correlation matrix. Still, the interpretation of the coefficients is different. Therefore, a low variation means a corresponding variance of the log ratios
The linear model with the composition of SA as the vector

Note that the number of components in the dependent (
The properties of compositional data require log-ratio transformations and computations in the Aitchison geometry (Egozcue et al., 2003; Muller et al., 2018), which dates back to the seminal paper of Aitchison (1982). The isometric log-ratio (ilr) transformation is suitable for virtually all statistical methods (Mateu i Figueras et al., 2016). Equation (2) shows the regression model with the ilr-transformed compositions, following van den Boogaart and Tolosana-Delgado (2013, p. 155):

After fitting the regression model of equation (2) with the ilr coordinates, it is back-transformed using the ilr-inverse function (van den Boogaart et al., 2022), followed by conversion of the ilr coefficients to centered log ratios (clr). The resulting clr coefficient matrix indicates the association of the compositional parts OC and SA compared to all other parts, that is, their relative position of the central tendency (Smithson & Broomell, 2022, p. 8).
Materials and Methods
Procedure and Participants
Data for this study were collected from July 2020 to December 2021 using an online questionnaire. The sample included respondents from different industries, functions, age groups, genders, and countries. The sample was addressed to around 400 personal LinkedIn and XING connections and promoted through a blog post in English and German. Furthermore, a Google Ad-Words campaign was launched and the sample was increased using the Pollfish interactive portal. Pollfish (2023) uses a combined approach to ensure data quality. First, participants are reached randomly and “organically” by applying a double opt-in with a user ID in apps they already have in use (Pollfish, 2023). Then, Pollfish added a filter question to ensure that respondents were familiar with the topic. In addition, the service used proprietary artificial intelligence and machine learning algorithms to detect fraudulent behavior like bots answering the questionnaire too quickly (Pollfish, 2023). Of the 731 participants, 477 questionnaires were completed for an effective response rate of 65%. After eliminating the rows with missing values in the OC and SA variables, 450 observations remained for further analysis.
A brief description of the sample follows. Organizational unit: Almost three-fourths (72%) of the participants come from IT-related organizational units, and 28% are from business units. Management level: 37.5% are board members or executives, 22.9% manage a department or other unit, 21.3% are employees or team members, and 16% manage a team or project. Gender: More respondents are male (72.4%), and 27.6% are female. Age: Participants averaged 38.5 years of age (SD = 10.8). Migration: Of those who migrated, 8% went primarily to North America, Europe, and Oceania and have lived there for 21 years. Digitalization: The level of digitalization, that is, in agreement with the achievements of digital transformation, mainly ranges from 3 (neither agree nor disagree) to 4 (agree); the median is 3.83 and the mean is 3.7 (SD = 0.87).
Measures and Scales
The questionnaire consisted of five parts: Organizational and demographic data, SA, OC, digitalization, and key performance indicators. The critical parts were questions about the SA, OC, and digitalization characteristics.
The measurement of the IT management culture perceptions as an independent construct followed Cameron and Quinn’s (2011) organizational culture assessment instrument (OCAI). The questions were aligned with the six elements of the OCAI, that is, dominant characteristics, organizational leadership, management of employees, organization glue, strategic emphases, and criteria of success (Cameron & Quinn, 2011, pp. 30–32). Respondents had to divide 100 points, or percent, among four alternatives for each OCAI element referring to the quadrants in Figure 1. An example of a scored question for the dominant characteristics is as follows. The question is: “Which of the following statements is most applicable to IT?” A scored question with the ipsative scale used in the questionnaire could be, first, “IT is like a big family in which the members share much of themselves.” with 10 points, second, “IT and its employees are highly resulting- and performance-oriented to remain competitive.” with 15 points, third, “IT is a very dynamic and entrepreneurial place, where the employees are willing to stick their necks out and take risks.” with 45 points, and, fourth, “IT is very controlled and structured; formal procedures govern employees’ actions.” with 30 points. Note that the placement of answer choices in the questionnaire items changed dynamically so that respondents did not tend to confirm the answers in the same order. In this case, the order would be clan, market, adhocracy, and hierarchy.
This paper measures SA using the SAM presented above as a dependent construct. Respondents were first asked to indicate how likely they would agree with statements about the general perspectives of their organization’s SA. Second, they were asked to indicate their opinion about the role of top management. The third question related to the role of IT management, and the fourth question concerned the prevailing performance criteria. Based on the mapping and hypothesizing of OC and SA described above, the SA scales were constructed as OC scales, that is, respondents had to divide 100% between four alternatives.
Finally, questions on the organizational characteristics of digitalization with items from previous research were asked on a 5-point Likert scale from 1 (strongly disagree) to 5 (strongly agree).
Methods Used
This study applied Lubbe et al.’s (2021) zero imputation method of a constant substitution by 0.65 times the detection limit, setting the detection limit between zero as the absence of a particular culture type and the minimum score of 5.0% as proposed by van Eijnatten et al. (2015). With 2.5%, half of the lowest score is a fair compromise to deal with respondents who accidentally or explicitly enter a zero; in this survey, zeros can be valid and are not comparable to missing values. The next step was to close the sum of the composition to 100 and to multiplicatively adjust the remaining non-zero parts so that the ratios do not change.
Then, summary statistics are calculated with closed geometric means, standard deviations, minimum and maximum, and the variation matrix as in van den Boogaart and Tolosana-Delgado (2013) and van den Boogaart et al. (2022).
Following van den Boogaart and Tolosana-Delgado (2013) and applying equations (1) and (2), the linear model was calculated with the ilr-transformed SA compositions explained by the ilr-transformed OC compositions. Then, several models with possible covariates were tested, including the model with digitalization as a moderator.
Finally, the clr coefficient matrix was computed with the best-fit regression model and the conversed back-transformed ilr coordinates.
Results
Descriptive Statistics
Table 1 shows the summary statistics of the OC composition; please note the variation matrix in the four columns on the right.
Geometric Means, Standard Deviations, Min., Max., and Variations (1–4) of the OC Composition (N = 450).

The variation between market culture and the other three types shows the lowest value of .222 between market and adhocracy. This result means that both types of culture are proportional and similar to each other (van den Boogaart & Tolosana-Delgado, 2013), as suggested by their position in the external focus of the CVF. On the contrary, the highest variation of .360 between market and clan indicates that these types are less similar; this confirms the idea of the CVF contrasting the two culture types. Then, the two variations between adhocracy and clan and adhocracy and hierarchy show relatively high values, which implies that the three types are different. Finally, the value of .178 between clan and hierarchy is the lowest, meaning the highest proportionality value. As mentioned above, this result also reflects that the two culture types are internally focused.
The mean values in the first column on the left in Table 1 show a slight preference for the hierarchy compared to the other culture types.
Table 2 depicts the values of the SA composition.
Geometric Means, Standard Deviations, Min., Max., and Variations (1–4) of the SA Composition (N = 450).

Here, the variations are less in line with expectations. Although the variation value of .220 indicates that the cost center and the investment center are proportional and, thus, in the external area. However, the service center has the highest value of .443 with the profit center, which means a significant difference. The internal domain does not seem to unite the two alignment perspectives; instead, it depicts the opposite functional integration in business and IT. Finally, the mean values do not vary much; they are close to the compositional midpoint of .25.
Hypotheses Testing
The analysis of variance revealed a highly significant F-value of 10.5976 with a degree of freedom of 9/1338, indicating that strategic alignment generally depends on organizational culture. The results of the linear regression analysis are shown in Table 3.
Linear Regression Analysis of Organizational Culture on Strategic Alignment.

Note. Analysis of covariance (ANCOVA) of the linear models with Pillai’s trace; N = 450; M1–M7: models.
(.)p < .1. *p < .05. ***p < .001.
The first model M1 shows the only influence of the OC composition on the SA composition, which is significant at the .001 level. Models M2–M5 with possible covariates reduce the direct influence of OC without a notable impact. However, because age might have an influence, it is included in model M6 with the moderating effect of digitalization. Although the direct influence of OC increased again, age remained at a low significance level. Thus, model M7 of the direct impact of OC on SA, moderated by digitalization, has the highest significant values. Note that digitalization itself does not have a direct influence.
Table 4 shows the final clr coefficient matrix of the OC types relating to the SA perspectives, moderated by digitalization.
Coefficient Matrix of OC and SA, Moderated by Digitalization.

Note. The coefficient matrix of the clr-transformed compositions is singular; the values in the rows and columns sum up to zero.
Discussion
IT management can play a crucial role in organizations, especially in the digital age. The importance of IT management is increasing with the rise of strategic IT decisions (Reichstein, 2019). In this context, business-IT alignment (BITA) is the key, including cultural perceptions in companies. This study showed that organizational culture (OC) and strategic alignment (SA) are interrelated based on linear regression and compositional data analyses. With the clr coefficient matrix of Table 4, it is now possible to discuss the hypotheses’ supporting.
The market culture type is associated with the SA performance criteria of a profit center instead of a cost center; thus, hypothesis H1 is not supported. This result contrasts Zhang and Tansuhaj’s (2007) findings about firms’ competitive advantage through market orientation.
However, Zhang and Tansuhaj’s (2007) entrepreneurial orientation and Büschgens et al.’s (2013) innovativeness are confirmed by the relationship between the adhocracy culture type and the SA performance criteria of an investment center, supporting H2. The respondents emphasized an entrepreneurial, risk-taking, and innovative cultural characteristic paired with the technological visionary of an investment center.
The clan culture type is related to the SA performance criteria of an investment and cost center instead of a profit center, not supporting H3 and contrasting Lopez-Nicolas and Meroño-Cerdán (2009) and Chtourou Ben Amar and Ben Romdhane (2019) about clan characteristics influencing knowledge management and enterprise resource planning, respectively.
Finally, the relationship between the hierarchy culture type and the SA performance criteria of a service center is the most evident and supports H4. The internal and stability-oriented hierarchy culture is favored against the other culture types and corresponds to IT providing organizational infrastructure and processes by a service center. This finding confirms the study of Tsou and Hsu (2015) about the influence of service co-production on firm performance.
In addition, the clr coefficients were increasing with the highly significant moderating effect of digitalization in regression model M7 of Table 4; thus, hypothesis H5 also is supported.
The contribution of this paper is at least twofold: first, it juxtaposed two four-component models in a novel way, and second, it applied compositional data analysis to explain the relationship between OC and SA.
Theoretical Contributions
First, this study is one of the few that examines OC and its relationship to corporate SA and IT. Several approaches in the literature focus on SA but rarely consider cultural aspects (Chan & Reich, 2007), and few investigate the role of OC in achieving BITA (Leidner & Kayworth, 2006). Second, the comparison of the competing values framework and the strategic alignment model was eye-opening and revealed exciting results. Therefore, the main theoretical contribution is to take Cameron and Quinn’s (2011) four ideal OC types—clan, adhocracy, market, and hierarchy—and map them to Henderson and Venkatraman’s (1993) four SA performance evaluation criteria—cost, investment, profit, and service center. Third, the moderating effect showed that digitalization is an important concept to consider for the relationship between OC and SA.
In a nutshell, OC, SA, and digitalization are relevant from the perspectives of organizational effectiveness (Hartnell et al., 2011) and IT performance management (Avison et al., 2004). CVF and SAM are found to be highly beneficial in explaining the impact of OC on BITA. However, their characteristics are not taken for granted (Alvesson, 2013). This study showed that IT management needs to consider environmental factors such as technological challenges and digitalization opportunities.
Methodological Contributions
Given the ipsative nature of the original organizational culture assessment instrument (Cameron & Quinn, 2011) and its limitations (van Eijnatten et al., 2015), the main contribution of this article is to suggest a way how such forced-choice questionnaires can be handled and the data examined, even when the correlations are spurious and corresponding factor analyses are not applicable.
In particular, the compositional data analysis design with a composition as the independent construct, here OC, and a composition as the dependent variable, here SA, can be challenging. Because the application of standard statistical methods to the raw data is flawed (Muller et al., 2018), a regression analysis with appropriate forward- and backward-transformed log ratios is presented to test the significance of the linear models. The resulting centered log-ratio coefficients can then be interpreted as relative indicators of the observed relationships between OC types and SA performance criteria.
Practical Contributions
Although the creative and innovative use of IT plays an essential role in the digitalization of organizations (Deiser, 2018), this article indicates that IT management in the context of BITA is still traditionally perceived predominantly as a provider of a secure, efficient, and effective IT infrastructure. However, a corresponding cultural mindset in IT management is also welcomed in an entrepreneurial environment that requires technological leadership.
This paper focuses on the strategic-institutional perspective of IT management, but the results also have practical implications for IT development, operations, and staff. It is assumed that a better BITA facilitates their work. However, people need a cultural mindset similarly open to stability, flexibility, and reducing conflicts through shared values with business and process owners.
Limitations and Recommendations for Future Research
The choice of scales is critical and significantly impacts data collection and statistical methods. Survey participants were required to divide 100 points between four response alternatives for several questions. Answering these questions by selecting an agreement on a Likert scale would likely have been less complicated than this procedure.
In addition, because zeros are not allowed in the data, the imputation procedure is crucial. Lubbe et al. (2021) described several imputation methods that can affect the results. However, in this study, only the constant imputation method was used, and no other procedures were tested; understanding and analyzing them is beyond the scope of this study and would be a cause for further investigation.
Finally, the survey represents only a general snapshot of OC and SA in IT management. This survey does not reflect developments over time or deeper insights; this could be a follow-up study of a specific sample or group differences, for example, between participants belonging to IT or a business unit.
Conclusions
Drawing on established models from IT and management research, this paper examines the relationship between organizational culture and business-IT alignment. This relationship is shown to be primarily internal to the organization, emphasizing stability and control, and secondarily external to IT, with a willingness to take risks and embrace change. These findings enrich the understanding of how cultural characteristics influence the strategic perspectives of IT, especially in the digital age.
Moreover, the combination of a hierarchy culture strategically aligned as a service center and an adhocracy culture strategically aligned as an investment center is the result of the applied methodology. This paper suggests a sound procedure to deal with ipsative scales and the resulting compositional data. This is especially beneficial for scholars who want to use scales like Cameron and Quinn’s (2011) original organizational culture assessment instrument. In addition, the methods applied are appropriate for scales representing relationships between independent and dependent compositional variables and constructs where relative associations between items’ response alternatives or to the whole are relevant.
Footnotes
Acknowledgements
This paper would not have been possible without Karl Gerald van den Boogaart from the Helmholtz Institute Freiberg for Resource Technology (HIF), Freiberg, Germany. His advice on the methodology, data analysis, and the corresponding R code was tremendously helpful. I had the opportunity to present some of this paper’s findings in a poster session at the 9th International Workshop on Compositional Data Analysis. The helpful feedback of the workshop participants allowed me to improve this paper to a significant extent.
Declaration of Conflicting Interests
The author declared no potential conflicts of interest for the research, authorship, and/or publication of this article.
Funding
The author received no financial support for the research, authorship, and/or publication of this article.
Data Availability Statement
The questionnaire, the data set, and the R script are available in the online repository (Sieber, 2022).