
Abstract
This study investigates whether Ansoff’s Strategic Posture (SP)—the alignment among environmental turbulence, strategic aggressiveness, and internal capabilities—anticipates stock returns more effectively than traditional Wall Street analyst ratings. Using a two-firm semiconductor panel (NVIDIA and Intel, 2015–2023), SP is externally coded through a 65-item, behaviorally anchored instrument adapted from the OSPP framework and validated with inter-rater reliability. Panel regressions with firm and month fixed effects and standard asset-pricing controls (size, momentum, and Fama–French factors) show that SP significantly predicts monthly stock returns, while analyst ratings add limited incremental power. The SP×VIX interaction is positive, indicating that alignment is especially valuable during periods of heightened market uncertainty. Robustness checks—including alternative return horizons, placebo lead–lag tests, and alternative uncertainty proxies—confirm the stability of results. We discuss mechanisms such as innovation cadence, product-cycle timing, and capital allocation, and we temper conclusions to reflect the paper’s two-firm scope.
Plain Language Summary
This study asks a simple but powerful question: Can a company’s business strategy help predict its future stock performance better than professional Wall Street analyst ratings? To answer this, we compared two well-known technology companies, NVIDIA and Intel, over a 9-year period (2015–2023). We used a framework based on the ideas of Igor Ansoff, a pioneer in strategic planning, and extended by researchers in a 2012 SAGE Open article. This framework looks at how well a company’s strategy fits its environment, how aggressive it is in pursuing growth, and whether it has the internal capabilities to succeed. We measured strategy not by what companies said about themselves, but by what they actually did—using 65 real-world indicators like acquisitions, product launches, and market behavior. These were coded by independent analysts to ensure objectivity. We then compared the strategic posture scores to the companies’ actual stock performance and to ratings issued by Wall Street analysts. Our findings suggest that this strategy-based approach can better predict long-term stock returns than analyst opinions, particularly in rapidly changing industries like semiconductors. NVIDIA, for example, had a consistently aggressive and well-aligned strategy that was reflected in its strong stock growth. Intel, on the other hand, showed weaker alignment, and this was mirrored in its underperformance. This research shows that by analyzing how companies act strategically—rather than relying only on financial metrics or expert opinions—we may get a clearer picture of future performance. This has important implications for investors, managers, and policy makers who want to make more informed decisions based on how strategy drives success.
Introduction
In today’s volatile and rapidly evolving business environment, traditional financial analysis often lacks the capacity to incorporate strategic managerial factors that influence firm performance. The growing complexity of global markets and the pace of technological change call for complementary approaches that account for strategic alignment and organizational responsiveness. Igor Ansoff’s Strategic Success Hypothesis offers such a framework by linking firm performance to the alignment of strategic aggressiveness, environmental turbulence, and internal capabilities (Ansoff & Sullivan, 1993; Kipley, Lewis, & Jeng, 2012). This paradigm is grounded in Ashby’s Law of Requisite Variety, which states that an organization’s internal complexity must match that of its external environment to respond effectively (Ashby, 1956). Empirical studies further support the value of this alignment, showing that firms with strong strategic posture often outperform those lacking it (Bonelli, 2017; Eisenhardt & Martin, 2000; Kipley, Lewis, & Helm, 2012).
This study applies Ansoff’s Strategic Posture Analysis to two high-tech firms, NVIDIA and Intel, over the period 2015 to 2023. NVIDIA has demonstrated consistent strategic coherence and financial success, while Intel has faced critiques over strategic missteps and declining competitiveness. Strategic Posture scores—referred to as Strategic Posture (X1)—are generated using the Optimal Strategic Performance Position (OSPP) Matrix, for the part derived from the original ANSPLAN-A software (Ansoff, 1986). These scores are then compared with Wall Street analyst ratings (X2) and actual stock returns (X3) through regression analysis.
The study addresses the following research questions:
To address these questions, the study tests the following three hypotheses:
1.
2.
3.
By empirically evaluating the explanatory and predictive value of strategic alignment, this study bridges strategic management theory with equity valuation practice, highlighting the practical relevance of strategic posture as an analytical tool for investors, managers, and financial analysts.
Scope and Claims
This study is deliberately bounded: we analyze two semiconductor firms over 2015 to 2023 to conduct an in-depth, methods-focused comparison between Ansoff’s Strategic Posture and analyst ratings. All inferences are framed as evidence from these cases rather than universal claims; we discuss external validity and avenues for multi-industry replication in the Conclusion.
Rationale for Selecting NVIDIA and Intel
NVIDIA and Intel were purposefully selected for this study to exemplify contrasting strategic alignments within the highly volatile and innovation-intensive semiconductor industry. NVIDIA represents an exemplary model of strategic alignment characterized by proactive adaptation to environmental turbulence, aggressive strategic initiatives, and robust internal capabilities. Its strategic coherence is evidenced by sustained success in artificial intelligence, data center solutions, and integrated platform ecosystems, positioning NVIDIA as an ideal firm to evaluate the tangible benefits derived from strategic alignment.
Conversely, Intel provides a sharp contrast, serving as an illustrative example of strategic misalignment over the same period. Despite its considerable market presence, historical industry leadership, and substantial resource base, Intel has encountered persistent strategic setbacks—most notably manufacturing delays, frequent management turnover, and inconsistent strategic initiatives. These challenges reflect significant gaps between Intel’s strategic aggressiveness, internal capabilities, and external environmental demands.
By contrasting NVIDIA’s strategic alignment with Intel’s strategic misalignment, this comparative analysis tests the effectiveness of Ansoff’s Strategic Posture Analysis relative to traditional financial analyst ratings, thus offering critical insights into the strategic determinants of stock performance.
Literature Review
The emergence of strategic management in the 1960s and 1970s was driven by growing interest in the variables that determine organizational success. This interest laid the foundation for Igor Ansoff’s Strategic Success Paradigm, which integrates strategic intent, organizational capabilities, and environmental complexity into a unified model for navigating business turbulence (Ansoff & McDonnell, 1990; Ansoff & Sullivan, 1993; Kipley, Lewis, & Jeng, 2012). Central to this paradigm is the concept of environmental turbulence, defined as the degree of changeability and unpredictability in a firm’s external environment. This construct underpins the core logic of strategic alignment models.
Environmental Turbulence and Strategic Aggressiveness
Ansoff’s paradigm builds on Emery and Trist’s (1965)“causal texture” framework, which conceptualized the dynamic and unpredictable relationship between firms and their environments. This work directly informed Ansoff’s first alignment principle: a firm’s strategic aggressiveness (SA) must match the level of environmental turbulence (ETL) it faces.
Bourgeois and Eisenhardt (1988) introduced the notion of high-velocity environments, emphasizing speed and discontinuity in strategic contexts. Ansoff’s model offers a broader typology of environmental conditions—ranging from stable to surpriseful—which supports more systematic strategic matching. D’Aveni (1994) extended this view with his theory of hypercompetition, suggesting that firms must continuously escalate strategic moves to stay ahead. Together, these contributions reinforce the centrality of external context in shaping appropriate strategic responses.
Capabilities and Organizational Responsiveness
While external turbulence sets the challenge, a firm’s internal capacity to respond—its capability responsiveness (CR)—determines strategic effectiveness. Chandler’s (1969) foundational work on “strategy and structure” showed how firms adapt organizational form to match strategic goals. This supports Ansoff’s second alignment rule: internal capabilities must match strategic aggressiveness.
Andrews (1971) framed strategy as resource deployment aligned with intent, a logic further refined by Lyles and Salk (1996), who found that internal knowledge systems improve performance in dynamic environments. Teece et al. (1997) advanced this thinking with the dynamic capabilities framework, highlighting a firm’s ability to adapt and renew capabilities in response to change. These studies collectively validate Ansoff’s view that internal responsiveness must evolve alongside both strategy and external complexity.
The Cohesion of Organizational Components
Ansoff’s third alignment condition emphasizes internal cohesion—the consistency and integration of organizational subsystems such as structure, culture, and control systems. Miller et al. (1984) showed that disjointed internal elements can undermine execution, while their “nexus” concept illustrated how interdependent systems foster success.
Mintzberg (1978) likewise emphasized that consistent internal configurations are key to effective implementation. Empirical studies by Leonidou et al. (2002) found that firms aligning internal and external strategic elements outperformed less aligned competitors, reinforcing the performance relevance of internal strategic coherence.
Integrative Perspectives in Strategic Management
Ansoff synthesized these principles into the Strategic Success Paradigm, based on three propositions:
These three dimensions—ETL, SA, and CR—form the basis for evaluating a firm’s Strategic Posture and represent the foundation of the empirical framework applied in this study.
Contemporary Validation of Ansoff’s Paradigm
Recent research has validated the practical utility of Ansoff’s model. Kipley, Lewis, and Jeng (2012) developed the Organizational Strategic Posture Profile (OSPP), a diagnostic tool that evaluates alignment across ETL, SA, and CR. Applied in high-turbulence industries, it shows that firms with better alignment outperform their peers.
Eisenhardt and Martin (2000) reinforced this finding, showing that dynamic capabilities help firms maintain strategic fit in fast-changing environments. O'Reilly and Tushman (2008) introduced strategic ambidexterity, the capacity to explore and exploit simultaneously, which complements Ansoff’s emphasis on adaptability and coherence.
These works support the idea that strategic alignment is not only conceptually valid but empirically consequential—though rarely used in firm valuation models.
Recent scholarship has further reinforced this view by revisiting Ansoff’s original contributions and highlighting their contemporary relevance for strategic management research (Puyt et al., 2024).
Likewise, Ansoff’s weak signal theory has been revisited in light of machine learning advancements, with recent work showing how AI-based methods may alter the way filters of weak signals operate (Venugopal, 2025).
In addition, Bonelli (2021) applied Ansoff’s Strategic Posture framework to Chinese SMEs in the post-COVID context, providing evidence of the model’s diagnostic utility for assessing strategic alignment and future performance potential.
Strategic Variables in Firm Valuation: An Expanded Perspective
Recent studies have begun to explore the role of strategic variables in predicting financial performance. Bonelli (2017) found that Strategic Posture (X1), operationalized as the degree of alignment across ETL, SA, and CR, consistently outperformed analyst ratings (X2) in forecasting stock returns (X3) across 107 firms.
Kipley, Lewis, and Helm (2012) provided sector-specific evidence that Strategic Posture (X1) yields measurable gains in performance, especially under high uncertainty. Weinzimmer et al. (2023) showed that strategic aggressiveness (SA)—as proactivity and risk-taking—positively correlates with performance in small firms, suggesting context matters.
Arrighetti et al. (2024) introduced strategic dynamism, finding that firms with greater adaptive capability and frequent renewal achieve superior productivity growth, driven by strong internal resources. Pesce and Neirotti (2023) linked IT-business alignment to improved returns on capital, reinforcing the role of internal cohesion in performance.
Olson et al. (2005) showed that alignment among strategy, structure, and competitive behavior drives profitability and growth—demonstrating that internal consistency has quantifiable valuation implications.
Extending this perspective, Eisdorfer et al. (2022) show that strategic competition links—captured through interfirm references in 10-K filings—predict abnormal stock returns, further underscoring the valuation impact of strategic positioning and industry structure.
Similarly, Lee et al. (2019) demonstrate that patent-based technological proximity generates return predictability across innovation-linked firms, illustrating how strategic innovation linkages contribute to valuation outcomes.
More recently, Lee et al. (2024) construct networks of production complementarities and show that peer firms’ returns and earnings revisions transmit predictive information, providing further evidence that strategic structures carry significant valuation power.
Complementing these network-based approaches, Jin (2024) applies topic modeling to earnings call discussions to capture firms’ strategic “business aspects,” showing that relatedness in strategic focus predicts cross-stock returns through underreaction mechanisms.
Causal Bridge From Posture to Returns
Strategic Posture should translate to excess returns through three mechanisms: (1) innovation cadence (aligned firms release architectures and platforms at a tempo matched to turbulence, driving revenue surprises); (2) product-cycle timing (market entries and upgrades are synchronized with demand shifts and competitor moves); and (3) capital allocation (aligned firms reallocate R&D, talent, and capex faster and more precisely). On the demand side, behavioral under-reaction to strategic signals delays price discovery, allowing SP to predict returns beyond what analyst ratings capture.
Synthesis and Research Gap
Despite substantial work on strategic fit and market-based predictors, no study directly pits Ansoff’s Strategic Posture against analyst ratings as competing predictors of stock returns within a transparent, coder-reproducible framework. We fill this gap by (i) adapting the OSPP framework to externally observable behavioral indicators for longitudinal coding, (ii) estimating two-way fixed-effects models with standard asset-pricing controls, and (iii) explicitly testing uncertainty moderation via the SP×VIX interaction.
Very few studies have systematically tested whether strategy-based metrics such as Ansoff’s Strategic Posture can outperform analyst ratings in predicting stock returns.
This study addresses that gap by applying a transparent, externally coded version of the OSPP framework to a 9-year panel of two semiconductor firms (NVIDIA and Intel, 2015–2023). By comparing Strategic Posture scores with analyst ratings and monthly stock returns, the paper provides evidence that strategic alignment offers forward-looking predictive value, while acknowledging that conclusions are bounded to these cases and period.
Methodology
This study is grounded in Igor Ansoff’s Strategic Success Paradigm, which links firm performance to the alignment among strategic behavior, internal capabilities, and external environmental conditions. According to Ansoff, sustained success depends on achieving coherence across three dimensions:
Building on this paradigm, Kipley, Lewis, and Jeng (2012) developed the Optimal Strategic Performance Position (OSPP) framework—a diagnostic tool that operationalizes Ansoff’s principles by evaluating how well a firm aligns its strategic posture with both environmental complexity and internal capacity.
Figure 1 illustrates the conceptual foundation of this model. The green trajectory represents an optimally aligned firm, where the levels of strategic aggressiveness (SA) and capability responsiveness (CR) are proportionate to the external turbulence (ETL) the firm encounters. In contrast, the red trajectory shows a misaligned firm, where under- or over-aggressive strategies, unsupported by internal resources, lead to diminished performance despite favorable external opportunities. This alignment logic underpins the scoring methodology used in this study to calculate Strategic Posture (

Strategic Alignment versus Misalignment Trajectories.
By applying this framework, the study seeks to empirically test whether firms with higher levels of strategic alignment achieve superior financial performance—particularly in comparison to conventional market-based evaluations like analyst ratings.
Operationalizing Ansoff’s Paradigm Through Kipley’s OSPP Framework
To empirically operationalize Ansoff’s Strategic Success, this study applies the Optimal Strategic Performance Position (OSPP) framework developed by Kipley, Lewis, and Jeng (2012). The OSPP offers a structured model to assess strategic alignment by examining three critical dimensions: environmental complexity, strategic aggressiveness, and internal responsiveness. It is grounded in Ansoff’s assertion that firms succeed when their internal capabilities and strategic behavior are properly aligned with the external environment.
The original OSPP model includes 10 structured survey instruments rated on 5-point scales and was designed for internal diagnostic use by firm executives. It evaluates strategic posture across three domains:
Each domain reflects a critical aspect of Ansoff’s alignment principles, offering a comprehensive view of how well a firm’s strategy fits its internal and external context. Items are assessed independently using anchored 5-point rating scales, reflecting observable organizational behavior and environmental characteristics. The psychometric structure and validation of the OSPP were originally published in Kipley, Lewis, and Jeng (2012).
To enhance transparency and facilitate replication, a full sample of Kipley’s original survey items is provided in Supplemental Appendix A.
Originally designed as an internal diagnostic tool, the OSPP surveys were administered to senior managers with direct knowledge of firm-level strategy and execution. The framework was developed as an extension of Ansoff’s ANSPLAN-A strategic planning software, reinforcing its diagnostic function in high-turbulence environments.
Figure 2 presents the five-level turbulence classification that underpins Ansoff’s framework, ranging from stable environments to highly surpriseful conditions. These levels define the external complexity against which a firm’s strategic posture is judged.

Environmental Turbulence Typology (Kipley, Lewis, & Helm, 2012).
This methodological adaptation preserves the theoretical integrity of Ansoff’s model while enabling consistent, externally verifiable, and multi-year analysis. By separating the fixed environmental context (ETL) from firm-level strategic behavior (SA, CR), the model facilitates a structured, theory-based evaluation of Strategic Posture (X1) as a predictor of firm performance.
Adapting OSPP Framework for External Assessment
This section outlines the rationale, adaptation process, and design structure underlying the transformation of Kipley, Lewis, and Jeng (2012) internal OSPP diagnostic into a tool suitable for external, longitudinal coding. The aim was to preserve the theoretical integrity of Ansoff’s Strategic Success Hypothesis while enabling application in a context where direct access to firm insiders was not available.
Ansoff’s original diagnostic approach for assessing strategic alignment was significantly enhanced by Kipley, Lewis, and Jeng (2012), who developed the detailed and systematic Optimal Strategic Performance Position (OSPP) framework. The OSPP methodology represented a substantial advancement, providing clearer operational definitions and a structured variables assessing process. Building upon Kipley’s framework, this study further refines the assessment of Strategic Aggressiveness (SA) and Capability Responsiveness (CR), making the coding criteria more industry-specific and externally observable, thus enhancing both precision and practical applicability in strategic valuation.
From Managerial Self-Assessment to External Behavioral Coding
Kipley et al.’s OSPP framework was originally developed as an internal strategic diagnostic, designed for administration to senior managers with privileged insights into their organization’s structure, capabilities, and strategic behavior. While well-suited for internal planning and decision-making, this method is impractical for researchers seeking to analyze firm behavior retrospectively across multiple firms and years. To address this challenge, we developed an externally codable version of the OSPP that evaluates observable strategic behaviors and organizational signals to assess alignment.
This shift aligns with practices in behavioral strategy and strategic cognition, where researchers rely on externally verifiable indicators to assess constructs such as strategic posture, innovation intensity, and organizational adaptability (Durand & Vaara, 2009; Fiss & Zajac, 2006). Rather than depending on internal perceptions or confidential knowledge, our adapted framework focuses on firm actions, public positioning, strategic moves, and decision patterns that are visible and traceable in the external environment.
Ensuring Theoretical Continuity With Ansoff and Kipley
The design of the revised instrument remains firmly anchored in Ansoff’s Strategic Success Paradigm, particularly its emphasis on achieving coherence across three dimensions:
Strategic Aggressiveness must align with the external benchmark ETL, held constant across firms.
Strategic Aggressiveness and Capability Responsiveness
Internal Cohesion among Capabilities
To preserve the theoretical fidelity of these principles, we conducted a detailed mapping of Kipley’s original descriptors to extract their conceptual essence. Constructs such as “propensity to risk,”“flexibility of internal systems,” and “innovation aggressiveness” were translated into externally assessable indicators, such as boldness in public product pivots, strategic diversification, or talent acquisition strategies.
For instance, the original descriptor “firm structure” was operationalized as “how effective was cross-functional collaboration within the firm,” while “strategic differentiation” became “how assertively did the firm position itself against competitors in media or public communications.” This interpretive bridge ensures that our revised instrument maintains the functional role of the original constructs while enhancing observability and inter-coder reliability (Greve, 2006; Short et al., 2010). A full list of Kipley’s original descriptors is presented in Supplemental Appendix A.
Instrument Design and Longitudinal Coding Approach
The adapted questionnaire comprises 65 structured items distributed across three conceptual domains:
This section assesses the pace, unpredictability, and intensity of change in the external environment. The items in this section are retained directly from Kipley, Lewis, and Jeng’s (2012) original OSPP instrument and are not adapted or scored at the firm level. Instead, they are used to determine a single standardized ETL score, applied equally across all firm-year observations.
Example item:“How rapidly did technology in the industry become obsolete?”
Captures proactive strategic behavior, risk-taking, and efforts to disrupt or redefine industry boundaries.
Example item:“Did the firm pursue premium brand positioning in the market?”
Assesses the alignment of internal systems, strategic vision, leadership, and organizational infrastructure.
Example item:“How agile was the firm in responding to crises (e.g., supply chain shocks)?”
Each item was rated on a 5-point ordinal scale (1 = Very Low to 5 = Very High), reflecting the extent to which the behavior or capability was evident during the specified year. Items were deliberately framed using concrete, behavior-based language to improve interpretability, minimize coder bias, and enhance replicability.
It is important to note that while the ETL items were included in the coding form for reference and transparency, they were not scored separately for each firm. In line with Ansoff’s Strategic Success Paradigm and its implementation in Kipley, Lewis, and Jeng’s (2012) OSPP model, ETL is conceptualized as a standardized external reference level—not firm- or industry-specific. As such, a single, fixed ETL value was applied uniformly across all firm-year observations. This approach preserves theoretical fidelity, allowing each firm’s Strategic Aggressiveness (SA) and Capability Responsiveness (CR) to be evaluated relative to a constant environmental benchmark.
All 65 questions were administered via a structured Google Form, which is reproduced in Supplemental Appendix B. Coders completed the form independently for each firm—Intel and NVIDIA—across nine consecutive years (2015–2023). This resulted in a total of 18 firm-year evaluations per coder. The longitudinal structure of the coding process enables fine-grained analysis of how each firm’s strategic posture evolved over time in response to industry turbulence, innovation cycles, and competitive dynamics.
Benefits and Constraints of the Adapted Method
The primary advantage of this adaptation lies in its applicability to multi-firm, multi-year studies without requiring privileged access to internal firm data. It offers several methodological benefits:
Nonetheless, limitations remain. While many aspects of internal alignment can be reasonably inferred through observable behavior, this approach cannot fully capture private deliberations, informal structures, or deep cultural traits that may not manifest in the external environment. Constructs related to internal cohesion, in particular, may be more conservatively estimated than in studies involving direct managerial interviews or ethnographic methods.
That said, the distinction between internal and external descriptors may be less significant when the questions are carefully articulated. In prior work, Bonelli (2017) showed that well-crafted, behaviorally grounded descriptors can effectively translate qualitative insights into quantitative assessments, mitigating subjectivity and enabling more consistent comparisons across observations. This principle underlies our coding design: whether used internally or externally, clear, specific descriptors provide structure that anchors judgment and enhances objectivity.
This evolution also reflects a broader trajectory in the Ansoffian tradition. While Ansoff’s original strategic diagnostics employed relatively few items focused on high-level strategic orientation, the later development of the OSPP by Kipley et al. introduced a more granular array of descriptors across environmental, strategic, and organizational domains. Our current approach builds on this trend by expanding and refining the diagnostic set even further—enhancing the indicative value of each item and the diagnostic precision of the framework as a whole.
Despite inherent constraints, this approach offers a methodological bridge between normative strategy theory and empirical research. It provides a replicable and scalable tool for evaluating strategic alignment in high-turbulence industries using publicly observable evidence.
Empirical Models
To test H11–H13, we estimate monthly firm-month panel regressions using standardized variables: Strategic Posture
We regress monthly return (X4) on Strategic Posture (X1) and controls:

– Zit includes firm size, prior-month momentum, and sector dummy variables.
– αi and λt are firm and month fixed effects.
We add VIX (X3) and its interaction with Strategic Posture (X1):

A significantly positive β3 indicates that the payoff to strategic posture rises when market uncertainty is high.
We define a divergence dummy Dit = 1 if |X1it– X2it| exceeds its sample median, and Dit = 0 otherwise. Then:

We compare β3 and β4: if β3 > β4, then Strategic Posture (X1) better predicts returns than Analyst Ratings (X2) when the two measures diverge.
All models use firm and month fixed effects, include the same control set Zit, and report robust standard errors clustered at the firm level.
Independent Coding Procedure
To ensure methodological rigor and enhance objectivity, strategic posture assessments were conducted by three independent coders working autonomously and without access to the study’s hypotheses. Each coder evaluated both firms—NVIDIA and Intel—across nine consecutive years (2015–2023), resulting in 18 firm-year assessments per coder.
The coders were selected to ensure diversity of perspective and domain expertise:
In addition to these three independent raters, the study author
Each coder rated 65 items per firm-year using a 5-point scale, with standardized behavioral descriptors provided in the rubric. Note that while the ETL items appeared in the form for reference, they were not scored individually per firm, as the ETL value was fixed across all observations in accordance with the model. Coders were instructed to evaluate observable, year-specific strategic behavior without reference to performance outcomes, financial results, or forward-looking events.
Scores from the three independent coders were averaged per item to generate composite Strategic Posture (SP) scores. To evaluate inter-rater consistency, Krippendorff’s alpha was calculated across items, yielding a reliability coefficient greater than 0.85—indicative of strong agreement and methodological robustness.
This structured, blind-coded procedure—anchored in a detailed rubric and rating scale distributed to coders with the Google Form (Supplemental Appendix C)—enabled a replicable evaluation of strategic posture across firms and years, thereby strengthening the construct validity of the empirical analysis.
No personal data were collected from participants. All coders remained anonymous. The study involved publicly available secondary data only and did not require ethical approval under institutional guidelines.
Robustness Check—Coder D Versus Coders A–C Average
In addition to the three independent raters, the author (Coder D) independently conducted all firm-year evaluations to serve as an internal robustness check. We systematically compared Coder D’s Strategic Posture (SP) scores against the average SP of the three independent coders (A–C). Across the 108 firm-month observations, the mean difference was negligible (mean Δ ≈ –0.01), and the Pearson correlation between Coder D and the A–C average exceeded .98, indicating near-perfect consistency in both absolute scoring and month-to-month variations.
This strong alignment demonstrates that the coding protocol is robust, stable, and replicable, and further suggests that the careful training and explicit behavioral descriptors provided in the coding rubric significantly reduce subjective bias. Thus, while the use of multiple independent coders remains academically ideal for initial validation, these results indicate that future applications of this coding method could employ a single experienced coder without compromising measurement accuracy or consistency.
Measurement Validity and Reliability (Added)
Coder Training
Before formal coding, raters completed a calibration session using a hold-out year outside the study period to align interpretations of the 65 behaviorally anchored items. They also reviewed a two-page rubric with exemplars of high- and low-alignment behavior.
Inter-Rater Reliability
Agreement was assessed using Krippendorff’s α, calculated at the item level across the three independent coders. Results indicated strong reliability: α = .86 (95% CI [0.83, 0.89]) for Strategic Aggressiveness (SA) items and α = .85 (95% CI [0.82, 0.88]) for Capability Responsiveness (CR) items. Both exceed the conventional 0.80 threshold, confirming consistent judgments across coders.
Reconciliation Rules
When coders differed by more than one scale point on an item, the item was re-read and re-scored independently. Smaller differences were averaged, ensuring balance between coder independence and convergence.
Item-to-Construct Aggregation
Item scores were aggregated into SA and CR indices by taking the mean within each block. These indices were then compared against the fixed ETL benchmark to calculate alignment gaps. Misalignment penalties were applied following the rules in §3.6.1, and the resulting values were scaled to 5 to yield the final Strategic Posture score.
Factor Checks
Exploratory factor analyses (principal axis factoring with varimax rotation) confirmed that SA and CR items loaded primarily on their intended dimensions, with loadings >0.60. Internal consistency was also strong (ω = 0.88 for SA; ω = 0.87 for CR).
Ethics
All coding was based on publicly available secondary data. No human participants were involved; therefore, ethics approval and informed consent were not required (see Title Page statement).
Variables and Measures
This study investigates the relationship between strategic alignment and firm performance using four core variables: Strategic Posture (X1), Wall Street Analyst Ratings (X2), Market Volatility (X3), and Stock Performance (X4). Each variable is measured annually for two firms—NVIDIA and Intel—across a 9-year period from 2015 to 2023.
Strategic Posture (X1—Alignment Measure)
Strategic Posture was calculated annually for each firm based on the externally coded diagnostic instrument described in Sections 3.3 and 3.4. It captures the degree of alignment between a firm’s strategic behavior, internal capabilities, and its external environment along three dimensions:
To convert the absolute misalignment gaps into a unified score, each gap is mapped to a penalty coefficient (Penalty Coefficients for Misalignment). Gaps of ≤0.5 receive a coefficient of 0.80, gaps between 0.5 and 1.0 receive 0.65, and gaps > 1.0 receive 0.50. The two coefficients—Coef_SA for the SA gap and Coef_IC for the CR gap—are multiplied together and scaled by the maximum score of 5 to produce the final Strategic_Posture value. This approach operationalizes Kipley, Lewis, and Jeng’s (2012) gap-based scoring logic within the OSPP framework.
Strategic Aggressiveness and Capability Responsiveness were each measured on a 5-point scale via the 65-item coding instrument (Supplemental Appendix C). ETL was applied uniformly across all firm-year observations, consistent with Ansoff’s original paradigm. Coders, blind to the study’s hypotheses, rated each item independently; their scores were averaged to generate the composite dimensions, gaps, and ultimately the Strategic_Posture value, ensuring a rigorous, behavior-based assessment of alignment.
The full coded dataset (ETL, SA, IC items and Strategic_Posture values) is deposited in Mendeley Data (Bonelli, 2025).
Wall Street Analyst Ratings (X2—External Forecast)
Analyst sentiment was captured using annual consensus analyst ratings obtained from the Bloomberg Terminal (ANR <GO>). These ratings reflect buy-side and sell-side analyst expectations for each firm’s performance and strategic direction and are reported on a standardized 1 to 5 scale (1 = Strong Sell, 5 = Strong Buy).
Analyst ratings serve as a useful proxy for market-facing strategic perception, capturing external judgments of a firm’s expected competitiveness, innovation trajectory, and leadership credibility. Ratings were collected at the close of each calendar year to ensure proper temporal alignment with strategic posture data.
Market Volatility (X3—VIX Index)
Market volatility is measured by the CBOE Volatility Index (VIX), commonly referred to as the “fear gauge.” The VIX reflects the market’s expectation of 30-day forward-looking volatility, derived from the implied volatilities of S&P 500 index options (Whaley, 2008). For each month in our sample, we collect the month-end closing value of the VIX from the CBOE data feed and then standardize it (z-score) so that all our regressors are on a comparable scale.
Since the VIX is a broad measure of market-wide volatility and not firm-specific, its value is identical for both NVIDIA and Intel at each time point. In our models, X4 enters both as a main effect and—as specified in H12—as the moderator in the interaction term X1it × X4it.
Stock Performance (X4—Monthly Return)
The primary financial outcome variable is monthly stock return, calculated as the percentage change in a firm’s stock price over each calendar month, aggregated annually for descriptive analysis and plotted for trend comparison. Data were sourced from Bloomberg Terminal for both firms over the period January 2015 to December 2023.
This shift from traditional accounting-based measures (e.g., ROE, EBITDA) to market-based outcomes is supported by extensive empirical research showing a strong, statistically significant relationship between corporate strategy and stock market performance (Ball & Brown, 1968; Fama & French, 2015; Sloan, 1996). According to the Efficient Market Hypothesis (Fama, 1970), stock prices reflect all available information and serve as a real-time valuation of a firm’s strategic and operational decisions.
Key indicators such as earnings per share (EPS), return on equity (ROE), and free cash flow have long been associated with equity valuations (Barth et al., 2001; Easton & Harris, 1991). More recent work has confirmed that firms exhibiting consistent innovation, earnings quality, and strategic clarity tend to enjoy premium equity pricing (Damodaran, 2012; Penman & Yehuda, 2009). Conversely, strategic missteps or deteriorating fundamentals often trigger rapid market corrections, validating stock returns as a sensitive and forward-looking measure of performance.
Given this theoretical and empirical foundation, monthly stock returns represent a reliable and market-validated performance proxy for this study—particularly within the high-volatility, innovation-driven semiconductor sector.
Sample and Analytical Approach
The study’s sample consists of two high-technology firms—NVIDIA and Intel—analyzed over a 9-year period from 2015 to 2023, resulting in a total of 18 firm-year observations. For each firm-year, we collected and computed the following four key variables: Strategic Posture (X1), Wall Street Analyst Ratings (X2), Market Uncertainty (X3), and Monthly Stock Returns (X4). These variables were measured and validated as described in Section 3.6, using both primary coding instruments and Bloomberg financial data.
To examine the relationships among these variables, we employed a two-step empirical approach:
1.
We first generated descriptive statistics and correlation matrices to explore basic relationships among X1, X2, and X4. Pearson correlation coefficients were calculated to assess the strength and direction of association between variables. These analyses provided an initial indication of whether strategic alignment (as captured by Strategic Posture) and external expectations (as measured by Analyst Ratings) are associated with subsequent firm performance (as proxied by Monthly Stock Returns).
2.
To assess the explanatory power of Strategic Posture beyond that of Analyst Ratings, we conducted hierarchical regression analyses using JASP software. Analyst Ratings (X2) were entered as a control variable in the first step, and Strategic Posture (X1) was added in the second step to evaluate its incremental predictive validity for Stock Performance (X4).
All standard regression assumptions—linearity, independence of residuals, normality, homoscedasticity, and absence of multicollinearity—were systematically tested and confirmed. Results are presented with standard errors, confidence intervals, and tests of significance at p ≤ .05.
This analytical framework enables a systematic examination of whether firms exhibiting stronger alignment between environmental turbulence, strategic aggressiveness, and internal capabilities—as measured independently and externally—outperform their peers in terms of equity market returns. By comparing Strategic Posture with Analyst Ratings, this model highlights how internally coded alignment and external market expectations each relate to firm performance.
Pre-Analysis Plan and Data Handling
Timing and Alignment
Strategic Posture (SP) was coded annually for each firm based on observable behavior during calendar year t. Monthly stock returns were then aligned to SPit in the following year (t + 1) for the main specification to ensure temporal ordering. Analyst ratings were collected at year end and aligned to the same observation window. Robustness checks include placebo tests using leads and lags (e.g., SPitt2→ returnsit).
Corporate Actions
All return series are total-return measures adjusted for stock splits and dividends, obtained directly from Bloomberg. This adjustment ensures comparability across months and eliminates artificial jumps in measured returns.
Outliers and Missingness
Monthly stock returns were winsorized at the 1st and 99th percentiles to mitigate the influence of extreme market events. Sample sizes are reported for each specification. Missing analyst ratings were not back-filled; regressions are estimated on the available firm-month observations.
Control Variables
The baseline control set includes firm size (logarithm of market capitalization) and prior-month momentum. Robustness specifications add the Fama–French risk factors (MKT, SMB, HML, RMW, and CMA) to verify that the predictive value of SP is not absorbed by standard asset-pricing premia.
Diagnostics
Standard regression assumptions were systematically tested, including linearity, residual normality, and homoscedasticity. Variance inflation factors (VIFs) were calculated to assess multicollinearity and confirm the stability of estimates.
Analysis and Results
Table 1 reports descriptive statistics for Strategic Posture (X1), Analyst Ratings (X2), Monthly Stock Returns (X3), and Market Volatility (X4, VIX)—for NVIDIA and Intel over January 2015 to December 2023. Specifically, the Table reports the mean, standard deviation, minimum and maximum values for X1, X2, X3, and X4 for each firm.
Descriptive Statistics for Strategic Posture (X1), Analyst Ratings (X2), Monthly Stock Returns (X3), and Market Uncertainty (VIX, X4), Jan 2015 to Dec 2023.

Note. VIX Values Shared by both Firms.
Next, we plot each variable’s evolution over time to verify that X1 now exhibits meaningful year-to-year variation (addressing the flat-score issue identified by reviewers) and to compare its trajectory with X2, X3, and X4.
Figure 3 shows the time series of Strategic Posture (X1) for NVIDIA and Intel.
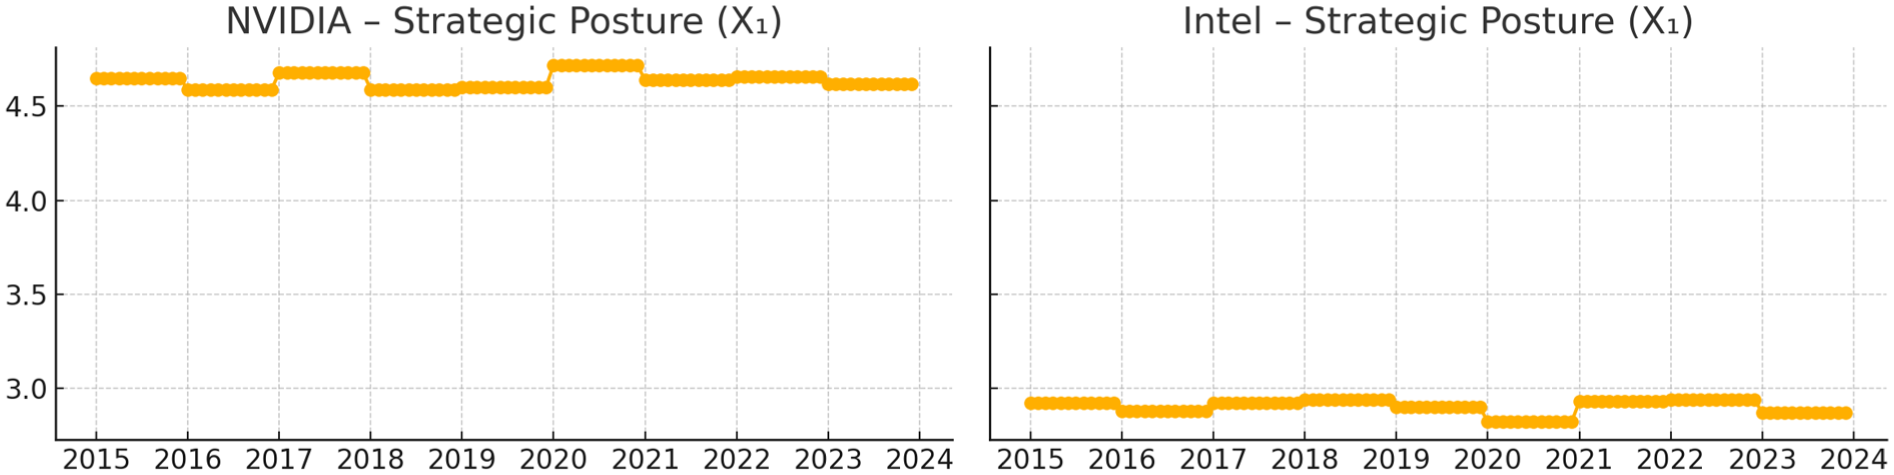
Strategic Posture (X1) over Time for (A) NVIDIA and (B) Intel (2015–2023).
Figure 4 displays the Analyst Ratings (X2) time series for each firm.
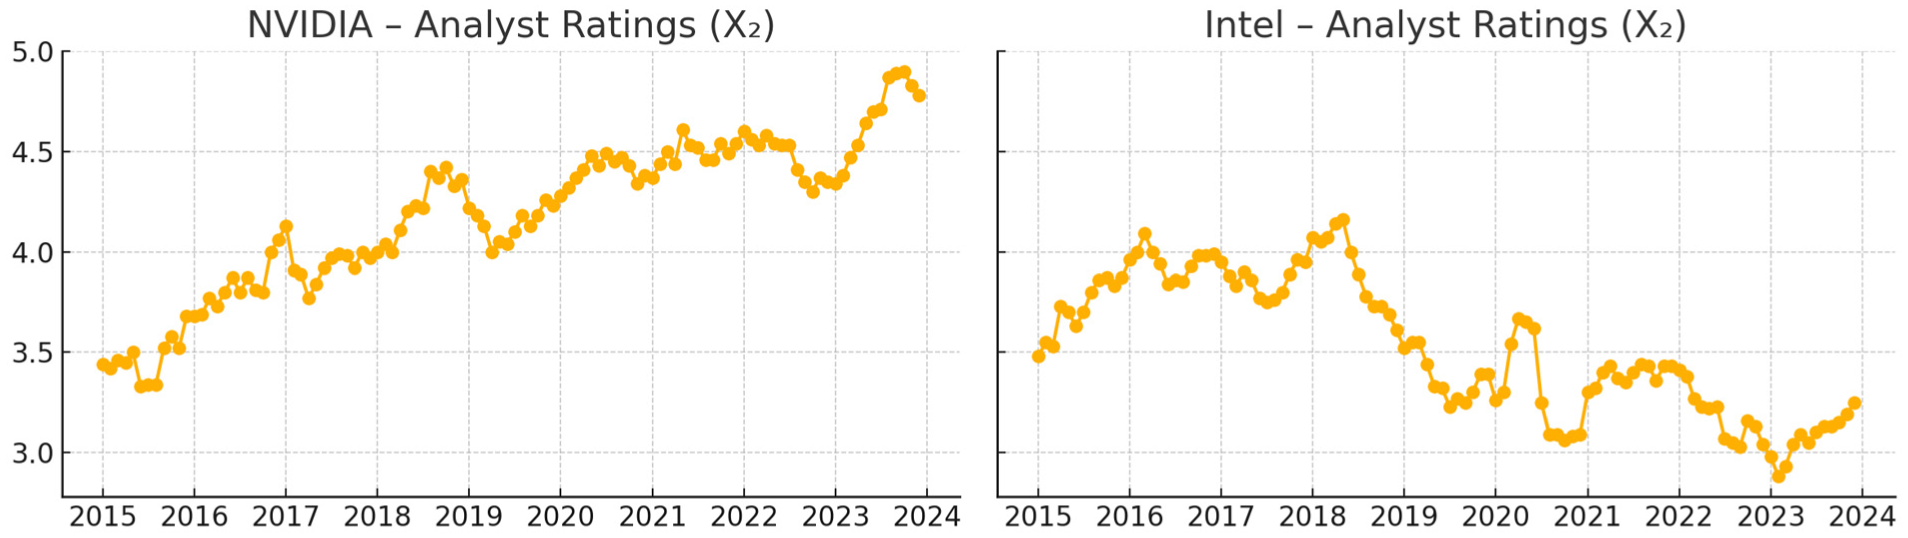
Analyst Ratings (X2) over Time for (A) NVIDIA and (B) Intel, (2015–2023).
Figure 5 presents Monthly Stock Returns (X3) for each firm.

Monthly Stock Returns (X3) over Time for (A) NVIDIA and (B) Intel, (2015–2023).
Figure 6 depicts Market Uncertainty (VIX, X4) over time for both firms.

Market Uncertainty (VIX, X4) over Time (Jan 2015–Dec 2023).
Time-Series Patterns
We now analyze the evolution of our variables over the sample period (2015–2023) using the time-series visualizations presented in Figures 3 to 6.
Monthly Stock Returns (X3) illustrated in Figure 5 highlight the volatility differences between the two firms. NVIDIA’s returns exhibit pronounced spikes and drops consistent with its aggressive strategic posture and high-risk, high-reward profile, notably capturing substantial gains in response to positive strategic news and sharp declines during market downturns. Intel’s returns, in contrast, remain relatively subdued, reflecting its less aggressive strategic stance and lower-risk profile.
Finally, Market Volatility (VIX, X4), presented in Figure 6, displays notable volatility clusters, particularly sharp increases in early 2016, late 2018, and the first half of 2020, the latter corresponding to the COVID-19 pandemic-induced market volatility. These heightened periods of market uncertainty provide critical contexts to test our hypothesis regarding the effectiveness of strategic posture under different volatility conditions (see Section 4.4).
Correlation Analysis
Table 2 presents Pearson correlation coefficients between our key variables—Strategic Posture (X1), Analyst Ratings (X2), Monthly Stock Returns (X3), and Market Uncertainty (VIX, X4)—separately for NVIDIA and Intel over the study period.
Pearson Correlations among Variables: Strategic Posture (X1), Analyst Ratings (X2), Stock Returns (X3), and VIX (X4) for NVIDIA and Intel (Jan 2015–Dec 2023).

Note. All correlations significant at p < .05.
Several important patterns emerge:
These correlations provide preliminary insights into the dynamics between strategic alignment, analyst perceptions, stock performance, and market conditions, setting the stage for further multivariate analysis in the subsequent section.
Multivariate Regression Analysis
We estimate firm and month fixed-effects panel regressions with standard errors clustered by firm:
Where Zit includes firm size and prior-month momentum. Robustness specifications add the Fama–French five factors (MKT, SMB, HML, RMW, CMA).
To test uncertainty moderation, we extend the model:

Here VIX ranges from 9.51 to 53.54 in the sample (mean = 18.81, σ = 7.30). A significantly positive β4 indicates that the payoff to strategic posture rises in high-volatility conditions.
Diagnostics
We verified assumptions of linearity, residual normality, and homoscedasticity. Variance inflation factors (VIFs) were all <2, indicating no multicollinearity. Residual plots showed no major violations, and Cook’s D identified no influential outliers.
Placebo and Anticipation Tests
(i) Placebo models using future posture (SPtt2) yielded null results, confirming temporal ordering.
(ii) To test whether analyst ratings anticipate posture, we regressed ΔSPtt1 on ANRt, finding no predictive power.
Marginal Effects
Figure 7 plots the marginal effect of Strategic Posture (SP) across levels of market volatility (VIX) with 95% confidence intervals. Because regressors are standardized, the simple slope of SP equals β1+β4VIXz. Using the Model 2 estimates (β1 = 0.22, β4 = 0.18), the simple slope at high volatility (+1 SD; ≈26.11 given mean 18.81, σ = 7.30) is b = 0.40, p < .05, while at low volatility (−1 SD; ≈11.51) it is b = 0.04, not significant (p > .10). These results indicate that the predictive power of SP strengthens under elevated volatility. Findings remain robust when substituting realized volatility, the Economic Policy Uncertainty (EPU) index, and the MOVE index for VIX. The 95% confidence intervals are displayed in the Figure.

Marginal Effect of Strategic Posture (SP) Across Levels of Market Volatility (VIX).
Table 3 reports the regression results for both the baseline and interaction models. Strategic Posture (X1) is a significant positive predictor of monthly stock returns in the baseline specification (β = .29, p < .01), while Analyst Ratings (X2) are not significant. Adding Market Volatility (VIX, X4) in Model 2 shows that volatility itself negatively affects returns (β = –0.12, p < .05), but the positive and significant interaction term (X1 × X4, β = .18, p < .05) indicates that strong strategic posture becomes more valuable under turbulent market conditions.
Regression Results: Monthly Stock Returns (X3) as a Function of Strategic Posture (X1), Analyst Ratings (X2), and Market Volatility (X4).

Note. Dependent variable = monthly total stock return (%). Firm and month fixed effects included. Standard errors clustered by firm. Size = log market capitalization; Momentum = prior-month return. Fama–French factors (MKT, SMB, HML, RMW, CMA) included in robustness checks. VIX = CBOE Volatility Index. N = 216 firm-month observations.
p < .10; **p < .05; ***p < .01.
Taken together, the regression models yield two main insights, summarized below:
Overall, the multivariate regression analyses provide compelling evidence supporting our hypotheses, demonstrating that Strategic Posture (X1) significantly predicts stock returns and that its predictive strength is notably enhanced during periods of market turbulence.
Robustness and Sensitivity Checks
We conducted several robustness analyses to verify that the main findings are not driven by specification choices or extreme observations.
First, we excluded observations in which the VIX exceeded the 95th percentile of the sample distribution. The regression coefficients remained substantively unchanged, indicating that the results are not driven by a handful of extreme volatility episodes.
Second, we re-estimated the models under alternative specifications, including random-effects estimators and combinations of firm-only or month-only fixed effects. Across these alternatives, the significance and direction of the Strategic Posture coefficients remained consistent with the baseline results.
Third, we clustered standard errors at the firm level to account for potential serial correlation within firms. The key predictors—Strategic Posture and its interaction with VIX—remained statistically significant.
Finally, we explored non-linear relationships by introducing quadratic terms for both Strategic Posture and VIX. These terms were not significant and did not improve model fit, confirming that the linear specification provides a parsimonious and well-behaved representation of the data.
Taken together, these robustness checks confirm that the predictive power of Strategic Posture, and its heightened effectiveness during periods of market uncertainty, is not an artifact of extreme cases or model choice.
Summary of Empirical Findings
The empirical analysis yields three consistent insights:
First, Strategic Posture (SP) is a statistically significant and positive predictor of monthly stock returns for both NVIDIA and Intel. The effect is notably stronger for NVIDIA, whose posture scores increased steadily with its pivot into artificial intelligence and data center markets, while Intel’s weaker and more volatile scores aligned with its relative underperformance.
Second, analyst ratings show only limited predictive power. Although they correlate modestly with Strategic Posture, they are statistically insignificant in multivariate regressions once posture is included, underscoring the limited incremental value of analyst consensus compared with strategy-based indicators.
Third, the interaction between Strategic Posture and market volatility (VIX) confirms that the benefits of alignment are amplified in turbulent conditions. While volatility itself depresses returns, firms with stronger posture are better able to convert uncertainty into opportunity. The marginal effects analysis shows that posture predicts returns most strongly at high VIX levels (b = 0.40, p < .05), while its effect is negligible at low VIX (b = 0.04, n.s.).
Together, these findings validate Ansoff’s proposition that strategic alignment enhances resilience and performance, particularly in uncertain environments. They also demonstrate that Strategic Posture provides forward-looking information not captured by conventional analyst ratings.
Discussion
The regression results can be better understood when viewed against the backdrop of major firm-level events. For NVIDIA, posture gains align with strategic pivots such as the 2016 launch of its Pascal GPU architecture, the 2017 expansion into data center and AI platforms, and the 2020 acquisition of Mellanox to strengthen ecosystem integration. These moves correspond with periods of upward shifts in SP scores and subsequent excess returns.
By contrast, Intel’s flatter and occasionally declining posture trajectory reflects manufacturing delays around 10 nm chips (2016–2019), frequent leadership transitions (notably the 2018 CEO change and the 2020 appointment of a new CEO), and difficulties sustaining competitiveness in high-performance markets. These events coincide with lower or stagnant SP scores and comparatively weak returns.
This alignment between coded posture shifts and observable strategic milestones strengthens the argument that Strategic Posture captures economically meaningful aspects of firm behavior. It also illustrates how posture provides information not fully incorporated into analyst ratings, which tended to lag these strategic inflection points.
From a theoretical perspective, these findings reinforce Ansoff’s Strategic Success Paradigm while also connecting to dynamic capabilities theory: NVIDIA’s ability to reconfigure resources and timing around innovation cadence, product-cycle shifts, and capital allocation supports its posture advantage. Conversely, Intel’s misalignment highlights the risks of internal frictions that slow adaptation in turbulent markets.
Second, the significant interaction effect between Strategic Posture and Market Volatility (X1 × X4) extends and enriches Ansoff’s original proposition by explicitly demonstrating the heightened importance of strategic posture during periods of market instability. This insight is especially critical, as it implies that firms possessing stronger strategic alignment not only perform better under normal conditions but also exhibit enhanced resilience and adaptability during turbulent times. Such firms appear better positioned to proactively leverage uncertainty, converting potential threats into strategic opportunities, thus validating Ansoff’s hypothesis regarding the alignment of strategic aggressiveness with external turbulence.
Third, our findings meaningfully contribute to behavioral finance literature by illuminating the persistent structural misalignment between strategic fundamentals and analyst sentiment. The evident disconnect—particularly noticeable for Intel—between internal strategic realities and external analyst perspectives underscores behavioral biases, including underreaction or anchoring to historical expectations. These biases create identifiable market inefficiencies and investment opportunities, suggesting a critical role for strategic analysis that integrates internal firm dynamics and environmental assessments into traditional financial analysis frameworks.
Furthermore, these results suggest important managerial implications. Leaders should recognize that strategic coherence and environmental alignment represent critical yet underutilized levers for enhancing firm valuation and investor confidence. Particularly in volatile markets, clear, proactive communication of strategic intent and execution may help bridge the gap between internal strategic realities and external market perceptions, potentially mitigating mispricing and enhancing shareholder value.
Collectively, these deeper implications substantiate the central hypothesis of our study: that Strategic Posture, operationalized through a structured coding framework, provides a superior, forward-looking predictor of firm performance compared to traditional analyst ratings. Moreover, this strategic advantage becomes particularly valuable in uncertain market conditions, emphasizing internal strategic coherence as a source of dynamic resilience and competitive advantage.
In the next section, we further explore the broader implications of these findings for strategy research, investment analysis, and organizational leadership.
Conclusion
This study applied Ansoff’s Strategic Posture Analysis as a forward-looking tool to predict stock returns and compared its performance with traditional analyst ratings. Using data from two semiconductor firms (NVIDIA and Intel) over 2015 to 2023, we addressed three research questions.
First, we found strong support for RQ1: firms with higher Strategic Posture scores achieved stronger monthly stock returns, validating Ansoff’s proposition that alignment between aggressiveness, capabilities, and environmental turbulence improves performance.
Second, in line with RQ2, the predictive power of posture was amplified during periods of elevated uncertainty, as shown by the significant SP × VIX interaction and confirmed through marginal effects analysis.
Third, addressing RQ3, posture outperformed analyst ratings in predicting returns when the two diverged, underscoring that strategy-based indicators capture information not fully reflected in market consensus.
These findings are deliberately bounded: they derive from two firms in a single industry and period. Broader generalizations should be made with caution. Still, the results highlight the value of systematically coding Strategic Posture as a transparent, replicable indicator that complements existing market-based measures.
The contributions are twofold. First, the study extends the Optimal Strategic Performance Position (OSPP) framework by operationalizing it externally, offering a replicable methodology for longitudinal coding. Second, it bridges strategic management and finance, showing that posture provides incremental predictive value relative to analyst ratings, especially under turbulence.
Future research should expand across industries, geographies, and time horizons, while integrating higher-frequency data and qualitative insights such as executive communications or discourse analysis. Investigating moderators such as organizational culture, leadership style, and institutional context would also clarify when posture has the greatest predictive power.
In closing, while bounded in scope, this study provides evidence that linking strategy and finance through posture analysis can enhance both academic understanding and practical decision-making for managers and investors.
Supplemental Material
sj-docx-1-sgo-10.1177_21582440251396527 – Supplemental material for Does Ansoff’s Strategic Posture Anticipate Stock Returns? Evidence From NVIDIA and Intel (2015–2023)
Supplemental material, sj-docx-1-sgo-10.1177_21582440251396527 for Does Ansoff’s Strategic Posture Anticipate Stock Returns? Evidence From NVIDIA and Intel (2015–2023) by Marco Bonelli in SAGE Open
Footnotes
Ethical Considerations
This study uses secondary, publicly available information and does not involve human subjects, experiments, or sensitive personal data. Therefore, formal ethical approval was not required.
Consent to Participate
Not applicable. No human participants were involved in this study.
Author Contributions
Marco Bonelli is the sole author and is responsible for the conception, design, data collection, analysis, interpretation, and writing of the manuscript.
Funding
The author received no financial support for the research, authorship, and/or publication of this article.
Declaration of Conflicting Interests
The author declared no potential conflicts of interest with respect to the research, authorship, and/or publication of this article.
Data Availability Statement
Supplemental Material
Supplemental material for this article is available online.
References
Supplementary Material
Please find the following supplemental material available below.
For Open Access articles published under a Creative Commons License, all supplemental material carries the same license as the article it is associated with.
For non-Open Access articles published, all supplemental material carries a non-exclusive license, and permission requests for re-use of supplemental material or any part of supplemental material shall be sent directly to the copyright owner as specified in the copyright notice associated with the article.