
Abstract
This article draws from grid-group cultural theory (GGCT) to develop a survey instrument that allows to take an “adequate snapshot” of the culture of an organization. It specifies GGCT’s typology into 15 dimensions, situated in the two-dimensional space defined by the cross-tabulation of the grid and group axes. Those 15 dimensions are operationalized in a questionnaire that is used in two consecutive studies: one in 64 local police forces in Belgium and one in a large ministry of the Belgian federal government. Confirmatory factor analyses largely corroborate the 15-dimensional model. Multidimensional scaling indicates that the 15 dimensions largely take the positions in the two-dimensional space that GGCT would expect them to take. Finally, latent profile analysis identified six cultural profiles (i.e., particular combinations of the dimensions) in the studied work units, showing the potential benefits of a configural approach to the study of organizational culture in public sector organizations.
Keywords
Introduction
Public administration has a long tradition of research into organizational culture (Jung et al., 2009). It has been used to explain performance (Brewer & Selden, 2000; Moynihan & Pandey, 2005), to explain success or failure of organizational change (Parker & Bradley, 2000; Schraeder et al., 2005) and more recently to address issues of diversity management (Noordegraaf & Vermeulen, 2010, p. 4). The concept has been conceptualized using various typologies, mostly drawn from research in the private sector (e.g., Quinn & Rohrbaugh, 1983). It has been measured in various ways, ranging from standardized surveys over interviews to ethnography. While the latter provide in-depth, nuanced and “thick” understanding of a culture in an organization, the former rather offer a snapshot. This article proposes both a conceptual framework and survey measurement instrument that allow researchers and practitioners to take such a snapshot of the culture of an organization or work unit within an organization. While limited to a snapshot, we will argue that it is an adequate snapshot. It generates a meaningful and theory-based profile of an organization that can easily be enriched with in-depth qualitative information using the same theoretical framework.
Smircich (1983) famously distinguished between research that considers organizational culture as a variable or something that an organization “has” on the one hand, and research that considers organizational culture to be a root metaphor or something that an organization “is” on the other. Like most quantitative survey-based research in organizational culture, the current article tends toward the former “culture as variable” view. It considers organizational culture as something that can be managed and changed, that can be impacted by particular antecedents (e.g., job characteristics, organizational structure) and that can generate particular outcomes (e.g., organizational performance or employee behavior). This perspective benefits from the typical advantages of quantitative research: it allows for breadth (allowing many people to give their view), anonymity of respondents, measurement that is not time-intensive, and statistical testing of hypotheses about its antecedents and effects (Jung et al., 2009, p. 1092). Inevitably, it also has its drawbacks. Alvesson (2013), for example, warns that this quantitative “culture as variable” view tends to come with a naïve “managerially-led unitary and unique culture (MUUC) view” (Alvesson, 2013, p. 179). While some disadvantages of the quantitative measurement of organizational culture are unavoidable, our approach does aim to avoid the main pitfalls of that “MUUC” view thanks to two basic choices. First, we opt for a configural or profile approach (Ostroff & Schulte, 2014). This approach assumes that the culture of an organizational unit consists of various substantive dimensions (e.g., rule orientation, self-interest, or internal consensus) that can each be measured. The combined measurements of these dimensions generates a pattern of scores that together constitute the cultural profile of that unit (Ostroff & Schulte, 2014). Hence, organizations are not expected to fit into one archetype, but instead to be described by a combination of scores on a number of dimensions. This offers a nuanced, complex view that is not only very different from the unitary view criticized by Alvesson (2013), but also from the “managerially-led” view that is exemplified by the lofty labels common in the more practice-oriented literature (Alvesson, 2013). Second, in order to identify the dimensions that we think are crucial to depict the culture of an organization, we will draw from grid-group cultural theory (GGCT). This theory was originally developed by the anthropologist Douglas (1970), but later applied in many other fields including public administration (e.g., 6, 2014; Hood, 1998; Lodge et al., 2010). Because it has been applied across many different areas of life, it provides a common language to describe both the culture within an organization and the environment that surrounds it, thus avoiding the naïve “uniqueness” view of organizational culture (Alvesson, 2013).
Building on an earlier study (Paesen et al., 2019), this paper first presents a conceptual framework consisting of 15 GGCT-inspired dimensions as well as a questionnaire, the Leuven Organizational Culture Questionnaire (LOCQ), to measure those dimensions. It then reports on two analyses to assess the quality of the “snapshot” this measurement instrument intends to offer. Those analyses are done on two separately collected datasets: 3,363 employees in 64 local police forces in Belgium (Study 1, see also Paesen et al. (2019)) and 1,927 employees of a Belgian ministry (Study 2). The first analysis investigates in both datasets whether the 15 dimensions indeed relate to each other as GGCT would expect them to. Specifically, it uses multidimensional scaling (MDS) to visualize the distances between the cultural dimensions and hence their relative positions. The second analysis assesses whether the study indeed delivers on the configural approach’s promise to offer a concise but nuanced and theoretically meaningful depiction of organizational culture. Specifically, it uses latent profile Analysis (LPA) to group work units according to their profile, that is, their combination of scores on the dimensions. This will result in a number of commonly occurring cultural profiles, not unlike the psychological profiles used in personality psychology. Suggestions will be made as to how these cultural profiles can be a starting point for further theorizing about the antecedents and outcomes of organizational culture.
Using Grid-Group Cultural Theory to Map Dimensions of Organizational Culture
“Organizational culture” is defined here as “[a] set of core values, behavioral norms, artifacts and behavioral patterns which govern the way people in an organization interact with each other and invest energy in their jobs and in the organization at large” (van Muijen et al., 1999, p. 555). This definition refers to two layers. It is the upper layer, artifacts and behavioral patterns, that can be measured in quantitative survey research (Ostroff & Schulte, 2014) and on which this study will focus. For the conceptualization of organizational culture, we will draw from grid-group cultural theory (GGCT). This approach has several advantages over other profile-based classifications such as the competing values framework (Parker & Bradley, 2000; Quinn & Rohrbaugh, 1981, 1983), the organizational culture inventory (Cooke & Lafferty, 1987) and the organizational culture survey (Denison & Mishra, 1995; Denison et al., 2005). In contrast to those other classifications, GGCT has been applied extensively in public administration and public policy (e.g., 6, 2003; Hood, 1998; Lodge, 2009; Maesschalck, 2004a) as well as in management and organization sciences (Logue et al., 2016; Patel, 2007; Patel & Rayner, 2012), providing ample inspiration for the operationalizing of the cultural dimensions. Moreover, because GGCT is embedded in broader social theory and applied in many parts of life other than organizational culture, it offers a source of hypotheses about the impact of antecedents in the broader social environment on organizational culture. Finally, GGCT’s origins in anthropology and its earlier applications in qualitative research on organizational culture (Altman & Baruch, 1998; Coyle, 1997; Maesschalck, 2004b; Patel, 2007; Philip & McKeown, 2004) will facilitate mixed methods research that combines the quantitative measurement proposed in this article with qualitative research.
At the core of GGCT is the “socio-cultural viability” hypothesis (6, 2003; Thompson et al., 1990), which implies that, for social units such as organizations to persist, they should combine cultural dimensions. Real-life organizations should not be seen as instances of a particular archetype, but as particular combinations or “settlements” (6, 2003) of various cultural dimensions. GGCT expects this “polyrational” or “clumsy” combination (Ney & Verweij, 2015; Verweij & Thompson, 2006) not only in large organizations, but also within smaller work units within those organizations. This implies a degree of ambiguity and nuance that is not often associated with quantitative research. GGCT’s typology is defined by the cross tabulation of two axes (“grid” and “group”), which results in four cultural dimensions. The “grid” axis refers to “the degree to which an individual’s life is circumscribed by externally imposed prescriptions” (Thompson et al., 1990, p. 5). The “group” axis is generally understood as “the extent to which an individual is incorporated into bounded units” (Thompson et al., 1990, p. 5). Combined, these two axes define four cultural dimensions as presented in Figure 1. We briefly describe the dimensions, starting at the top right-hand corner. In a hierarchist culture, employees’ life is strongly bound by rules and procedures. Each employee has his or her position in the hierarchy and should behave accordingly. In an egalitarian environment, the emphasis is on consensus-building through deliberation. Employees are all considered equal, and they maintain intensive contacts with each other. An individualist environment emphasizes competition. Employees pursue their self-interest and conflicts are addressed by negotiation. The fatalist dimension refers to a “passive” culture as opposed to the previous three more “active” cultures (Mamadouh, 1999). In such a culture, employees feel strongly bound by rules and prescriptions over which they have no control. They feel nobody can be really trusted and their main focus is on coping and surviving in this unpredictable environment.
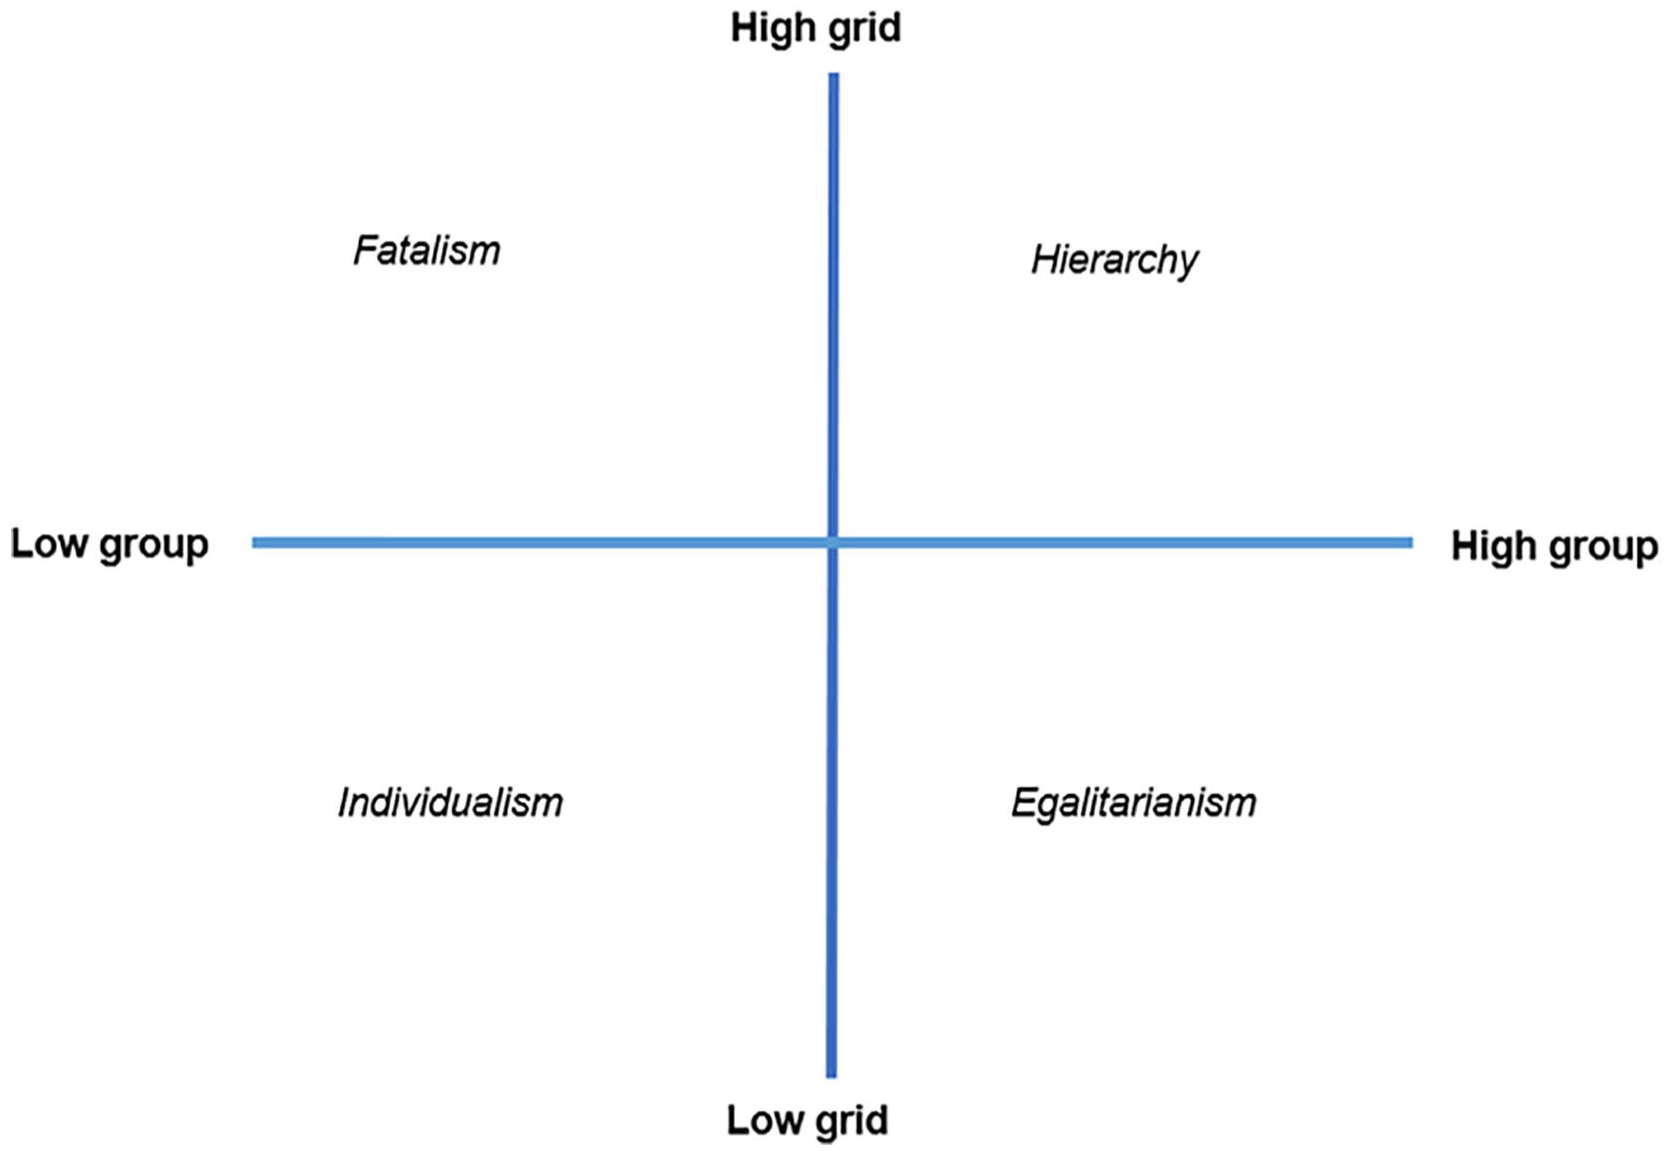
The two axes and four dimensions of grid-group cultural theory.
The typology in Figure 1 emphasizes the four corners of the diagram. This emphasis is most common in qualitative applications of GGCT, but can also be found in survey research (Dake, 1991; Swedlow et al., 2020). Wouters and Maesschalck (2014) used this fourfold distinction as a basis for a survey instrument to measure organizational culture, concluding that it was not sensitive enough to really capture useful variation between organizations. In order to develop a more sensitive instrument, Paesen et al. (2019) turned attention to the two axes, respectively grid and group, as is more common in survey research applying GGCT (e.g., Grendstad, 1999; Gross & Rayner, 1985; Kahan, 2012; Maleki & Hendriks, 2015). Specifically, and as depicted in Figure 2, the four corners were complemented with four additional positions situated on the axes that separate the four cells (e.g., high-grid/medium-group or the position inbetween fatalism and hierarchy).

The 15-dimensional framework of organizational culture based on grid-group cultural theory.
However, as can be seen in Figure 2, even those eight positions required further specification. Five of them are specified by more than one dimension. There is no single criterion that defines those additional dimensions. This reflects the specification by several authors (Douglas, 1978; Gross & Rayner, 1985; Rayner, 1979) of the GGCT typology as “polythetic” (Needham, 1975). This implies that the typology’s dimensions can be operationalized using various characteristics and that it is not necessary that all those characteristics are present in all observations. For example, while the three positions on the right-hand side of Figure 2 are further divided on the basis of the criterion “internal-external,” that is not (or only partially) the case for the other positions. Whether dimensions were considered necessary was decided on the basis of a review of existing measurements of organizational culture and climate as well as empirical tests of earlier versions of the framework (Paesen, 2019). The aim was to specify dimensions that are empirically meaningful while maintaining theoretical parsimony.
We briefly explain each of the types. Starting at the right-hand side of the diagram in the vertical middle, the medium-grid/high-group position is split up in an internally and an externally oriented dimension. The dimension “internal solidarity” refers to a shared perception among employees that they constitute a tightly connected group with a strong sense of solidarity. The dimension “organizational reputation” reflects the external aspect of this solidarity by emphasizing the importance of the organization’s image to the outside world. Continuing clockwise, the low-grid/high-group egalitarian position in the bottom right-hand corner also distinguishes between internal and external. The “internal consensus” dimension refers to a participatory culture aimed at consensus-building. Externally, egalitarianism here takes the form of the cultural dimension “citizen orientation.” This is an environment where employees are genuinely sensitive to the needs of citizens and where informal contacts with citizens are valued. Further continuing clockwise, the low-grid/medium-group position is taken by the cultural dimension “rule pragmatism,” the antipole to high-grid’s “rule orientation.” In a culture dominated by “rule pragmatism,” practical considerations will prevail over strict observance of rules and laws. The low-grid/low-group and hence individualist corner of diagram is also taken by only one cultural dimension: “results orientation and competition.” In such a culture, employees perceive a lot of competition among colleagues and a strong pressure to achieve results. The subsequent, medium-grid/low-group position has two dimensions, both of them referring to internal aspects. The first, “self-interest,” refers to an environment where employees mainly care for themselves, protecting their own individual interest over collective interests. The second low-group dimension, “internal distrust” refers to contexts where distrust reins not only between staff and management, but also among peers. The high-grid/low-group fatalist top left-hand corner has four dimensions. The external dimension is “distrust toward citizens.” In such a culture, employees experience citizens as untrustworthy, as adversaries who look for ways to obstruct their work. The three remaining fatalist cultural dimensions are all internal. In a culture dominated by the “organizational injustice” dimension employees tend to feel treated unfairly. When the dimension “weak supervisory support” prevails, employees report that they do not feel supported by managers, who do not provide help when it is really needed. Finally, in a “futility” dominated culture employees are frustrated because they cannot really make a difference. The top central position high-grid/medium-group is taken by the cultural dimension “rule orientation.” This refers to an environment where rules and procedures are considered important (Hood, 1998, p. 8). Finally, the top right-hand corner high-grid/high-group position refers to hierarchy. It has an internal (“internal positional authority”) and an external (“law enforcement orientation”) dimension. The former emphasizes stratified role differentiation (Gross & Rayner, 1985, p. 6) within the organization. In such an environment, employees are well aware of their formal position in the hierarchy and of the powers and limitations that come with that position. Authority is constrained by rules and is attached to a position, not a person. Finally, the dimension “law enforcement orientation” emphasizes compliance with the law by those external to the organization (and particularly citizens).
Methods
The Leuven Organizational Culture Questionnaire (LOCQ) operationalized the 15 dimensions of organizational culture into 50 survey items (Paesen et al., 2019). 49 items were identical in Study 1 and Study 2. One item had to be adapted slightly to maintain its relevance from “In my unit, employees feel that citizens are more inclined to obstruct police work than to help the police” in Study 1 in the police to “In my unit, employees feel that citizens are more inclined to obstruct our work than to help us” in Study 2 in the Ministry. Some of the 50 survey items were almost literally taken from existing measurement instruments and others reformulated or developed for the first time (see Paesen et al. (2019)). All survey items used the phrase “in my unit” to ensure that respondents focused on the shared norms and practices at the level of the work unit. For example, the dimension “internal consensus” was measured by items like “In my unit, we only make a decision when everyone is actually in agreement” and the dimension “self-interest” by items like “In my unit, employees mainly care about themselves.” The respondents were asked to apply these items on their organizational unit in an online survey on a 7-point Likert-scale with each of the seven points labeled, ranging from “strongly disagree” (1) to “strongly agree” (7). The online questionnaire presented the items in eight separate blocks, corresponding to the eight positions depicted by the dots in Figure 2. Within each of these blocks, the order of the items was randomized. Earlier research (Paesen et al., 2019) already largely confirmed the factor structure and the reliability of the 15 scales. The current article uses that same instrument to report on new analyses on two datasets.
For “Study 1” (Paesen et al., 2019), done in March to June 2017, 64 local police forces in four provinces in Flanders (Belgium)—varying in size from about 50 to 450 employees—participated. Within those 64 local police forces, all 8,003 employees (both sworn officers and civilian employees) were invited to participate. Of those 8,003, 3,363 (42.0%) responded and reached the end of the survey. Study 2 was done among a randomly selected sample of Dutch-speaking employees in one ministry (“Federal Public Service”) of the Belgian Federal Government in the same period. With the Belgian federal administration being bilingually French and Dutch, the survey was available in both languages. In this article, we will only report on the data of the Dutch-speaking employees so as to avoid inequivalence issues in the measurement instrument due to language. Of the 10,322 Dutch-speaking employees who received the e-mail request to fill out the survey, 1,927 (18.7%) responded and reached the end of the survey. The participating organizations were asked to assign each of the participating employees to one “work unit” (i.e., a group of colleagues, typically consisting of 2 to about 40 employees, who are (semi-)permanently assigned to the same organizational entity (Ingram et al., 2013, p. 371; Kozlowski & Bell, 2003, p. 334)).This resulted in 725 work units available for analysis in Study 1 (distributed across the 64 local police forces) and 927 work units in Study 2.
Results
Assessing Reliability: Confirmatory Factor Analysis
Paesen et al. (2019) already assessed the 15-dimensional organizational culture model by means of confirmatory factor analysis (CFA) for the dataset of Study 1. The CFA for Study 2 reaches very similar conclusions, using the same three indices to assess model fit: the Root Mean Square Error of Approximation (RMSEA) (Steiger & Lind, 1980), the Comparative Fit Index (CFI) (Bentler, 1990), and the Tucker-Lewis Index (TLI) (Tucker & Lewis, 1973). In both studies, the model is largely confirmed except for two items that turned out not be good indicators for the cultural dimension they were expected to measure. The remaining 48 items delivered a model with a good fit in both Study 1 (RMSEA = .041; CFI = .953; TLI = .946) and Study 2 (RMSEA = .040; CFI = .957; TLI = .951).
Exploring the Relative Positions of the 15 Dimensions: Multidimensional Scaling
Multidimensional scaling (MDS), here applied in SPSS 25, creates—based on a correlation matrix—a visual map displaying the distances between the different dimensions and hence their relative positions (Borg et al., 2013). This allows to assess whether the 15 dimensions indeed relate to each other as Figure 2 proposes. While the one-dimensional model had stress-1 values of 0.124 (Study 1) and 0.126 (Study 2), this dropped to 0.048 (Study 1) and 0.045 (Study 2) in the two-dimensional model, with no significant further gains with three- and four-dimensional models for both Study 1 (0.032 for the third dimension and 0.028 for the fourth) and Study 2 (0.032 for the third dimension and 0.026 for the fourth). Hence, the two-dimensional model is the most parsimonious one, as confirmed visually on the scree plot of eigenvalues. This two dimensional model was then developed by means of the PROXSCAL-option in SPSS (e.g., Garson, 2013; Goodwill et al., 2009). The result is presented in Figure 3. Originally, SPSS projected the low-grid position and the high-grid position on the top and bottom of the vertical axis respectively and the low-group position and the high-group position on the right- and left-hand sides of the horizontal axis respectively. This is the reverse of the traditional representation in the GGCT-literature and in Figures 1 and 2 above. In order to facilitate the comparison between the theoretical and empirical positioning of the cultural dimensions, the original figure was rotated. This “rotation” is not a statistical operation, but merely a different way of presenting. Figure 3 shows this rotated visual presentation.

Visual presentation of the MDS-analysis in Study 1 (left) and Study 2 (right).
Figure 3 shows that, in both studies, the horizontal axis captures GGCT’s “group” axis. The cultural dimensions that were hypothesized to be high-group (“internal solidarity,” “organizational reputation,” “internal consensus,” “citizen orientation,” and “law enforcement orientation”) indeed feature on the right-hand side of the axis, those hypothesized to be medium-group (“rule pragmatism” and “rule orientation”) feature around the center and those hypothesized to be low-group (“self-interest,” “internal distrust,” “results orientation and competition,” “organizational injustice,” “weak supervisory support,” “futility,” and “distrust toward citizens”) are situated on the left hand side. The only exception is the dimension “internal positional authority”: this was expected to be high-group but is, in both organizations, situated close to the center of the axis. Perhaps this is because some of its items (e.g., “In my unit, the decision-making power you have depends on your position within the organization and within the department”) can also be interpreted in a more fatalistic (and hence low-group) way. Figure 3 also shows that the vertical axis largely captures the “grid” axis. Indeed, the high-grid dimension “rule orientation” features at the top of the axis and the low-grid dimension “rule pragmatism” at the bottom, with the four dimensions hypothesized to be medium-grid (“internal solidarity,” “organizational reputation,” “self-interest,” and “internal distrust”) indeed situated around the center. However, Figure 3 also shows that the dimensions on the left-hand side are less spread out on the vertical axis than those on the right-hand side. Hence, the LOCQ instrument seems to be less precise in capturing the difference between fatalism and individualism than it is in capturing the other distinctions. Nevertheless, the relative position of the cultural dimensions on the left-hand side is largely as expected with dimensions expected to be fatalist (and hence high-grid) indeed situated higher on the “grid” axis than dimensions expected to be individualist (and hence low-grid). The only exception is the dimension “distrust toward citizens.” While this does take the theoretically expected high-grid position in the Ministry (Study 2), it features lower on the “grid” axis in the police (Study 1).
Using the Dimensions to Identify Profiles of Work Units: Latent Profile Analysis
GGCT’s sociocultural viability proposition implies that, within any given social unit, various dimensions will be present at the same time. While GGCT would expect the relative strength of those dimensions to be continuously waxing and waning (Thompson et al., 1990, p. 1), we do think it is possible to take a snapshot of the particular settlement between dimensions within a given unit at a given moment. This can be done by looking at the dimensions’ relative importance, as expressed, for example, by their mean score. Such a snapshot is the “Gestalt” or profile of that unit. Latent profile analysis (LPA) allows to group the work units in classes of units that share a similar profile (Ostroff & Schulte, 2014, p. 535).
Excluding units with only one respondent, the LPA can be done on 606 work units (spread across 64 local police forces) in Study 1 and 554 work units in Study 2. Such a large number of work units allows for analysis of many dimensions but unfortunately not all 15 dimensions, as this would unduly increase the risk that work units would incorrectly be assigned to certain classes (Ostroff & Schulte, 2014; Steinley & Brusco, 2011). Therefore, the number of dimensions is reduced from 15 to 12 for the purpose of this LPA. The dimensions to be merged were selected on the basis of the following considerations: (1) the dimensions should strongly correlate with each other (Ostroff & Schulte, 2014), (2) each of the eight positions (see Figure 1) should have at least one dimension, and (3) dimensions related to intra-organizational aspects should not be merged with those focused on external aspects. This resulted in the dimensions “organizational injustice,” “futility,” and “weak supervisory support” being merged into the new dimension “internal fatalism” and the dimensions “internal distrust” and “self-interest” being merged into the new dimension “medium-grid/low-group.” The first step in the analysis aims to identify the optimal number of classes in which the work units could be organized and hence the number of profiles to be identified. To decide on the appropriate number of classes, we used fit indices (the Bayesian Information Criterion (BIC), the Sample-Adjusted Bayesian Information Criterion (SABIC), and the posterior probabilities (Nylund et al., 2007)) as well as the bootstrap likelihood ratio test (BLRT). We combined that with the requirement that posterior probabilities should be larger than .70 as well as Araújo et al. (2019)’s criterion that each class must contain at least 1% of the total number of work units.
In Study 1 (see Table 1), the five class solution generated BIC, SABIC, and BLTR values that were lower and therefore better than those for the solutions with less classes, while in the six class solution there was one class with only one work unit. Hence, the five class solution was chosen. This was different in Study 2 (see Table 2), where it was the six class solution that generated BIC, SABIC, and BLTR values lower than those for the solutions with less classes. Also, the classes in this solution contain sufficient work units and the solution had a meaningful interpretation (in contrast to the seven class solution). Hence a six class solution was chosen for Study 2.
Fit Statistics for the Latent Profile Analysis in Study 1.

p ≤ .001.
Fit Statistics for the Latent Profile Analysis in Study 2.
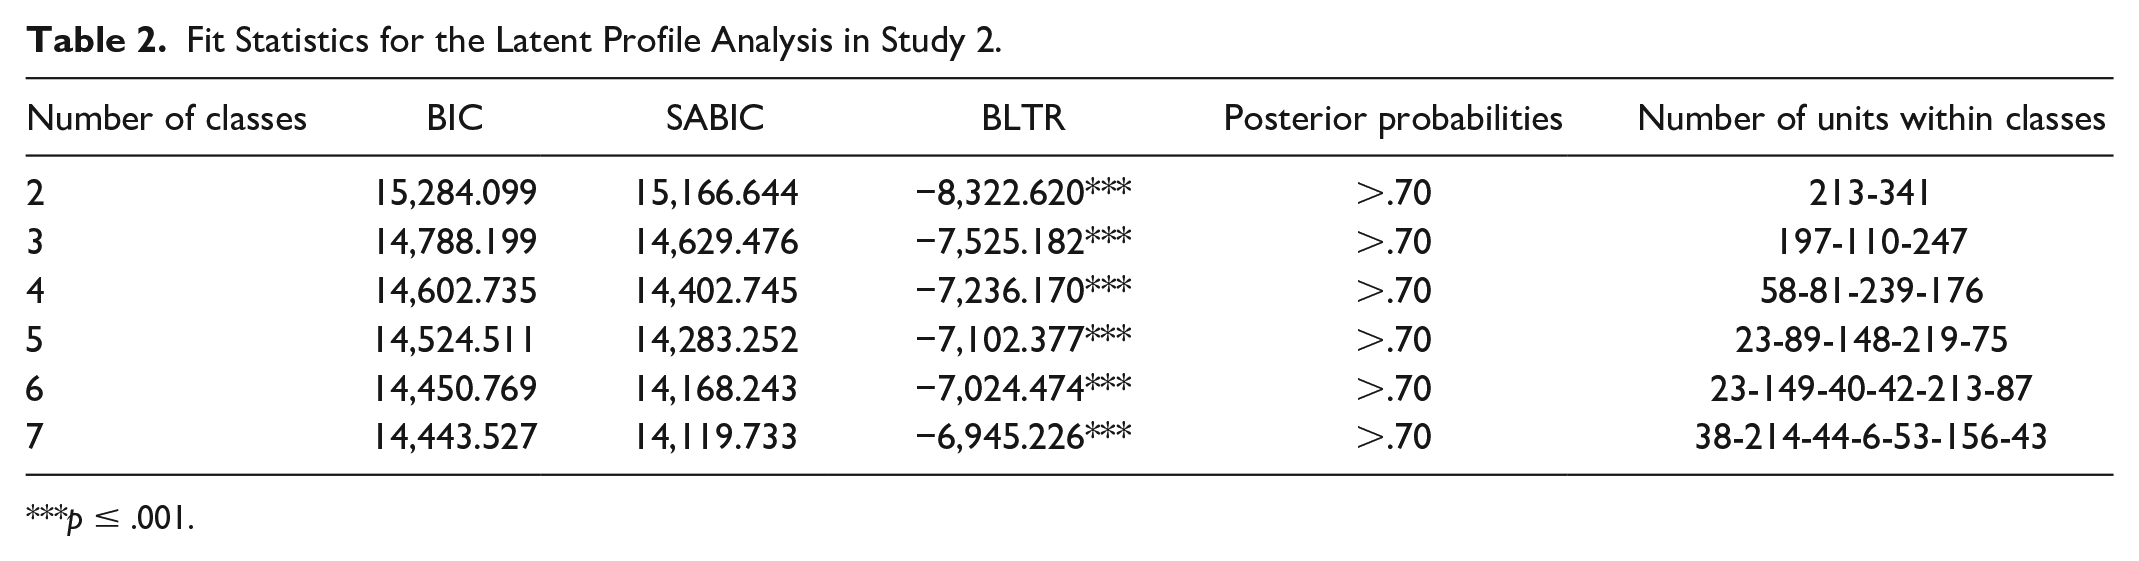
p ≤ .001.
The profiles of the identified classes are interpreted and labeled on the basis of their combined mean scores on the 12 cultural dimensions (on a scale of 1–7), as presented in Table 3. Table 4 specifies the number of work units within each class. The labels present the orientations that are most defining for each of the profiles. They refer to the corners of the original diagram in Figure 1 (hierarchy, egalitarianism, individualism, fatalism), not to the axes (grid, group) nor to the newly formulated dimensions in Figure 2. Nevertheless, they are assigned on the basis of the scores of the 12 dimensions that were defined by both the corners and the axes in the diagram.
The Mean Scores on the 12 Cultural Dimensions for Each Profile in Study 1 and Study 2.

Number of Units for Each Profile in Study 1 and Study 2.

A look at the actual profiles shows similarities between the profiles in both studies, with the exception of one profile that was only found in Study 2. First, units with the profile labeled “EGA” attach great importance to what GGCT would describe as egalitarian considerations such as the reputation of the organization, the relationship with colleagues and consensus decision-making. They also show little self-interest, internal distrust, internal fatalism, and distrust toward citizens. As Table 4 shows, this profile is the most common one in the police units of Study 1 and relatively uncommon in the Ministry units of Study 2. Second, the “HIER-ega-ind” profile somewhat curiously combines a strong dose of hierarchy with elements of egalitarianism and individualism. Clearly hierarchist are the emphasis on following rules and procedures and the reported power difference between managers and subordinates. Egalitarian considerations about solidarity and internal consensus also score relatively high as does the individualist emphasis on self-interest and internal distrust. Table 4 shows that this is the second most widespread profile in Study 1 and the most widespread in Study 2. Third, the profile “HIER-ind-fat” emphasizes hierarchy and, to a lesser extent, individualism and fatalism. In work units with this profile, employees strongly emphasize law enforcement and rule following, while also valuing good relationships with citizens. Meanwhile, good relationships with colleagues seem not that important. There is distrust between employees and an emphasis on pursuing self-interest. Employees in these units tend to feel treated unfairly and not supported by managers. This profile is relatively widespread in both organizations. Fourth, the profile “EGA+” resembles the EGA profile, but its egalitarianism-related dimensions score higher than in the EGA profile. In work units with this profile, the image of the organization as well as good relationships with colleagues outweigh considerations of self-interest. There is little distrust between employees and they generally feel treated fairly and supported by managers. Good relationships with citizens are also valued. Interestingly, respondents in these units also tend to emphasize a preference for hierarchy, particularly in Study 2. This profile is not widespread but still represents 14.7% of the units in Study 1 and 7.2% of units in Study 2. Fifth, in the units labeled “IND-FAT,” employees are mainly driven by their self-interest. They feel that they cannot trust management nor each other and that their work is of little use. They do not feel supported by management, whom they experience as distant and powerful. They report little internal solidarity and they often distrust citizens. This profile is found in only a few of the work units: 3.1% in Study 1 and 4.2% in Study 2. Finally, the profile “HIER-ega” was only identified in the Ministry (Study 2), where it was the most widespread profile (38.4%). In work units with this profile, employees emphasize law enforcement and rule following. They also attach great importance to the reputation of the organization and to good relationships with colleagues and citizens. Self-interest, internal distrust and internal fatalism score weak in these work units.
Discussion and Conclusion
As shown in the previous section, the confirmatory factor analysis in Study 2, like the one in Study 1 (Paesen et al., 2019), largely confirms the 15-dimensional model, although two items had to be removed from the remainder of the analysis. To that assessment, we added an MDS-analysis of the 15 dimensions. This projected the dimensions mostly where we expected them, although “internal positional authority” scored lower on the “group” axis than expected and the low-grid dimensions on the left-hand side of the diagram were less distinct than expected. Perhaps the latter finding has to do with the fact that both studies were done in typical public bureaucracies with limited room for the kind of entrepreneurial attitudes typical for the purely low-grid/low-group (individualist) quadrant. Further research in more competitive private sector organizations will help to assess this.
Latent Profile Analysis (LPA) identified six cultural profiles, five of which found in both studies and one only in the Ministry (Study 2). This identification of six cultural profiles could be the starting point of a research agenda aimed at identifying the antecedents as well as the outcomes of these profiles. First, as for the antecedents, GGCT would predict that it is social organization that shapes beliefs and values (Thompson et al., 1990) and hence culture. For example, one could hypothesize that units with a strongly individualist and fatalist social organization characterized by, say, unpredictability and a combination of significant de facto discretion and weak formal power are likely to have the IND-FAT cultural profile. The current dataset does not allow to test such hypotheses because the units were made unidentifiable for anonymity reasons and hence no information about their social organization is available. Yet, this is an obvious avenue for further research. Second, the research agenda could also propose hypotheses about the impact of organizational culture on particular outcome variables. These could range from performance indicators over staff retention rates to particular types of employee behavior. Patel and Schaefer (2009), for example, hypothesize that the four GGCT types are associated with particular types of ethical behavior and illustrate this with examples from the Indian business world. Similarly, in a classic study on workplace crime, Mars (1982) uses GGCT to hypothesize a connection between the culture of a particular occupation and the type of workplace crime that can be expected in that occupation. An occupation with fatalist characteristics, for example, might stimulate sabotage, while one with individualist characteristics will generate more entrepreneurial, self-enhancing types of fiddling. The configural approach proposed here would allow to quantitatively test the combined impact of various cultural dimensions. For example, what workplace crime can we expect in work units with the IND-FAT cultural profile: do we see the combined effect of Mars (1982)’s separate hypotheses for fatalism and individualism or is the whole more than the sum of the parts and does the combination have its own particular impact? Empirical findings will not only allow to test hypotheses deductively but are also likely inductively to generate new insights about the impact of particular cultural profiles on relevant outcome variables.
There are many ways in which these hypotheses can be tested. Most obviously, hypothesized antecedents and outcomes of the identified organizational culture profiles could be measured in surveys, after which the hypothesized correlations could be tested statistically. It is also possible to take a more dynamic approach by administering the LOCQ instrument at regular intervals in the same organization. With sufficient reiterations, this series of snapshots might turn into something more akin to a movie, allowing for a more dynamic understanding of the waxing and waning of the various cultural dimensions. This could be done by mapping the evolution of the relative importance of the dimensions, for example, by looking at evolution of the mean scores. It could also be interesting to look at the evolution of the profiles as a whole, the Gestalts. Do organizational units keep the same profile or do some units evolve over time from one profile to another? If such changes occur, can they be explained with reference to the antecedents suggested by GGCT and do they generate the outcomes GGCT would predict?
While providing an increasingly rich and dynamic picture of organizational culture, such research would still have the inevitable limitations of quantitative research. However, with GGCT deeply rooted in anthropology, the LOCQ instrument and the 15-dimensional model behind it can be complemented with qualitative research in mixed methods designs. This has been proposed before in GGCT research. For example, Swedlow et al. (2009) proposed to use Lieberman (2005)’s comparative nested cases approach to combine “the statistical analysis of a large sample of cases with the in-depth investigation of one or more cases contained within the large sample” (Lieberman, 2005, pp. 435–436). Researchers could, for example, decide to do interviews and observations in two typical work units for each of the identified cultural profiles. They could also focus on atypical units with a notable profile, such as the units labeled IND-FAT in our study. Such analyses could help to assess criterion validity of the survey instrument: does the rich information from interviews and observations confirm the snapshot that was provided by the survey? They could also offer additional information on how exactly the “settlement” between the cultural dimensions within that profile looks like and what impact that settlement has on various outcome variables. This understanding will further deepen if researchers can use a series of LOCQ measurements over time and if the qualitative case studies also take a longitudinal perspective. Such richer insights into the dynamics between the cultural dimensions and their effects can in turn generate new hypotheses that can be further tested in survey research.
This paper proposed an instrument to measure organizational culture that is firmly rooted in GGCT and particularly in its applications in public administration and public policy. It showed how the instrument generates a snapshot of the culture of an organizational unit that is far from the unitary, unique, reified view of culture that is often associated with the “culture as variable” view (Alvesson, 2013). This paper also contributed to the GGCT research tradition by proposing to focus on eight positions in the grid-group diagram and by suggesting to further specify those positions as needed depending on the topic. The MDS analysis showed that even if GGCT’s original two by two matrix is further specified into 15 different dimensions, those dimensions still largely appear along the grid and group axes and in the four corners as expected. This provides further evidence for the robustness and broad applicability of the grid-group map that is provided by GGCT. While earlier quantitative applications of GGCT focused on the cultural dimensions as individual variables, the configural approach used in the current paper looked at the combined scores of various dimensions to generate a profile. This opens a host of possibilities for further theory development and empirical testing. All this suggests that the LOCQ instrument, which can be filled out in about 10 minutes, indeed generates an adequate snapshot of the culture of a work unit.
Footnotes
Acknowledgements
The authors wish to thank Perri 6, Brendon Swedlow, and Marco Verweij for their many useful suggestions throughout the research process, as well as the anonymous reviewers for their helpful comments on the paper.
Declaration of Conflicting Interests
The author(s) declared no potential conflicts of interest with respect to the research, authorship, and/or publication of this article.
Funding
The author(s) disclosed receipt of the following financial support for the research, authorship, and/or publication of this article: This project was funded by the KU Leuven.