
Abstract
This study was motivated by the recent prevalence of valuation professionals utilizing EBITDA measures as part of their equity valuation strategies. To examine the impact of such valuation measures on share price variations, we developed a variant of the Ohlson valuation model that relates EBITDA, equity book values, growth, risk and negative earnings to share prices. We validated this relationship by utilizing the complete time-series data of the largest companies listed on the Johannesburg Stock Exchange from 1994 to 2017. We found that our model specification accounted for over 87% of the variance in the logarithmic-transformed share prices. Furthermore, the response coefficients for each explanatory variable were statistically significant, regardless of whether companies or sectors were incorporated as cross-sections. These findings have several significant empirical implications. Firstly, they demonstrate that EBITDA and equity book value variables significantly impact share price variations. Secondly, they lend credence to the hypotheses that growth and risk factors impact share price variations, and that negative earnings are value relevant. Ultimately, these findings constitute conclusive evidence of the empirical validity of the model specification we posit.
Keywords
Introduction
In recent years, several surveys of investment practice have indicated the widespread utilization of EBITDA (earnings before interest, tax, depreciation and amortization) as a valuation metric of choice among valuation professions when making their equity valuation decisions (e.g., Bancel & Mittoo, 2014; Pinto et al., 2019; Prusak, 2017; Vydržel & Soukupová, 2012). Although initially posited as an effective equity valuation strategy within the context of initial public offerings (IPOs) (Kim & Ritter, 1999), it is now becoming apparent that valuation professionals are relying on such EBITDA-based valuation metrics to perform their equity valuations across several other contexts as well. For example, Shaffer (2023) found that EBITDA-based multiples were the most commonly used valuation tool in merger and acquisition transactions. Pinto et al. (2019) reported that these trends were prevalent in several geographical regions of the globe, in both developed and emerging economies.
Zaremba and Szczygielski (2019) also observed that EBITDA was the best predictor of investment performance against other metrics for equity returns across countries’ equity allocations. Similarly, Steffen (2021) confirmed Gray and Vogel’s (2012) earlier assertion that EBITDA was a superior equity valuation tool. Several other researchers (e.g., Liu et al., 2002; Setiawan & Sumirat, 2021) have found that, since EBITDA is not affected by leverage, it permits meaningful comparisons of the financial efficiency of firms with different financing structures. In the same vein, Lyons (2022) and Rubio et al. (2021) found that EBITDA was not affected by various mixes of operating leases or even different industries. On the other hand, other scholars, have warned that, since EBITDA is typically considered a non-GAAP (generally accepted accounting practices) measure, which is typically not governed by accounting rules, it is susceptible to being utilized as an opportunistic earnings management tool by company directors (cf. Lyons’s, 2022; Mey & Lamprecht, 2021).
Nevertheless, the ongoing prevalence of valuation professionals utilizing EBITDA measures (Bancel & Mittoo, 2014; Pinto et al., 2019; Prusak, 2017; Vydržel & Soukupová, 2012) as an equity valuation strategy evokes pertinent questions about the supposed empirical validity of such input measures in fundamental analysis. Given the context of capital markets-based accounting research, it begs the question of what the empirical association is between intrinsic equity share valuations based upon such EBITDA measures and the market value of equity shares. Thus, in contrast to studies that have sought to examine EBITDA’s efficacy in relative valuation approaches (e.g., Barton et al., 2010; Gray & Vogel, 2012; Kim & Ritter, 1999; Lie & Lie, 2002; Schueler, 2020; Zaremba & Szczygielski, 2019), the aim of the study reported in this paper was to examine its efficacy within the context of an intrinsic equity valuation approach (cf. Yin et al., 2018).
This was done by exploiting a synthesis of the theoretical foundations of valuation theory and those of the related hypothesis of market efficiency to develop a model that relates EBITDA, equity book values, growth, risk and negative earnings to the market value of equity shares. To evaluate the empirical validity of the proposed model specification, a null hypothesis was developed, namely: There is no statistically significant relationship between EBITDA, equity book values, growth, risk and negative earnings when specified as explanatory variables, and the response variable of the market value of equity shares.
The study commences with a consideration of the analytical reasoning underpinning the Ohlson (1995) residual income valuation framework. This is followed by a reflection on its related variation, the Lintnerian (cf. Callen & Morel, 2000, p. 305) linear price valuation model of Collins et al. (1997). The purpose of both these deliberations was to logically relate EBITDA and equity book values to empirical equity share prices within an intrinsic equity valuation framework. In developing the proposed empirical model, these foundations were considered together with the implications of results of related studies in which the effects of growth, risk and negative earnings on equity share price variations have been evaluated (Basu, 1997; Collins et al., 1999; Ettredge et al., 2005; Hayn, 1995; Holthausen & Watts, 2001; Kothari, 2001).
Furthermore, empirical modeling issues that have dominated related prior capital markets-based accounting studies, as well as the relevant recent econometric and methodological approaches that could be applied to resolve such challenges, were examined. These particular aspects of the study are elaborated on in the conceptual and theoretical framework in Section 2 below and are further considered in Section 3, in which the adopted experimental model design, empirical data and the testing of the model specification assumptions are described. Here, an attempt was made to develop the most optimal empirical model specification to address the current research question. Thus, for the most part, a literary defense of the proposed stance was adopted. However, the study also entailed an empirical component. This empirical examination entailed validating the proposed model specification using complete time-series data of the largest multi-sector companies listed on the Johannesburg Stock Exchange (JSE) from 1994 to 2017. The results of the empirical analysis are presented and discussed in Section 4 below.
Conceptual and Theoretical Framework
Ohlson (1995) posited a valuation framework in which he related a company’s intrinsic equity value to a linear regression function of equity book values, residual income and a scalar variable representing other value-relevant information. In developing his model, Ohlson (1995) demonstrated that by initially reaffirming the foundational valuation principle of finance, namely that the value of a company is associated with the present value of expected future cash flows, and combining this with the assumptions of dividend irrelevancy (Miller & Modigliani, 1961), clean surplus accounting and linear information dynamic, the intrinsic equity market value of a company could be functionally related to the company’s accounting variables as follows:

where
and where
Ohlson (1995) pointed out that both
If one integrates the arguments proposed by Francis and Schipper (1999) in their second, third and fourth interpretations of value relevance with the logic of both Ohlson’s (1995) residual income valuation framework and Fama’s (1970) related hypothesis of market efficiency, it becomes feasible to countenance empirical evaluations of Ohlson’s (1995) valuation model within the context of equity capital markets. Indeed, in one of the widely-cited validations of a variation of the Ohlson (1995) model, Collins et al. (1997) did precisely this. Firstly, relying on the findings of an unpublished earlier manuscript by Maydew (1993), which they cited, Collins et al. (1997, p. 45) rationalized that, while the Ohlson (1995) model included the term
Consequently, Collins et al. (1997) transformed the Ohlson (1995) model’s risk-adjusted residual income variable and replaced it with the actual reported earnings variable, thereby ultimately relating a company’s equity share price around its financial year-end to a linear regression function of its earnings and equity book values as follows:

Given the Collins et al. (1997) price model specification, it is evident that the earnings component of the valuation model can be further transformed or disaggregated using the accounting equation to relate it to EBITDA, thus permitting empirical examinations of its relationship and that of equity book values, to share prices (Nhleko & Schutte, 2019). This methodological perspective has previously been hypothesized by authors such as Klimczak (2009), who reasoned that owing to its design, the Ohlson (1995) model specification readily lent itself to reformulation to fit the requirements of the research problem at hand. Furthermore, this model specification’s econometric equivalence to that of its return model counterpart (cf., Ota, 2003) enhances its practical versatility when conducting empirical examinations of hypotheses derived from it.
Some valuable insights consistent with the above perspective have recently emerged in the finance and economic literature regarding the empirical value relevance of EBITDA measures, based on examinations of hypotheses premised on Ohlson’s (1995) residual income valuation framework or its related variations. Two pertinent empirical studies that currently stand out in this regard are Stenheim et al. (2018) and Nhleko et al. (2020).
Stenheim et al. (2018) sought to examine the phenomenon of the value relevance of EBITDA and equity book values by utilizing a pooled price-levels Ordinary Least Squares (OLS) regression model. Examining a hypothesis derived from both the price and return model variants of the Ohlson (1995) model specification, coupled with a third variation that regressed only the equity share prices to EBITDA and other control variables, they collected quarterly data observations over 5 years, from 2012 to 2016 inclusive, from the Oslo Stock Exchange. However, during the empirical testing of their hypothesis, their efforts were hampered by several methodological drawbacks, the most fatal of which was, by their own concession, the significant uncontrolled attrition bias, which severely curtailed the practical significance of their results.
Nhleko et al. (2020), on the other hand, adopted an unconventional methodological approach relative to the majority of prior value relevance studies in that they opted to analyze and present their EBITDA value relevance results in annual cross-sectional regression panels. They maintained that doing so sufficiently confronted the complexities posed by time-series dependence. When applying a price model specification as a basis for developing and testing their hypothesis, the researchers ultimately demonstrated the value relevance of EBITDA and equity book values for companies listed on the JSE over a consecutive 23-year period, from 1995 to 2017. The reason for limiting the study to this time period was that this research received ethical clearance in 2018; therefore data was available only up to the end of 2017. Moreover, extending the study further would have been complicated by the effects of the COVID-19 pandemic, which caused an economic disturbance. The start date was informed by the fact that 1995 was the year in which South Africa harmonized its accounting standards with international ones.
While the latter researchers’ cross-sectional study provided relevant insights into the validity of EBITDA as alternative equity valuation input in lieu of traditional earnings performance measures, it remains unclear if such variables support the theoretical equity valuation model under a time series model. Moreover, although the empirical results of the vast majority of prior capital-markets studies seem to support Ohlson’s (1995) theoretical equity valuation model, several significant controversies have often surrounded their methodologies and analysis techniques. Firstly, a salient fundamental methodological conundrum has often been overlooked in many prior empirical value relevance studies in which the Ohlson (1995) or related model specifications have been utilized, namely that, owing to their formulation, these valuation models are time series by nature and are therefore more naturally tested in the time domain (S. C. Lee et al., 2013, 2014; Qi et al., 2000; Tswei, 2013).
Secondly, as has been amply demonstrated in several studies in which the stochastic properties of empirical financial and accounting time series data are examined, such time series are often non-stationary in their behavior (see, e.g., Fama & French, 1992; S. Lee et al., 2010; Qi et al., 2000; Wu et al., 1996).
Thirdly, in instances in which panel data models are applied, the presence of observed or unobserved common factors that cause interdependencies between the cross-sectional units or companies might lead to inconsistent, inefficient or biased estimates of standard errors and thus invalid inferences about the parameters of interest (Chudik & Pesaran, 2015; De Hoyos & Sarafidis, 2006).
Apart from the typical methodological and analysis challenges of capital markets studies mentioned above, the use of financial and accounting time-series data invariably leads to further modeling complications. Such complications typically emanate from the effects of scale, outliers and serial dependence for studies in which time-series data are examined, as well as the challenge posed by cross-sectional dependence for panel data studies.
Although the former scale effects challenge seems to have received a fair amount of attention from several researchers of capital markets-based accounting research over the years (see, e.g., Aledo Martínez et al., 2020; Barth & Clinch, 2009; Brown et al., 1999; Christie, 1987; Easton & Sommers, 2003; Gil-Alana et al., 2011; Gu, 2005; Kothari & Zimmerman, 1995), there still appears to be a lack of definitive consensus among researchers about empirical approaches to the treatment of this issue.
In terms of the issue of outliers, a survey of the conventional methodological approaches adopted in several related prior studies highlights an inherent inconsistency that arises as a result of commonly adopted empirical approaches to examining their treatment. It is evident from the general trend that the frequent, albeit controversial, knee-jerk reaction of many researchers is often to avoid complexity by eliminating the outlying cases.
A case in point is a position adopted by prior researchers of capital markets-based studies, such as Collins et al. (1997), Keener (2011), Qi et al. (2000), Gray and Vogel (2012), Belesis et al. (2020), and Boonlert-U-Thai et al. (2022), of arbitrarily excluding sectors from their empirical examinations, such as extreme observations, financial firms, utilities, real estate investment trusts, American Depository Receipts and closed-end funds. Therefore, while this common approach seems to afford some kind of practical compromise to the modeling challenges posed by outliers, the notable drawback is the consequential loss of empirical data observations during the elimination process—observation points that could otherwise provide potentially beneficial insights.
In addition, the econometric challenge posed by the impact of serial dependence has so far received little attention from researchers of capital markets-based accounting. Relatively few of such studies explicitly address the question of non-stationarity, with the few notable exceptions being a handful of authors in the recent past, such as Campbell and Shiller (1987), Bar-Yosef et al. (1996), Morel (1999), Myers (1999), Ahmed et al. (2000), Callen and Morel (2000), Qi et al. (2000), and Morel (2003).
Similarly, the impact of cross-sectional dependence has also not been sufficiently analyzed in related prior capital markets-based accounting studies in which panel datasets were used. In this regard, notable exceptions are authors such as Karathanassis and Spilioti (2003), Jiang and Lee (2005), Spilioti and Karathanassis (2012), and Tswei (2013), although the techniques the authors applied to correct the standard errors for cross-sectional and time-series dependence were not always made explicit.
Model Design, Empirical Data and Testing of Model Specification Assumptions
A panel data analysis approach was adopted in this study to evaluate the impact of EBITDA and equity book values to share prices based upon the foundations of a linear price valuation model. Karathanassis and Spilioti (2003) and Spilioti and Karathanassis (2012) highlighted the benefits of panel data models such as the one used in the study reported here to overcome the common methodological challenges associated with autocorrelation, multicollinearity and heteroscedasticity. As these authors further point out, this approach has been shown to facilitate the estimation of unbiased and efficient estimators, as well as to provide a significant number of degrees of freedom, which enable empirical researchers to overcome small sample problems associated with the estimation of the linear regression model due to the time dimension of the data.
Furthermore, as Canitz et al. (2017) demonstrated, an added benefit of panel data models is that, when modeling with non-stationary variables, the bias of panel estimates is lower than the bias of time-series estimates, even before any mitigation procedures for cross-sectional and time-series dependence are applied. Consistently with the recommendations of Gow et al. (2010) and Canitz et al. (2017), both time-series and cross-sectional dependence were evaluated and corrected by following a process of first-order differencing as a first step, and then applying the approach of Fama-Macbeth t-statistic with the Newey-West (1987) correction (FM-NW) estimation.
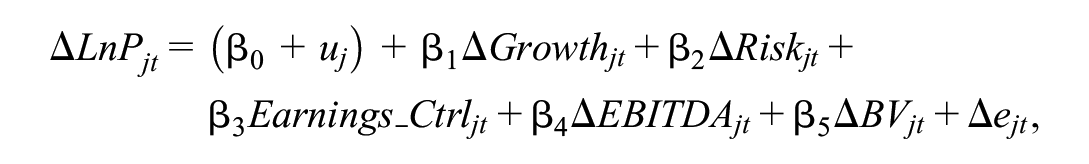
Therefore, in order to examine the equilibrium relationship of EBITDA, equity book values and other control variables posited herein to share prices, the current authors initially built on the price model specification of Nhleko et al. (2020), which was derived from a variant of Collins et al.’s (1997) price levels valuation model that relates the equity share price of a company to a linear regression function of EBITDA, the sum of interest, tax, depreciation and amortization (ITDA), and equity book values as follows:

where
When testing for the validity of the EBITDA equity valuation model, it was determined that both cross-sections (company and sector level perspectives) would be evaluated in order to gain in-depth insight into the empirical relationships between the model variables. However, since share price variations have previously been shown to be affected by growth and risk factors (Ettredge et al., 2005; Holthausen & Watts, 2001; Kothari, 2001), enterprise risk was modeled using the ratio of debt to equity and growth using the ratio of market value or total capitalization over equity book values, as in Ettredge et al. (2005). As with related prior empirical studies,
Furthermore, due to simultaneity in the data-generating processes of the sum of ITDA and EBITDA variables, as well as the high levels of multicollinearity between these two variables—which result in misspecification of the empirical model (i.e., high variance inflation factor or VIF), as shown by the findings of the initial analysis (not reported), which were consistent with those of Nhleko et al. (2020)—ITDA was removed from the model specification to arrive at the following regression model:

The target population was companies listed on the main board of the JSE as at the end of 2016. The initial sample consisted of the largest 100 of these companies based on their market capitalization as at the end of December 2016. Table 5 in the Appendix shows the list of companies included in the initial sample. In contrast to the sampling procedures of prior related research, no limitations were applied to remove sectors such as financial services companies, banks or information technology companies, which, as noted above, are often excluded as outliers by researchers who conduct capital-markets-based studies, albeit without a clear theoretical basis.
Empirical data were obtained from Iress Financial Markets and Profile Media, two companies that provide company and market information in South Africa. The collected data comprised annual panel time-series observations for equity book values, earnings per share, growth and risk indicators, and equity share prices for the 1994 to 2017 period. Since EBITDA data were either not readily available from either the Iress or Profile Media commercial databases, or were often not determined consistently across the disclosures provided by companies (cf., Mey & Lamprecht, 2020), these statistics were independently calculated from other information variables disclosed by the companies.
In order for a company to be included in the empirical analysis, it had to meet the criteria of having unbroken time series data for the variables of interest (EBITDA, the book value of equity, earnings per share, growth and risk indicators, and equity share prices) for the entire survey period, that is, from 1994 to 2017. Due to inherent survivorship bias, the result was that the final sample comprised 47 of the initial 100 companies. These criteria yielded a potential 1,128 company-level observations. To facilitate analysis by sectors as panels, sectoral or industry indicators were also utilized for each of the companies in the sample. On this basis, 20 sector groups emerged from the data analysis. This dataset constituted the primary focus for examining the validity of the proposed EBITDA equity valuation model.
However, to also examine whether shortening the survey period improved stationarity, as previously hypothesized by Myers (1999), a second subsample comprising a time series period that was arbitrarily reduced from 24 to 10 years was included. This subsample was drawn based on repeating the sampling procedures on the initial sample data and varying only the period. The result was that the subsample comprised an increased number of 69 companies over the 2008 to 2017 period, with the same 20 sector groups and 690 observations. Similar procedures for testing multiple regression and panel data assumptions, which were followed in the full survey period, as described below, were also applied to the shortened survey sample before the null hypothesis of non-stationarity could be evaluated. As indicated, however, the results reported below for testing the empirical model assumptions were for the full survey period, that is, 1994 to 2017.
Given the current study’s panel analysis approach, the total number of observations in both the full and the shortened survey period was considered sufficiently large. Moreover, it provided a significant number of degrees of freedom for estimating the linear regression model and making broader generalizations to the population; thus, mitigation procedures to address initial potential survivorship bias were considered unnecessary.
The latest version of the SAS program (SAS Institute Inc, 2020) was used to perform the analyses. As a first step, preliminary analyses were performed to evaluate the assumptions of normality, linearity, multicollinearity, and homoscedasticity. An analysis of distributions of the residuals of the OLS regression revealed that these were not reasonably normal, meaning that the assumptions of normality and homoscedasticity did not initially hold when running the model with the share price as the dependent variable. The normality was tested by a review of the results of the Shapiro-Wilk (SW) and the non-parametric Kolmogorov-Smirnov (KS) tests (not reported), both of which resulted in statistically significant values for all the years under review.
In an attempt to address the complexity mentioned above, contrary to using the lagged values of total assets or equity, as advanced by authors such Kubik-Kwiatkowska (2012) and Onali and Ginesti (2015), it was found that using the transformation of the natural logarithmic of the dependent equity share price variable—a procedure recommended by Tabachnick and Fidell (2014)—sufficiently addressed the empirical modeling issues associated with heteroscedastic disturbances of scale and normality as shown by a significant subsequent improvement in the test statistics indicated above. A similar intervention was adopted by Aledo Martínez et al. (2020) as one of their proposed techniques to control for scale. However, the results of its efficacy turned out to be surprisingly inconclusive in their setting.
With a view to determining the most appropriate model to fit the panel data, initial tests were performed to examine the empirical data for panel poolability, first-order correlation, panel cross-sectional dependence and panel stationarity. Panel data poolability tests were performed using an F test, an equivalence of the Chow test (Chow, 1960) extended to N linear regressions, to test for poolability across cross-sections in panel data models (see, e.g., SAS Institute Inc, 2015, pp. 1874–1875). The null hypothesis of poolability assumes homogeneous slope coefficients (Baltagi, 2001, pp. 51–55; SAS Institute Inc, 2015, 1874). In addition, Zellner’s (1962) Likelihood Ratio statistic was utilized to evaluate panel poolability in each cross-sectional perspective.
As seen in Table 1 above, both the results of the F test and Zellner’s (1962) Likelihood Ratio (LR) statistic indicated a rejection of the null hypothesis of poolability (i.e., the p-value, denoted by Pr > F or Pr > LR, smaller than .05) at both the company-level cross-section and the sector-level cross-section. This finding implied significant evidence of the presence of individual heterogeneity and, therefore, that the panel data were not poolable across all the periods and for all sectoral (company and industry) model perspectives. As a result, the pooled OLS model was considered inappropriate to evaluate the empirical model relationships.
Panel Poolability Test Results for a One-Way, Fixed Model (1994–2017).
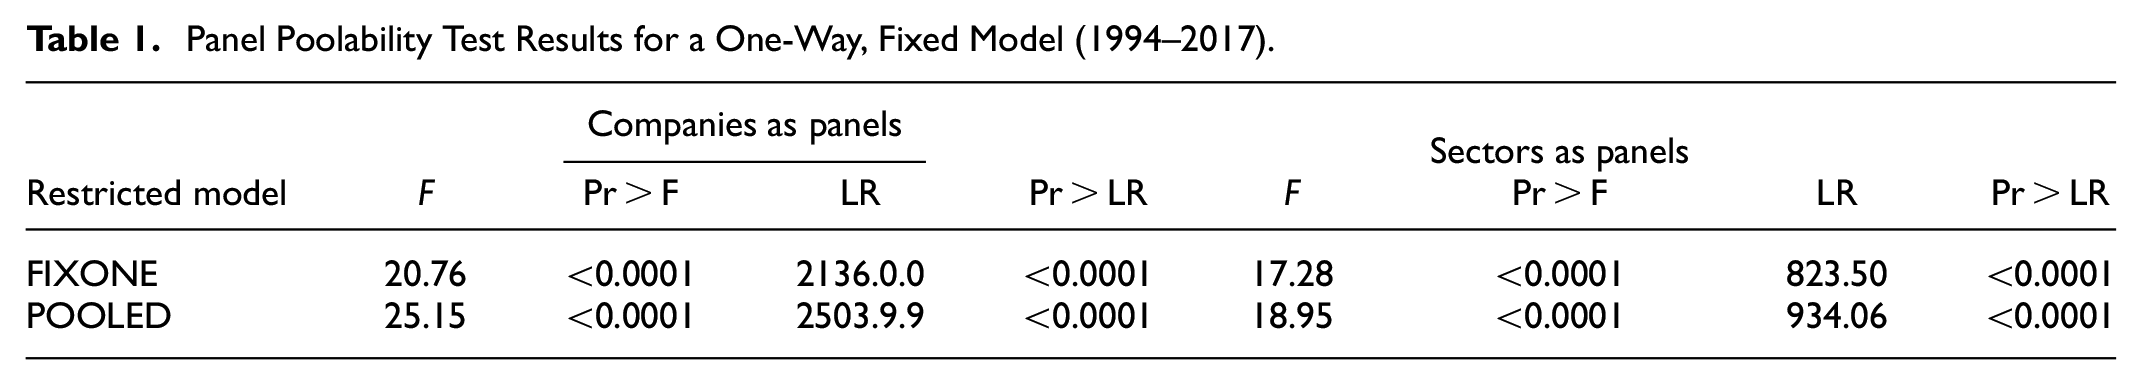
An examination of the F test for no fixed effects returned an F-value of 16.92 with a 1,053 denominator, 69 numerator degrees of freedom and a p < .0001 when using companies as panels. In the sector level cross-section, a similar significance level was reported, together with a comparable F-value of 8.95, 432 denominator and 42 numerator degrees of freedom. This finding implied the rejection of the null hypothesis of no fixed effects, which suggested the feasibility of either a fixed-effects or random-effects model (cf., Park, 2011, p. 50). However, given the study’s sampling methodology, a fixed-effects model solution was adopted. Consequently, it was considered unnecessary to further explore an empirical evaluation of the adopted fixed-effects model’s evaluation over its random-effects counterpart.
To mitigate against the risk of the misspecification of parameter estimates described in the literature survey above, tests were performed to examine for the presence of cross-sectional dependence, namely the Breusch and Pagan (1980) Lagrange multiplier (LM) test and the Pesaran (2004) CD and CDp test statistics. The Breusch-Pagan LM (BP’s LM) test requires a Lagrange multiplier (LM statistic) and tests the null hypothesis of zero cross-sectional error correlations (SAS Institute Inc, 2015, pp. 1875–1876). Similarly to the Breusch-Pagan LM CD statistic, the Pesaran CD test statistic is based on pairwise correlation coefficients (SAS Institute Inc, 2015, p. 1876). However, to enhance its power against the alternative hypothesis of local dependence, the Pesaran test also requires that the CDp test statistic can be utilized only if the cross-sectional units can be given an ordering that remains immutable over time (SAS Institute Inc, 2015, p. 1876).
Table 2 below contains the results of these test statistics across both the cross-sections, namely using both companies and sectors as panels. As shown in this table, all three test statistics indicated a rejection of the null hypothesis of zero cross-sectional error correlations at the 5% significance level (i.e., p < .05). These results implied significant evidence of the existence of panel cross-sectional dependence among the model variables.
Cross Sectional Dependence Test Results for a One-Way, Fixed Model (1994–2017).

The presence of time-series dependence was determined using three test statistics for serial correlation, namely the Baltagi and Li (1991) LM test, the Durbin-Watson (DW) statistic and the Bhargava, Franzini, and Narendranatha (BFN) (1982) Rho test statistic. The Baltagi and Li (1991) LM test statistic measures a white noise component in a fixed one-way model. In contrast, the DW and BFN are similar in that they each produce a region of uncertainty as to whether to reject the null hypothesis (SAS Institute Inc, 2015, p. 1891). Therefore, the test output contains both a lower uncertainty region (Pr < DWLower) that treats the uncertainty region as a rejection region, and an upper p-value (Pr > DWUpper) that is more conservative and treats the uncertainty region as a failure-to-reject region (SAS Institute Inc, 2015, p. 1891).
The test results obtained when using companies as panels indicated an LM statistic of 586.18, a DW statistic of 0.43 and a BFN Rho test statistic of 0.31. When sectors were used as panels, the test results were 254.50 for the LM statistic and 0.41 for the DW statistic, and a value of 0.28 was obtained for the BFN Rho statistic. All these statistics were significant at p < .0001, indicating a rejection of the null hypothesis of no serial correlation. Moreover, the null hypothesis of the unit root against a homogeneous stationary hypothesis was rejected based on Breitung’s unbiased test statistics.
To examine the hypothesis that shortening the survey period would improve stationarity (cf. Myers, 1999), panel stationarity procedures were repeated on the sample of the shorter survey period of 2008 to 2017. In accord with the results of the entire survey period described above, when companies were used as panels for this period, the LM statistic was 234.94, the DW statistic was 0.58, and a value of 0.37 was obtained for the BFN Rho statistic. All of these test statistics were significant even at p < .0001. Thus, although the reduction in the survey period appeared might have been expected to resolve the initial survivorship bias challenge mentioned earlier, the overall results were consistent across both panels.
Similarly, when sectors were used as panels for this period, the LM statistic was 52.19, the DW statistics was 0.80, and the BFN Rho statistics was 0.28, and all the test statistics were significant at p < .0001. Moreover, the results of Breitung’s unbiased test statistics indicated a rejection of the null hypothesis of the unit root against homogeneous stationarity. Therefore, it was evident that these results provided no support for the hypothesis that shortening the survey period would improve stationarity.
In light of the results of the diagnostic procedures described above, and also given that a parameter estimate of a dummy variable is a part of the intercept in a fixed-effect model (Park, 2011, p. 8), the adopted empirical panel model entailed a fixed-effects, one-way panel model based on the transformations of the first differences, denoted by
where
Empirical Results and Discussion
As stated in the introduction, this study aimed to evaluate the explanatory power or impact of EBITDA and equity book values in relation to share prices after controlling for the impact of growth, risk, and negative earnings. The statistical significance was predetermined at the 5% level. Table 3 below shows the model fit summaries for the EBITDA fixed-effects model for the 1994 to 2017 period.
Model Fit Statistics for a First Differences, One-Way Model, Newey-West Adjustment for CS Dependence (1994–2017).

The first row highlighted in bold contains the headings for both the models and the statistics being reported. Apart from the model descriptions in the first column, the second, third and fourth columns show the model statistics for the sum of squared errors (SSE), the mean squared error (MSE) and the square root of the mean-square errors (RMSE), respectively. The fifth, sixth and seventh columns indicate the R-square, F-ratio, and related statistical significance (p-value), respectively. The last two columns of this table contain the denominator (error) and numerator (model) degrees of freedom for the F-value.
As can be seen from these statistics, when the company-level cross-sectional perspective was applied, the overall model R-square statistic was 87.81%. However, varying the cross-sectional perspective from a company-level cross-section to applying a sector-level cross-section resulted in a marginal improvement in the model fit, as shown by the increase in the R-squared from 87.81% to 88.47%. Nevertheless, given either cross-sectional perspective, it was evident that the EBITDA equity valuation model fitted the data well because it could account for a mean value of approximately 88% of the variance explained by the logarithmic-transformed equity share prices.
An R-squared value of greater than 25% is often considered to imply a practically significant correlation between the dependent and independent variables (see, e.g., Ellis & Steyn, 2003; Pallant, 2016). As such, these empirical model fit statistics constituted unconditional support for the validity of the EBITDA equity valuation model. In addition, while these results appeared to complement those of Nhleko et al. (2020), the extent of the average variance in the share price of 88% explained by the EBITDA equity valuation model in this study was decidedly vast when contrasted to variances explained of between 42.1% and 72.8% (or between 39% and 71.4% on an adjusted R-square basis) reported in that study. Furthermore, the F-ratios of F(46, 1076) = 217.35, p < .0001 in the company cross-sectional model and of F(19, 455) = 228.78, p < .0001 in the sectoral cross-sectional perspective were both significantly large (i.e., R-squared different from zero) and statistically significant even at a 1% level.
Taken together, the results of the R-square statistics and the F-ratios imply that EBITDA and equity book value variables have a practically significant interconnection with the logarithmic-transformed equity share price variables, after controlling for the impact of growth, risk and negative earnings, together with correcting for cross-sections by their dummy variables. As a result, the null hypothesis of no statistically significant relationship between these variables cannot be sustained but has to be rejected in favor of the alternative.
What was also evident with regard to the model fit statistics reported in Table 3 was that using companies as panels resulted in an increased number of error degrees of freedom for the model (Den DF = 1,076), compared to when sectors were applied as cross-sections (Den DF = 455). On the other hand, it could also be seen that the sectoral-level cross-sectional perspective resulted in a better model fit, as indicated by a lower RMSE of 0.37 compared to that of 0.45 obtained under the company-level cross-sectional perspective. This finding could be interpreted to imply that, depending on the research question and objectives at hand, a measure of balance might have to be weighed between the choice of a company-level (companies as panels) and a sectoral-level (sectors as panels) perspective, unless both models have been evaluated, as was the case in the current study.
Table 4 below shows the parameter estimates for a first-differences, one-way model when both the company-level (companies as panels) and the sectoral-level (sectors as panels) cross-sectional perspectives were utilized.
Parameter Estimates for a First Differences, One-Way Model, Newey-West Adjustment for CS Dependence (1994–2017).

Since the test statistics for panel cross-sectional dependence reported earlier had indicated the presence of cross-sectional dependence for each of these perspectives, the results of the estimates reported in this table were obtained after applying adjustments using a Fama-Macbeth t-statistic with the Newey-West (1987) correction. However, inasmuch as the application of this procedure resulted in an improvement in the standard errors, it was observed that both the results of the classical (unreported) and the adjusted parameter estimates still seemed to converge toward similar inferences and conclusions, thus pointing toward the earlier argument regarding the fitness of the adopted model specification for the empirical data (cf., King & Roberts, 2015). The full model results (which include the CS dummy variables) relating to Table 4 are provided in Tables 6 and 7 in the Appendix.
The first column indicates the model variables. The parameter estimates for when the company-level perspective was adopted are in the second to fifth columns, which indicate the regression coefficients (estimates), their standard errors, the relevant t-value (as the ratio of the two previous columns) and the statistical significance (p-value) respectively. Columns 6 to 9 show similar statistics, but for when sectors were used as panels.
When the parameter estimates for each of the perspectives (i.e., company-level and the sectoral-level cross-sectional perspectives) shown in Table 4 were paired and contrasted, a distinct trend emerged, namely that all the model variables, including the control variables, were statistically significant at the 5% level (the absolute t-values are larger than more or less 2). In accord with the trends observed with the fit statistics, a change to a sectoral-level cross-sectional perspective signified an improvement in the parameter estimates for all the model variables compared with its company-level model counterpart. Under the perspective of using sectors as panels, the probability statistics for each of the model variables were all significant, even at the 1% level. This finding constitutes incontrovertible evidence of the validity of all the variables of the EBITDA equity valuation model specification used in this current study for the variance in the dependent logarithmic-transformed share prices.
An inspection of the t-statistics for the EBITDA and equity book value variables reported in the company-level cross-sectional perspective revealed clear evidence that these variables were almost equally significant in their contribution, or weighting, in terms of explaining the total variance in the dependent logarithmic-transformed equity share price. As the t-values for these variables, shown in Table 4, revealed one standard unit of change in the value of a book value variable resulted in a change of 2.43 standard units in the value of the dependent variable. Though higher than that of the EBITDA variable at 2.20, the impact of change in a single unit of the book value variable seemed to be more or less of a comparable scale to that of the EBITDA variable when companies were used as panels.
Everything else being equal, the results of the t-statistics shown for each of the EBITDA and equity book value variables could be interpreted to mean that each of these variables, namely EBITDA and equity book value, was more or less equally significant, given an intrinsic framework of equity valuation. Previously, researchers such as Francis and Schipper (1999), Collins et al. (1997), Ely and Waymire (1999), and Liu et al. (2014) had hypothesized that, over a given period, equity investors might change the focus of their equity valuation strategy from a financial position focus to a performance focus and vice versa. Moreover, the recent study by Nhleko et al. (2020) suggested that this was also the case with the EBITDA and book value variables, because their results indicated that these variables consistently complemented each other in their contribution to the total R-squared value over their review period.
Therefore, in light of the above, the findings regarding both EBITDA and equity book value being individually and more or less equally significant in the equity valuation model was somewhat surprising. At the same time, bearing in mind that the EBITDA valuation model’s theoretical foundations predict the equal contributions of each of the variances in the EBITDA and equity book value variables in relation to variance in the equity share prices, these findings should not be surprising.
However, when examining the t-values of these variables for the alternative sector view, as shown in column eight, a contrasting picture emerges in this regard. In terms of these statistics, the significance of EBITDA in the valuation model in relation to book value was heightened, since, in terms of this model, a standard unit of change in the EBITDA variable resulted in a 4.16 times impact on the dependent variable, compared to a 2.84 times impact given a standard unit of change in the book value variable (by holding all other factors constant). Not only was it a case of heightened impact, but, as alluded to above, the probability statistics also seemed to confirm the significance of EBITDA, given the reported p-value of less than .0001 when sectors were used as panels.
Thus, it was evident that the impact of EBITDA on the variances in the logarithmic-transformed equity share price was nearly 1.46 times that of the book value in terms of this model. This finding suggests that, while both variables are equally significant in accounting for the changes in the value of the share prices, the role that EBITDA earnings play is comparatively peculiar. Reasonable speculation might be that, given dividend payout expectations within a particular market sector, the noted significance of this variable could be linked to its potential predictive or explanatory capacity for dividends in both the short and long terms.
When analyzing the growth and risk variables, a definite peculiarity was the contrasting impact each of these variables had on the other in terms of the variance in the dependent variable in both the company and sector views. While a change in the growth unit resulted in a definite increase in logarithmic-transformed share prices, the impact of risk was decidedly negative. From the company-level cross-sectional perspective, an increase of a single standard unit change in the growth variable resulted in a 6.90 times increase in the dependent variable in standard units. In contrast, a unit increase in the value of the risk variable accounted for a decrease of 3.56 in the variance in the logarithmic-transformed equity share price.
By comparison, when the sectoral cross-sectional perspective was applied, it was clear that a single standard unit change in the growth variable accounted for a 4.82 impact on the value of the dependent variable, while a change in one unit of the risk variable resulted in a decrease of 3.31 standard units in the dependent logarithmic-transformed equity share price variable. In addition, the extent of the impact of a unitary change in the value of either of these variables in either the company-level or sector-level perspective was more pronounced than that of equity book values. Furthermore, the probability values attached to these variables in each of the company-level and sector-level perspectives were valid even beyond the 1% statistical significance.
The above trend implies that changes in growth and risk levels have a statistically significant impact on equity valuation. While an increase in the growth level has a positive effect, an increase in the risk level has a negative one. Not only is this evidence intuitively appealing, but this phenomenon has also previously been hypothesized by authors such as Holthausen and Watts (2001), Kothari (2001), and Ettredge et al. (2005). Therefore, it is evident that the results of this study in respect of growth and risk provide unconditional support for this hypothesis, indicating the strength of the EBITDA equity valuation model of this study in explaining relationships between the empirical accounting and financial data variables.
Authors such as Hayn (1995) and Basu (1997) previously hypothesized the significant effect of reported losses on the incremental value relevance of earnings over time. As previously indicated, the incidence of profit or loss was proxied with dummy variables 1 and −1, respectively. The results of parameter estimates relating to loss control variables reported in each of the company-level or sector-level perspectives were both highly statistically significant and had a significant bearing on the variance in the dependent logarithmic-transformed equity share price variable, as shown by both the t-values and the probability statistics. For example, as these estimates indicated, a t-value of 2.93 was reported for the model using companies as panels, while a value of 3.36 was reported for the sector level perspective.
The positive coefficient of the loss variable is consistent with that reported in the study by Collins et al. (1997). Therefore, the results of this study in this regard might be interpreted to indicate that an increase in the incidence rate of positive earnings over time has a statistically significant impact on equity share price variations, while the contrary also seems to hold true. Consequently, the results of this study lend further credence to Hayn (1995) and Basu’s (1997) hypothesis on the role of the incidence of reported losses on the incremental value relevance of earnings over time. Collectively, the current study’s findings further suggest the robustness of the EBITDA equity valuation model in explaining the empirical relationships between financial and accounting variables. Notably, since no other studies have been conducted to determine EBITDA’s efficacy within the context of an intrinsic equity valuation approach (except for Stenheim et al., 2018, whose study had serious methodological problems), these results cannot be compared with that of any other study.
Conclusion
The study reported in this paper weaved through several empirical methodological and econometric model specification issues of prior capital markets research in the quest to examine the impact of EBITDA and equity book values on equity share price variations after controlling for growth, risk and negative earnings, together with correcting for cross-sections by utilizing their dummy variables. The empirical results lend unconditional support for the validity of this model specification. In light of this evidence, the null hypothesis of no statistically significant relationship between the model variables could not be sustained. In particular, given that each of the explanatory model variables was indicated to have a practically significant impact on equity share price variations, the main take-home message of the current study is the robustness of the adopted empirical model formulation in explaining the nexus between empirical financial and accounting data variables.
This study makes several significant contributions to the related body of literature. Besides the primary contribution of providing conclusive evidence of the empirical validity of the posited empirical model specification, it demonstrates that both the EBITDA and equity book values are significant explanatory variables for share price variations. The research results also confirm the hypotheses that equity share price variations are affected by growth and risk factors, and that negative earnings are value relevant. Moreover, the results confirm the validity of the procedure of applying logarithmic-transformed equity share prices as a strategy for resolving heteroscedastic disturbances of scale. The results additionally contribute to the debate on the empirical testing of the price models by dispelling the hypothesis that shortening the survey period in capital markets-based accounting improves the stationarity of the time series.
Apart from the significant implications this type of research might have for users of accounting information, such as equity valuation professionals, it has also been indicated (see, e.g., Davern et al., 2019) that empirical evidence involving EBITDA measures should be of interest to accounting standard-setters such as the International Accounting Standards Board. To the best of our knowledge, no previous study has used the panel analysis procedures utilized in this study to examine the proposed relationships between EBITDA, equity book values, growth, risk and negative earnings, and the market value of equity shares.
Limitations and Recommendations for Further Research
The sample was limited to data observations from companies listed in the South African stock exchange, and as such, generalizations are limited. However, given the evidence of prevalence of utilization of EBITDA measures by valuation professionals across the globe mentioned above, there is a need for further research into its efficacy other jurisdictions as posited in this study.
Footnotes
Appendix
Parameter Estimates for a First Differences, One-Way Model, Newey-West Adjustment for CS Dependence With Sectors as Panels (1994–2017).

| Variable | Estimate | Standard error | t-Value | PR > |t| |
|---|---|---|---|---|
| CS1 | −0.37957 | 0.1121 | −3.39 | 0.0008 |
| CS2 | 0.13021 | 0.1166 | 1.12 | 0.2648 |
| CS3 | −0.28791 | 0.1270 | −2.27 | 0.0238 |
| CS4 | −0.0815 | 0.1090 | −0.75 | 0.4549 |
| CS5 | −0.39964 | 0.1111 | −3.60 | 0.0004 |
| CS6 | −0.52765 | 0.1114 | −4.74 | <0.0001 |
| CS7 | −0.66909 | 0.1126 | −5.94 | <0.0001 |
| CS8 | −0.54568 | 0.1097 | −4.97 | <0.0001 |
| CS9 | 0.072437 | 0.1136 | 0.64 | 0.5240 |
| CS10 | −0.31281 | 0.1099 | −2.85 | 0.0046 |
| CS11 | −0.74487 | 0.1114 | −6.69 | <0.0001 |
| CS12 | −0.70837 | 0.1086 | −6.52 | <0.0001 |
| CS13 | 0.014737 | 0.1417 | 0.10 | 0.9172 |
| CS14 | 0.481751 | 0.1335 | 3.61 | 0.0003 |
| CS15 | 0.230557 | 0.1313 | 1.76 | 0.0797 |
| CS16 | 0.07941 | 0.1118 | 0.71 | 0.4780 |
| CS17 | −0.11818 | 0.1145 | −1.03 | 0.3024 |
| CS18 | −0.74683 | 0.1108 | −6.74 | <0.0001 |
| CS19 | −1.10176 | 0.1285 | −8.58 | <0.0001 |
| Intercept | 3.501973 | 0.0942 | 37.17 | <0.0001 |
| Earnings_ctrl | 0.150114 | 0.0446 | 3.36 | 0.0008 |
| Debt_equity_ctrl | −0.00436 | 0.00132 | −3.31 | 0.0010 |
| Growth | 0.008509 | 0.00177 | 4.82 | <0.0001 |
| Book_Value_Share | 0.000066 | 0.000023 | 2.84 | 0.0048 |
| EBITDA | 0.000175 | 0.000042 | 4.16 | <0.0001 |
Acknowledgements
The authors wish to acknowledge the assistance provided by Ms C.Van Zyl for the language editing of the paper.
Declaration of Conflicting Interests
The author(s) declared no potential conflicts of interest with respect to the research, authorship, and/or publication of this article.
Funding
The author(s) received no financial support for the research, authorship, and/or publication of this article.
Ethical Clearance
Not applicable, no animal or human participants.
Data Availability Statement
Data will be provided upon request from the corresponding author.