
Abstract
This study examines whether investment analysts (sell-side) in Indonesia tend to prefer cash-flow-based valuation models over the accrual-based valuation model, how the accuracy of valuation models are used, and whether the use of both valuation models simultaneously for generating target prices can improve accuracy. The researchers conducted a comprehensive content analysis of 99 equity research reports for most companies listed in the LQ-45 index. The results show that in the accrual-based valuation model, in particular, the ratio of stock price to income (P/E) was the most popular valuation model that appeared in equity reports in all sectors. However, from the perspective of the valuation model as the producer of the target price (dominant valuation), discounted cash flow (DCF) was the most popular valuation model used. It was also found that the cash-flow-based valuation model gave the highest accuracy. In addition, the researchers also found significant results in the Chi-square test which showed the use of both valuation models simultaneously could improve the valuation results more precisely by the analysts. This was in line with the intuition that the accrual concept adds value to the relevance of the information to cash flow.
Keywords
Introduction
Analysts are important intermediaries in the capital market because they provide estimated earnings, recommendations, and target price for their clients (Clatworthy & Lee, 2017), their presence considerable as one among many pillars in the efficient capital market (O’Brien et al., 2017). One of the main contents of the analyst report is the target price which shows the analysts’ expectations of the stock prices of certain companies within 12 months. To produce target prices, they use various types of valuation methods. There are some ways or perspectives to classify valuation methods (Imam et al., 2013). For example, classifications based on the perspective of the accounting base which classifies the valuation model according to the accounting variables used in the model. This perspective will be the main perspective used in this study.
According to academic research in finance, the accrual model is more relevant than cash flow to evaluate company performance. However, cash flow is more reliable than earnings because accruals require judgment and estimation. The question arises regarding the level of analyst accuracy in generating target prices if they use the equity valuation method based on cash flow, accruals, or a combination of the two. It has predicted that they may produce different price forecast errors.
A study by Imam et al. (2013) revealed that each country had significant differences in equity valuation. Imam et al. (2013) explain that value perspective is the most popular classification. It classifies a valuation model into two types: absolute and relative value. Another popular classification is the period perspective which divides valuation models into two groups: single-period and multi-period models. Several previous studies also confirmed that the relevance of accounting numbers between countries varied greatly due to the legal system (Houqe et al., 2014), the level alignment of financial accounting and taxation (Christensen et al., 2013; Demmer et al., 2019), and the information asymmetry (Abhayawansa et al., 2015; Chen et al., 2016; Lobo et al., 2012). Consistent with this finding, Liu et al. (2002) showed that there was a considerable variation in actual earnings per share (EPS) performance across countries, mainly due to legal and accounting differences. Corporate earnings data in the United States and United Kingdom also showed a higher relevance than other countries in their sample. The accuracy of valuations based on actual EPS in Canada, Germany, and Japan was very low, while the performance of valuations based on earnings in France was quite accurate. The findings of Danbolt and Rees (2002) in six European countries (France, Germany, Italy, the Netherlands, Switzerland and the United Kingdom) revealed that the book-value accounting model worked relatively well for companies in the financial sector, while valuations based on large profits were more relevant in countries such as the Netherlands, the United Kingdom, and Italy than the other three countries in their sample. This finding is also supported by Schantl (2016) and Yin et al. (2016).
As previous researches had confirmed the relevance of accounting numbers and valuation accuracy which varied in each country, the present researchers also suspect that the analysts in the Indonesian capital market also have unique characteristics in terms of the valuation model used. Therefore, this research will focus on the Indonesian market to fill the research gap and contribute to the latest literature on the use of valuation models by investment analysts in the Indonesian capital market. Therefore, three research questions are proposed: (1) Which valuation model is more popular: the cash flow-based model or the accrual-based model? (2) Which model is more accurate in predicting stock prices? (iii) Does the use of the accrual-based model in conjunction with the cash flow-based model provide more accurate predictions than using each of these models independently?
Overall, this study indicates which accounting variables (e.g., accruals and cash flows) are more important in determining the value of companies in Indonesia. The researchers compare the use and accuracy of valuation models intending to gain a better understanding of how the analysts value companies in the Indonesian capital market.
Literature Review
Valuation is an estimate of the value of an asset based on variables considered to be related to future investment returns or which can be compared with similar assets. Valuation skills are a very important element of success in investing. Graham and Dodd (1934) attempted to organize knowledge in the area of valuation for the investment profession. They popularized the principle of value investing, including the practice of buying securities or assets at prices below their true value. They believed that valuation was the key to this principle.
To choose the right valuation model, equity analysts must be familiar with various valuation models. There are some ways or perspectives to classify a valuation model. Some of them are value perspective—the most commonly used one—which divides the valuation model into absolute (or fundamental) and relative (or multiple) values. Huang et al. (2014) and Stowe et al. (2007) explain that the absolute valuation model is a model that determines the intrinsic value of an asset, while the relative valuation model determines the value of assets relative to other similar assets. Other perspectives are based on the number of periods used which classifies the valuation model in a single-period model and a multi-period model.
Imam et al. (2013) classified accounting-based perspectives based on the accounting variables used in the model. Profit, cash flow, and book value are the three main accounting variables used in the valuation model. The profit is used in multiple earnings (e.g., P/E multiples), while the cash flow is used in discounted cash flow (DCF) and the book value is used in multiples of value (e.g., price to book-value multiples). Examples of earnings and book values used in one valuation model are residual income valuation model (RIVM) which use earnings and book values to generate predictions of residual income. In this study, the earnings and book value will be classified as accruals because their accounting nature is based on the same accrual accounting basis.
According to the existing research, the earnings variables are usually more relevant than cash flow to assess company performance. However, the cash flow may be more reliable than the earnings because the accruals require judgment and estimation. The use of cash flow as an alternative model is increasingly popular in many kinds of literature (Call et al., 2009; Chen et al., 2016; DeFond & Hung, 2003; Ho et al., 2016; Hui et al., 2016; Lundholm & Sloan, 2004; Salzedo et al., 2016).
Studies by Akbar et al. (2011) and Ernayani and Robiyanto (2016) show that the cash flow could have higher relative relevance than the earnings. Call et al. (2009) found that analysts who used earnings and cash flow estimates in their valuation models had more accurate results than those without cash flow estimates. This shows the consistency of research conducted by Penman (2001) and Deng et al. (2017) that cash flow was useful in validating earnings information that contains large accruals in it.
The advantages of several valuation models in practice and academic research are unresolved problems. In academic researches, studies relating to the multi-period model dominate the single-period model. Ashton et al. (2011) and Penman and Sougannis (1998) provided evidence that the RIVM produced more accurate estimates than the dividend discount model (DDM) and the DCF approach. Likewise, Francis et al. (2000) compared the level of accuracy of three different multi-period models and revealed that the RIVM model was superior to the other two. They found that the RIVM was significantly more accurate (absolute prediction error was 30%) than the DCF and DDM (41% and 69%, respectively).
While research by Demirakos et al. (2010) stated that the earnings multiples outperform the DCF model. Asquith et al. (2005) found that almost 99% of equity research reports mentioned that the analysts had used several types of income multiples (e.g., price-to-earnings [P/E] and earnings before interest, taxes, depreciation, and amortization [EBITDA] multiples). Conversely, only 12.8% used the DCF and 25% used the asset multiples. Also, Imam et al. (2011) also found that the analysts had used the earnings multiples in conjunction with the DCF model.
Surprisingly, in practice, the sell-side equity analysts prefer the single-period earnings model to the multi-period model (Asquith et al., 2005; Barker, 1999; Block, 1999; Bradshaw, 2002; Demirakos et al., 2004; Richardson et al., 2010). Ashton et al. (2011) and Block (1999) stated that the level of difficulty in estimating multiple periods in an uncertain business environment and estimating the appropriate discount rate made the multiple period model unattractive to the analysts. Imam et al. (2011) confirm the perceived limitations in the technical implementation of DCF which caused the analysts to rely on the relative valuation model (price multiples).
Conclusions in previous studies on the reasons for preference for certain valuation models are not conclusive. Although the sector is one of the important factors in choosing a valuation model as proven in previous studies (Demirakos et al., 2004; Imam et al., 2011), it is possible that the analysts covering similar sectors also use different models (Liu et al., 2002). This indicates that it is only a matter of preference whether users want to do calculations based on the earnings or cash flow (Lundholm & Sloan, 2004).
The academics also argue that the use of certain valuation models by the analysts depends on their preferences whether to see from the perspective of shareholder value or the perspective of the value of the company (Huang et al., 2014; Lundholm & Sloan, 2004). Also, empirical evidence also shows that several models are preferred at certain economic stages and business cycles, although some models such as P/E multiples remain important. This indicates that market conditions influence the preference of valuation models. Therefore, investigations on the use of valuation models in the Indonesian capital market can contribute to this literature.
Hypotheses Development
In this study, there are six hypotheses related to the valuation model used by the analysts and the accuracy of the model. The first three hypotheses focus on the popularity of the valuation model (accrual vs. cash flow). The last three hypotheses focus on the popularity and accuracy of the valuation model. Except for the first hypothesis, all remaining hypotheses focus entirely on the dominant valuation model. The dominant valuation model is the main model used by analysts to produce direct target prices. The opposite of the dominant valuation model is an additional valuation model (or sometimes called as an alternative valuation model), which means a model that is not used by the analysts to produce target prices but is presented in their reports only to inform readers.
Previous research by Bradshaw (2002) and Yin et al. (2016) showed that valuation models with simple single periods (e.g., P/E and price-to-book value [PBV]) remained the most popular valuation techniques used by the analysts. However, other studies (Demirakos et al., 2004, 2010; Imam et al., 2011) showed changes in the use of different valuation models and evidence of an increasing preference for cash-flow-based models that were more complex, specifically DCF to generate target prices. Therefore, it is predicted that the accrual-based model will be the most mentioned regardless of whether the model is used for the target price or not. As for the cash-flow-based model (especially DCF), it is predicted that the analysts will use it as the dominant valuation model:
Previous researches provide evidence that the cash flow provided information about the company performance that was not included in the current earnings. Abhayawansa et al. (2015), Clatworthy and Lee (2017), DeFond and Hung (2003), and Hui et al. (2016) showed that demand for cash-flow-based models increased when information about earnings was not enough to value the companies. Call et al. (2009) also showed that the cash flow estimate was very complex because they involved the use of various information from financial reports, industry data, and macro-economics. This should lead to a better level of accuracy because the analysts gain a deeper understanding and broader perspective on the company they are analyzing. This also supported by Hui et al. (2016). Therefore, the hypothesis that can be proposed is as follows:
Imam et al. (2011) and Yin et al. (2016) showed that although the P/E multiples were the most commonly used relative valuation models, they were almost always used in conjunction with other valuation models, such as DCF. Furthermore, Call et al. (2009) and Schantl (2016) stated that the earnings estimates were more accurate when the analysts also estimated the cash flows simultaneously than when they only issued the earnings estimates. Therefore, it is expected that the analysts who use both models simultaneously to produce target prices will increase the accuracy level of valuations. For this reason, two hypotheses can be proposed as follows:
Data and Method
This study used comprehensive content analysis to test (1) which models were the most frequently used by Indonesian equity analysts, (2) which models provided a higher level of accuracy of price estimates, and (3) whether the use of cash-flow-based models and/or accrual-based model increased the level of accuracy of price estimates. According to research conducted by Imam et al. (2013), content analysis was used in some studies that study the analyst research reports. The sell-side equity analysts provided a very useful research report for the capital market world as a source of current information (see Table 1). These reports provided in-depth information about the industry and the company along with their estimated earnings, target prices, and recommendations of each company.
A Valuation Model Classification and Its Short Description.

Note. P/E = price to earnings; PEG = price to earnings growth; PBV = price to book value; EVM = enterprise value multiple; EBIT = earnings before interest and taxes; EBITDA = earnings before interest, taxes, depreciation, and amortization; p/PPOP = price to pre-provision operating profit; RIVM = residual income valuation model; P/CF = price to cash flow; DCF = discounted cash flow; DDM = dividend discount model; NAV = net asset value; ROE = return of equity; COE = cost of equity.
This study used the Chi-square test to test the third hypothesis—whether the use of the cash flow in conjunction with the accrual-based model significantly corrected the forecast errors. The Chi-square test was used to determine whether there was a significant difference between the expected and observed frequency in one or more categories. They would be the number of target prices achieved (and not achieved) in a report that used (and did not use) cash flow and accrual basis simultaneously. The formula is as follows:

Multivariate analysis such as regression analysis used for the robustness checking, with deviation as a dependent variable and valuation method (1 if using the cash-flow-based models, 0 if not).
By using the Bloomberg database available through the Bloomberg Terminal, samples of equity research reports were collected. The reports written mostly by leading local and international brokers in Indonesia included the largest blue-chip companies, all of which were included in the LQ-45 index (early 2015). Only specific equity research reports for companies available from January 2014 to December 2014 were selected. In the case of more than one report from the same broker that matched the selection criteria, the latest publication was selected. When more than one broker issued a report for the same company and matched the selection criteria, both were included in the sample to eliminate the potential bias toward valuation methods by certain investment brokers.
A total of 99 equity research reports were used (see Table 2), covering at least 44 different companies and representing 97.78% of companies included in the LQ-45 index. They were comparable to the ones used by Imam et al. (2013) who analyzed 62 reports which included 45 different companies and represented 90% of all companies included in the DJ Euro Stoxx 50 index.
Brokerage House List (Sell-Side Analysts).

The process of identifying which valuation model preferences were used in each equity research report is as follows:
First, the valuation section of each report was analyzed and examined whether the analyst showed a preference for using a particular valuation model.
When two or more valuation models were mentioned in the report, the valuation model mentioned to produce a target price directly was considered as the preferred model.
In a case where there were two or more models used together to produce a target price directly, both (all) were considered as the preferred models.
The process of investigating the accuracy of the target price is as follows. First, historical stock prices from sample companies were downloaded from the Yahoo Finance database. Only daily share prices from the sample companies that had passed the 12 months after the publication of their respective equity research reports (January–December 2015) were selected. Then, it was important to check whether the estimated target price was achieved in a 12-month time frame. Bradshaw (2002), O’Brien et al. (2017), and Yin et al. (2016) showed that analysts often used target prices to justify their stock recommendations. For this reason, provisions to categorize whether the target price had been achieved were provided as follows:
BUY: For reports with a buy recommendation, the target price is achieved if the maximum price of the company’s shares during the 12-month time frame is greater than or equal to the target price.
SELL: For reports with sales recommendations, the target price is achieved if the minimum price of the company’s shares during the 12-month time frame is less than or equal to the target price.
HOLD: In this case, generally, the target price is expected to be slightly higher than the current price (after 12 months) because the analysts expect a positive return although the difference between the current and target price is not significant enough to provide buying recommendation. Therefore, the maximum price of the company’s shares during the 12-month time frame in determining whether the target price is achieved is also considered. The target price is achieved if the maximum value of the actual stock price during the estimated time frame is ±5% of the target price.
Results and Analysis
Table 3 presents descriptive statistics of the overall level of analyst accuracy (99 reports) consisting of 44 companies in the LQ-45 index from January 2014 to December 2014. There are 61 reports (61.62%) with “Buy” recommendation, 5 reports (5.05%) with the “Sell” recommendation, and 33 reports (33.33%) with the “Hold” recommendation. The accuracy of the target price is presented based on the level of error (error allowance: 0%, 3%, 5%, and 10%). For example, if the error rate used is 5%, then any target price that misses less than 5% is considered achieved. Meanwhile, if the error rate used is 0%, then any slightest error in the target price will not be considered achieved.
Descriptive Statistics of Target Price Accuracy Rate.

Note. This table presents descriptive statistics of the target price accuracy in 99 sample of analysis reports with a 12-month time frame. Cases where the stock price does not achieve the target with a difference of less than 1%, 3%, 5%, and 10% are considered.
Also, Table 3 shows that the overall level of analyst accuracy (99 reports) is under 50% (45.45%) and increases to 70.71% when the error allowance rate used is 10%. This is consistent with previous research by Imam et al. (2013) which showed that the overall accuracy was only under 50% (49.09%) in Europe. Meanwhile, Asquith et al. (2005) found an overall accuracy of 54.3% in the United States. In Germany, Kerl (2011) found an overall accuracy of 56.5%. However, in Italy, Bonini et al. (2010) only found an accuracy of 33.1%.
For the reports with the “Buy” recommendation (61 reports), the accuracy rate of the analyst’s target price is 62.30% and increases to 88.52% when the error allowance rate used is 10%. Meanwhile, for the reports with the “Sell” recommendation (5 reports), the accuracy of the analyst’s target price is 60% and increases to 80% when the error allowance rate used is 10%. It was interesting to understand that the reports with the “Hold” recommendation (33 reports) only contribute to an accuracy of 12.12%. This level of accuracy is still far lower than the overall accuracy, even after an error allowance rate of 10% is used (36.36%).
The H1a hypothesis states that the accrual-based model is the most popular valuation model, regardless of whether the valuation model is dominant or not. Table 4 presents the frequency of valuation models mentioned by the analysts in the sample equity research reports regardless of whether the model is used as a dominant valuation model or not.
Valuation Models That Appear in Cross-Sector Equity Reports.

Note. The table above includes all valuation models that are mentioned at least once in each equity reports, regardless of whether they are used as the dominant valuation model or not. If the analyst report calculates the target price based on multiples of P/E only, number 1 (one) will appear under the “P/E” column. If the target price is based on EV/EBITDA and DCF, then the number will appear under the “EVM” column and the “DCF” column. Generally, there will be more valuation models than the number of reports, because the analysts often use two or more models in their reports. P/E = price to earnings; PEG = price to earnings growth; EVM = enterprise value multiple; PBV = price to book value; p/PPOP = price to pre-provision operating profit; RIVM = residual income valuation model; P/CF = price to cash flow; DCF = discounted cash flow; DDM = dividend discount model; NAV = net asset value.
Table 4 also shows that the accrual-based model appears 266 times, while the cash-flow-based model appears 55 times in the sample reports. This is consistent with the earlier prediction mentioning that the accrual-based model is a valuation model that is more popular whether the model becomes a dominant valuation model or not. Therefore, H1a is empirically supported.
As can be seen from Table 4, the P/E multiples are the most popular models, appearing 97 times (97.98%) in 99 reports. The P/E multiples are also the only model mentioned at least once in each sector. While the DCF is the fourth valuation model most regularly used after the P/E multiples, PBV multiples, and EV multiples. The DCF is quoted 46 times (46.46%) in 99 reports and mentioned at least once in each report except in the financial services and agriculture sectors.
Two valuation models are only mentioned in one particular industry. Both models appear as valuation models based on return on equity against equity costs adjusted for growth (ROEg/COEg) and prices to pre-provision operating profit (P/PPOP). Each is quoted 5 times, all in the financial services sector. This is consistent with Demirakos et al. (2004, 2010); Imam et al. (2013) found that the analysts in different industries had different preferences related to the valuation model used. They also confirmed that in the financial services sector, the DCF was rarely used.
It is interesting to note that compared to the accrual-based model, the multiple cash-flow-based model (P/CF) is rarely used in a single-period comparative valuation model—in fact, the model is only mentioned once in the agriculture sector. According to Penman’s (2001) research, this was because the cash flow was not effective in measuring the value added for the short term.
The H1b hypothesis states that the cash-flow-based model is the dominant valuation model that the analysts prefer to produce target prices. Table 5 shows the dominant valuation model used in each report. It was found that the accrual basis is still the dominant preferred valuation model for generating target prices. The accrual-based model is used 62 times, while the cash-flow-based model is used 52 times as the dominant valuation model to produce a target price. Therefore, H1b is not empirically supported.
The Dominant Valuation Model Used in Cross-Sector Equity Reports.
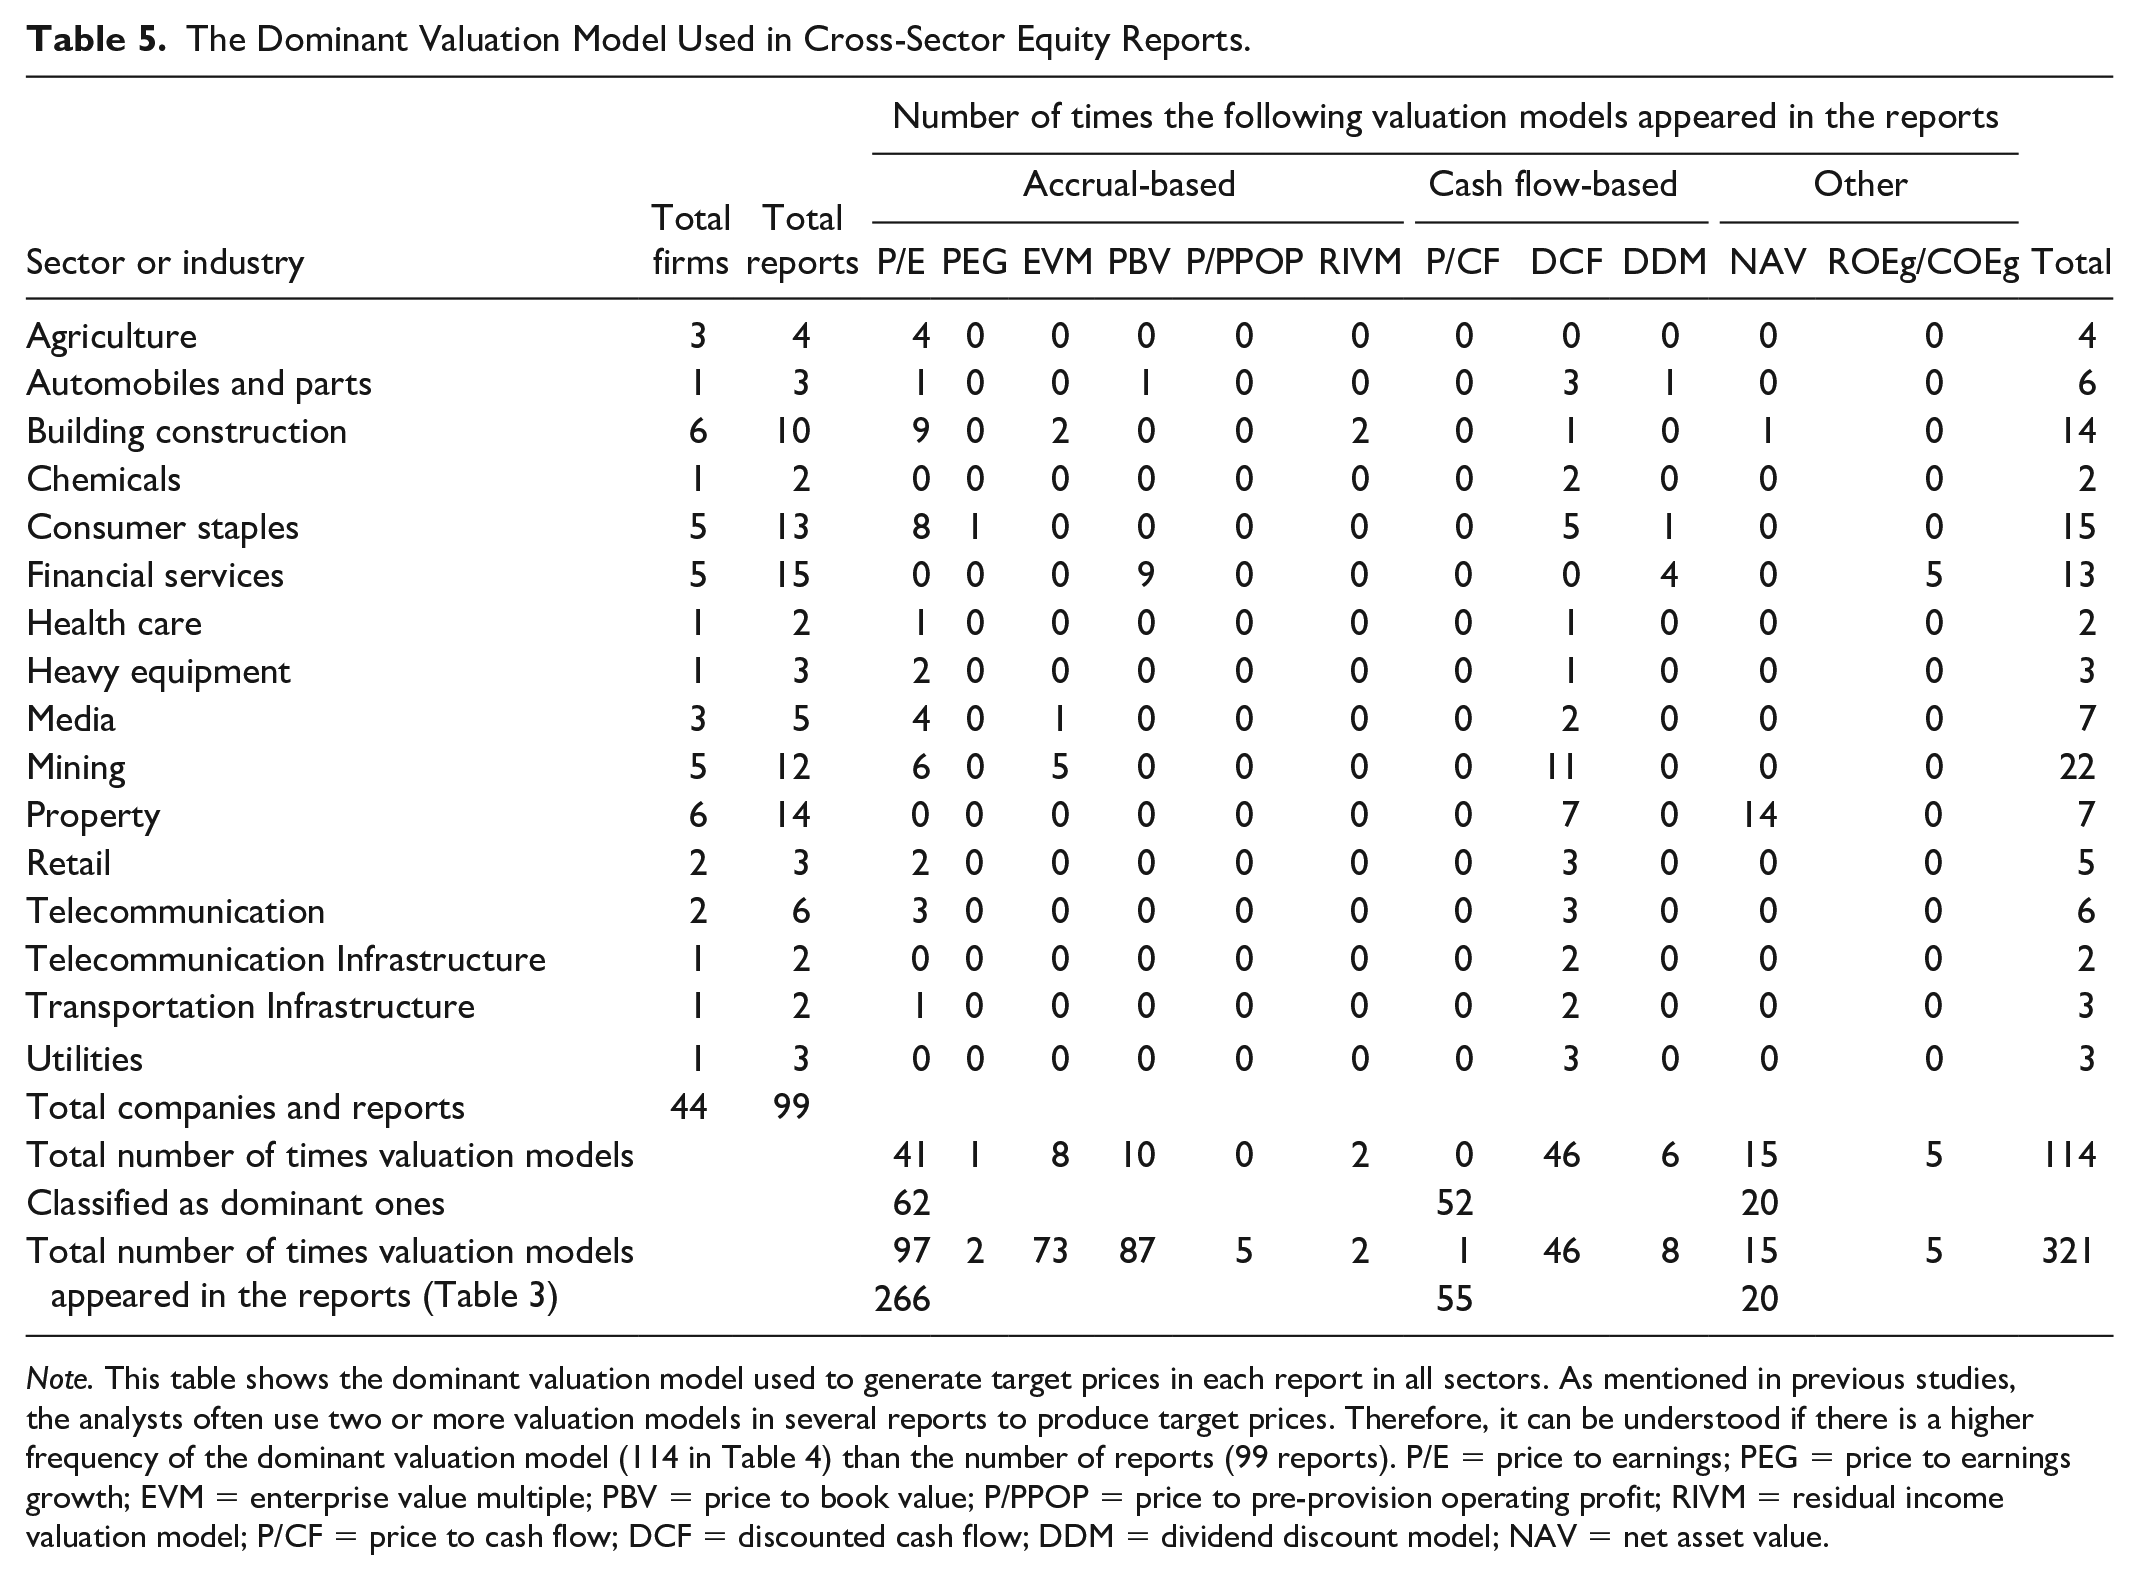
Note. This table shows the dominant valuation model used to generate target prices in each report in all sectors. As mentioned in previous studies, the analysts often use two or more valuation models in several reports to produce target prices. Therefore, it can be understood if there is a higher frequency of the dominant valuation model (114 in Table 4) than the number of reports (99 reports). P/E = price to earnings; PEG = price to earnings growth; EVM = enterprise value multiple; PBV = price to book value; P/PPOP = price to pre-provision operating profit; RIVM = residual income valuation model; P/CF = price to cash flow; DCF = discounted cash flow; DDM = dividend discount model; NAV = net asset value.
However, from the perspective of individual models, the DCF is the most preferred model to be used as the dominant valuation model. The model is used 46 times (46.46%) from 99 reports. However, the P/E multiples are the second most preferred model to be used as the dominant valuation model used 41 times (41.41%) of 99 reports. This finding is consistent with the earlier prediction that the DCF is still the most preferred model to be used as the dominant valuation model to produce target prices. Therefore, H1c which states that the DCF is the most popular dominant valuation model is empirically supported.
These data also show that every time the DCF is mentioned in a report, it will always be chosen as the dominant valuation model. Also, whenever a multi-period valuation model is mentioned in a report, the model is more often chosen as the dominant valuation model. For example, there are 52 out of 55 times the multi-period cash-flow-based valuation model which is used as the dominant valuation model (94.55%).
In contrast, the multiples’ model that uses a single period is mentioned 266 times, but only 62 cases of the model are used as the dominant valuation model (23.31%). This is consistent with the view that the cash flow provided information about the company performance that was not included in the current earnings. DeFond and Hung (2003) confirmed that the demand for cash flow increased when the information about earnings was not enough to estimate the company value. Furthermore, Call et al. (2009) also showed that the estimation of cash flows was very complex because it involved the use of various information from financial statements, industry data, and macro-economics.
The H2 hypothesis states that the cash-flow-based valuation model outperforms the accrual-based models in terms of their level of accuracy. Table 6 provides the accuracy of the target price generated by the dominant valuation model. This shows that the accrual-based valuation model is accurate in 46.77% of cases. The P/E multiples are found to have the lowest accuracy rate (46.34%) after the PEG multiples (0%). While the PBV multiples (50%) and EV multiples (50%) have slightly better accuracy than the P/E multiples.
The Performance of the Dominant Valuation Model Along With the Level of Insurance Adjusted for the Error Allowance of 3%, 5%, and 10%.
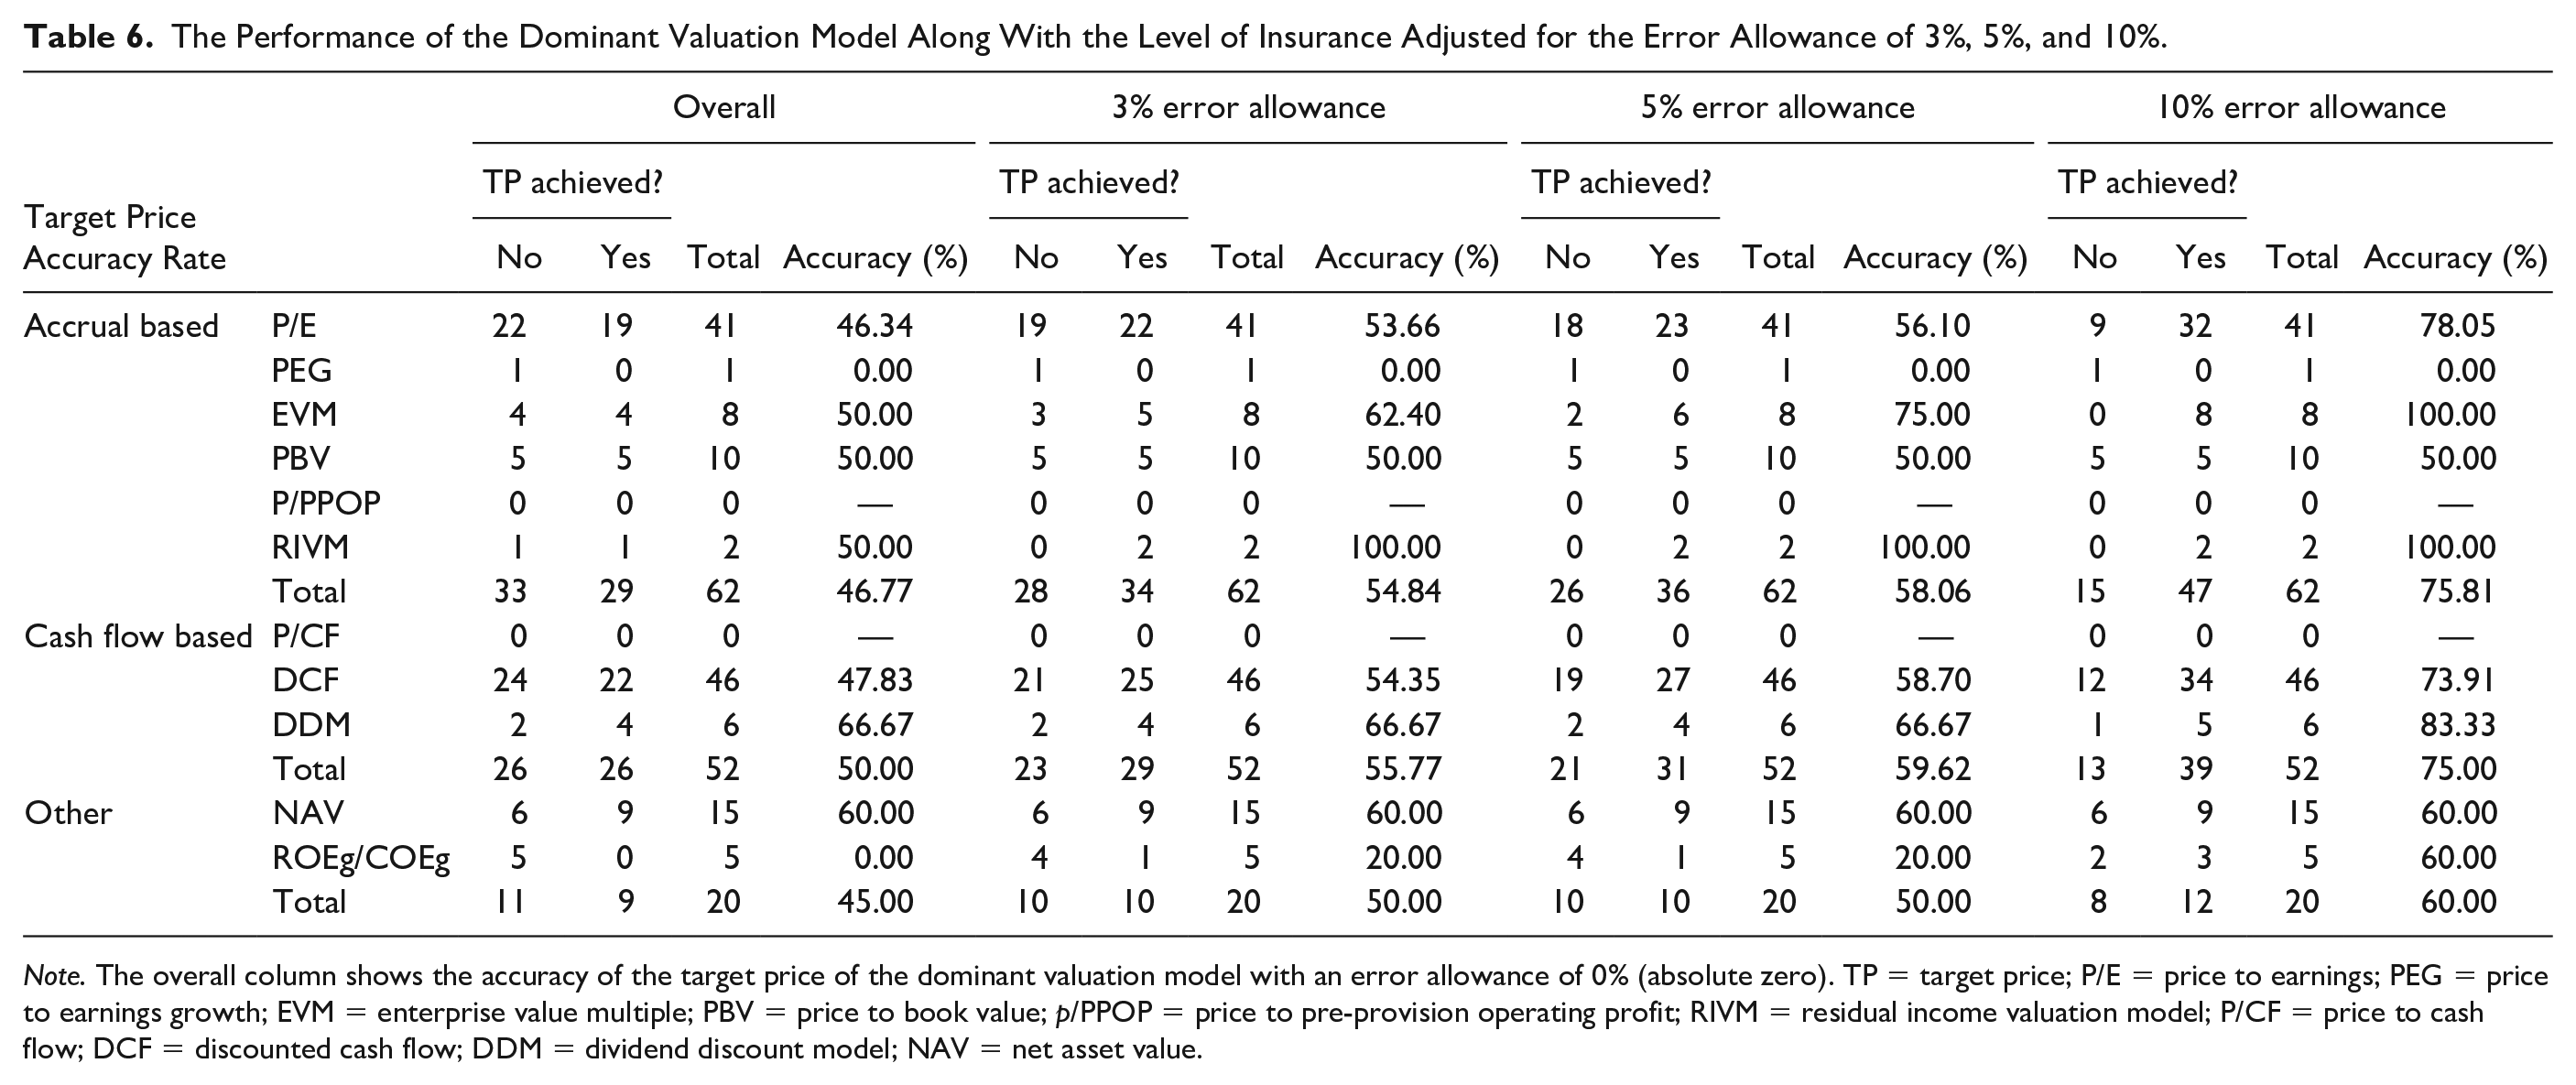
Note. The overall column shows the accuracy of the target price of the dominant valuation model with an error allowance of 0% (absolute zero). TP = target price; P/E = price to earnings; PEG = price to earnings growth; EVM = enterprise value multiple; PBV = price to book value; p/PPOP = price to pre-provision operating profit; RIVM = residual income valuation model; P/CF = price to cash flow; DCF = discounted cash flow; DDM = dividend discount model; NAV = net asset value.
The results in Table 6 also show that each time the cash-flow-based model is chosen as the dominant valuation model (52 times), there is 26 times the target price achieved in a 12-month time frame. The DCF—the most popular and dominant valuation model in previous studies—seems to be only accurate in 22 of 46 reports (47.83% accuracy), slightly above the PE multiples. Whereas the DDM has the best level of accuracy among all the models in the table (66.67%). The combination of both (DCF and DDM) represents 50% accuracy. This percentage also outperforms the accuracy of other models which include the NAV (60%) and ROEg/COEg (0%) with a combined accuracy of 45%.
Cases with an error allowance of 3%, 5%, and 10% were also examined. When an error allowance of 3% is used, the performance of the accrual-based model increases dramatically to 54.84%. While the cash-flow-based model and other models increase to 55.77% and 50%, respectively. Surprisingly, the RIVM performance also increases from 50% to 100%. The RIVM is also the only model that has perfect accuracy in the error allowance of 3% and 5%.
This finding is consistent with previous research by Ashton et al. (2011) and Penman and Sougannis (1998) who found that the RIVM (accrual-based) produced more accurate estimates of company value than the DDM and DCF (cash flow-based). However, from the perspective of the accounting variable classification, the cash-flow-based model has the highest level of accuracy in the error allowance of 0%, 3%, and 5%. This is consistent with the view that the cash flow provided the information about the company performance that was not included in the current earnings figures and the fact that the cash flow forecasting was very complex because it involved the use of extensive information (Call et al., 2009). Therefore, H2 is empirically supported.
Then, the H3a hypothesis states that the analysts prefer to use the cash-flow-based model in conjunction with the accrual-based model rather than using only a single-cash-flow-based model or accrual-based model only.
In general, Table 7 shows that the cash-flow-based model is used as a reference to the accrual-based model in 53 of 99 reports. This shows that the majority of analysts in the 99 reports (53.54%) preferred to use the cash-flow-based model as a reference rather than the accrual-based model.
Using the Cash-Flow-Based Model Only as a Reference to the Accrual-Based Model.

Note. Reference here means the related model is mentioned in the report regardless of whether the model is used as a dominant valuation model or not.
However, when the researchers considered the reports with the accrual- and cash-flow-based models to be used simultaneously as the dominant valuation model, there are only 14 reports which did so (Table 8). This shows that only a few analysts in the sample report used the cash-flow-based model in conjunction with the accrual-based model to produce target prices. Therefore, H3a is not empirically supported.
Using the Accrual-Based Model in Conjunction With the Cash Flow-Based Model to Produce a Target Price.

Note. In this table, what is meant by “in conjunction” is that the two related models are used as the dominant valuation model to produce target price.
Next, the H3b hypothesis states that the use of the cash-flow-based model in conjunction with the accrual-based model leads to more accurate valuations. Table 9 shows the level of accuracy using both models as the dominant valuation model simultaneously. The Chi-square test was not used to test accuracy. It was used to test whether the related accuracy was just a matter of randomness or not.
Chi-Squared Statistic to Test the Significant: Observed Frequencies.

Note. This table shows the use of cash-flow and accrual-based models are used in conjunction to determine the target price and related accuracy. p value less than 5% = significant; p value less than 1% = very significant. Panel A: p value = .4805; panel B: p value = .2444; and panel C: p value = .0104.
Chi-Squared Statistic to Test the Significant: Expected Frequencies (If Independent).

Note. This table shows the expected frequency if there is no relationship between A or B. The test performed determines whether they differ significantly or not. The null hypothesis says no, or they are completely independent of each other. If there are differences, it is just a matter of randomness.
Panel A shows that the target price is achieved in 8 of the 14 reports when the accrual-based model is used in conjunction with the cash-flow-based model to determine the target price with an error allowance of 0%. The Chi-square test fails to show that the accuracy increases if the accrual-based model is used in conjunction with the cash-flow-based model to determine the target price.
When the 5% error allowance (Panel B) is considered, the Chi-square test still fails to show that the accuracy increases significantly if the accrual-based model is used in conjunction with the cash-flow-based model as the dominant valuation model. However, based on the Chi-square statistical test (with an error allowance of 10%), the accuracy increases significantly if the accrual-based model is used in conjunction with the cash-flow-based model to determine the target prices. Therefore, H3b can only be accepted if the allowance error used is 10%.
The robustness checking results by using multivariate analysis is shown in Table 11. It can be observed from the results for Panel A that the model’s regression coefficient is not significant, and the same results also apply for Panel B. The model’s regression coefficient for Panel C is significant at 1% significance level. The sign for all regression coefficient is negative, which shows that the usage of cash-flow-based models will reduce the deviation, or in other words, will increase the accuracy.
Robustness Checking Results.

Note. The dependent variable is the deviation between the target price and the actual price and the independent variable is the valuation method (1 if using the cash-flow-based models, 0 if not). The number in parentheses is t-statistics.
Significant at 1% level of significance.
Conclusion
This study compares the use and accuracy of valuation models to gain a better understanding of how the analysts value companies in the Indonesian capital market. The findings show that the accrual-based models, especially the P/E multiples, were the most popular valuation models for cross-sector equity reports. However, from the perspective of the dominant valuation model, DCF was the most regularly used valuation model to produce the target prices. Furthermore, the cash-flow-based models provided the highest accuracy among other models with an error allowance of 0% to 5%.
There are several limitations to this study. First, it is the sample in terms of quantity and period. This study is based on too many sample sizes because of limited access to the equity research report data. This study analyzes 99 equity research reports selected from 13 stock-brokerage houses which include at least 44 different companies representing 97.78% of all companies included in the LQ-45 index. Also, the sample used is only from the period from January 2014 to December 2014 to be tested for accuracy in the following year. Further insight can be obtained by doing the same analysis on a larger sample size with a longer period.
Footnotes
Authors’ Contributions
All the authors have made an equal contribution to this study.
Availability of Data and Materials
The datasets used and/or analyzed during the current study are available from the corresponding author on reasonable request.
Declaration of Conflicting Interests
The author(s) declared no potential conflicts of interest with respect to the research, authorship, and/or publication of this article.
Funding
The author(s) received no financial support for the research, authorship, and/or publication of this article.