
Abstract
Nowadays, due to the increase in traffic accidents, research has emphasized the importance of vision in driving. This research aims to study the relationships between publications and their corresponding authors and identify the different research areas on vision and safe driving that have awakened interest in researchers. Web of Science was the database utilized for searching publications from the first paper published (1957) to December 2021, selecting the keywords: driv*, safety, and vision. The publications’ analysis was made using the CitNetExplorer, VOSviewer, and CiteSpace software. A total of 3,777 publications and 3,887 citation networks were found. In 2019, there was a total of 391 publications and 15 citation networks. The most cited publication was “Older Drivers and Cataract: Driving Habits and Crash Risk” published by Owsley et al. in 1999, with 76 as citation index. By the clustering function, five groups were found that cover the main research areas in this field: ocular movements, detection systems, road safety, and age. The citation network offers both, a quantitative and qualitative analysis of the main articles. Being a multidisciplinary field of study, current research emphasizes the importance of eye movements while driving, the visual impairment in elderly drivers, and the new video-based detection systems.
Introduction
Road traffic crashes become a significant problem worldwide due to the increase in the number of vehicles. Vehicles move at high speeds on the road to shorten travel time, with the subsequent increase in road accidents. Likewise, a high number of accidents are due to fatigue or driver distraction (Lin et al., 2020). Around 1.2 million people die worldwide every year due to traffic accidents, and between 20 and 50 million people are injured or handicapped. This pattern varies in developed and underdeveloped countries, and each society has its approaches and strategies to counteract traffic accidents (Moafian et al., 2013; Morgado et al., 2017).
Driving is a multifactorial and complex competence that depends on visual and cognitive functions because it integrates sensory, perceptual, cognitive, and motor control components (Irwin et al., 2019). Driving involves developing specific and distinctive competencies, such as navigation, orientation, lane keeping, speed control, distance tracking, exploring the surroundings, or yielding (K. K. Ball et al., 2006).
Visual abilities and attention impact driving performance (Grundler & Strasburger, 2020). Saccadic movements are the most used and efficient method to keep proper fixation while driving, while the blink frequency and the saccadic characteristics are used to establish the level of fatigue and attention (Schleicher et al., 2008). Accordingly, visual dysfunction worsens the perception of traffic signals and danger, leading to more sudden maneuvers when trying to control the vehicle, causing higher uncertainty and a higher risk of collision (Aksan et al., 2013; Owsley & McGwin, 2010). Cognitive dysfunction predicts the risk of accidents and drivers’ behavior, such as uncertainty errors or speed changes (Anderson et al., 2012; K. Ball et al., 1998; Thompson et al., 2012).
Drivers who suffer from visual or cognitive dysfunctions tend to decrease their driving frequency, and their drop-out rates are higher than in healthy drivers (Connors et al., 2017). Because of this, they tend to drive through roads they already know. Visibility and the speed limit are considered risks for these drivers (Davis et al., 2018). Likewise, accidents in older drivers are associated with low visibility and high-speed limits, especially in areas with intersections (Lombardi et al., 2017).
The increase in the elderly population leads to an increase in elderly drivers, with around 36 million in the United States having a driving license (Martínez-Roda et al., 2016). Aging makes the lens opaquer, which causes a higher light scattering and causes a veil of scattered light on the retina that can cause glares due to a loss of contrast in the image of the retina (Ortiz et al., 2013; Wood & Owens, 2005). The decrease in contrast sensitivity has been associated with a higher rate of accidents and it is a significant indicator of the drivers’ performance (Gray & Regan, 2007; Wood & Owens, 2005). In recent years, to decrease the risk of accidents, several systems have been developed: systems to detect lane changes through the detection of the white lines on the road, to detect obstacles through stereo images, and warning systems to detect pedestrians using images obtained through infrared cameras or to detect vehicles on the road through laser sensors and camera systems (Coelingh et al., 2010; Morgado et al., 2017).
The introduction of the most recent detection systems has led to an uptick in the amount of writing and attention given to research on road safety regarding visibility. Because of this, this study aims to highlight the areas of most interest in this field and analyze the relationships between the research groups and publications. This identification comes from the fact that a citation is a verifiable acknowledgment of a prior work. Bibliometric indicators that track scientific impact (H Index, Impact Factor, Crown Indicator, etc.) keep the citation as a critical component of their analysis. Therefore, the analysis of the citation network offers the bibliometric value of the publications.
Citation network analysis is used for searching scientific works regarding a specific topic. Through this deep search, additional relevant publications can be discovered with the purpose of quantitatively and qualitatively displaying the connections between articles and authors by forming groups (González, 2009). Additionally, it allows quantifying the top cited publications in every group to analyze the progress of a particular research field or aim the bibliographic search on a specific topic (González, 2009; van Eck & Waltman, 2014). This analysis is utilized to note focal research topics in a given field, major leading institutions, or research groups, along with the relationships between them. This eases the identification of opportunities for new leaps in any given topic. To the best of the authors’ knowledge, no citation network studies have been undertaken regarding the importance of vision and driving. Therefore, this article will allow us to identify the most crucial issues.
Methods
Database
The publications search was made through the Web of Science (WOS) database, using the following keywords: driv*, safety, and vision; and through a search in all fields. Likewise, the Boolean operators “AND” and “NOT” were used to avoid repetition of articles. The symbol * was used to search for the singular and plural forms of the terms: driv* safety AND (eye OR vision).
A citation index is a bibliographic directory that supplies citation links between documents. In our study, the following citation indexes were used: Social Sciences Citation Index, Science Citation Index Expanded, and Emerging Sources Citation Index.
The first article that emerged in the Web of Science database was from 1957, so the selected time interval to search was from 1957 to December 2021.
Data Analysis
The CitNetExplorer software was used to analyze the publications and visualize the citation networks. CitNetExplorer allows the study and visualization of citation networks among several scientific publications. Additionally, it enables the ability to monitor millions of interconnected citations and publications.
From a network of millions of publications, a deeper analysis of around one hundred publications can be made. Thus, it was possible to use a citation network comprised of several million publications as the starting point, before conducting a more in-depth analysis.
Network Analysis
The results were analyzed utilizing CitNetExplorer. This software provides a path for the visualization and analysis of citation networks amongst scientific publications. It also includes the chance to oversee numerous publications and interconnected appointments. A general network of such magnitude can produce a more comprehensive search, meaning it can narrow the search to fewer publications about a subject.
The “Citation Score” function has been used to undergo an analysis of the most cited publications in a period. This function quantifies the WOS database connections and the external connections from other databases. The “clustering” function allows you to include publications in groups based on the connections between them. Thus, the items that are most connected are within the same group. The “Identifying core publications” function allows the identification of the publications that comprise the network’s core. Those publications that presented at least four connections with other publications were considered. In this way, those publications of less importance are removed. The “drilling down” function allows for additional multilevel analysis of groups.
The VOSviewer software (version 1.6.9) was used for getting figures.
Nations’ co-authorship network: The nodes represented the nations participating in this research area. This indicates the implicit cooperation of the elements. The node increases in parallel, as the number of articles published by a single nation increases.
Cited references co-citation network: The nodes represented scientific references, and the node size corresponded to the number of times a reference was cited.
Author keyword co-occurrence network: The nodes represent the keywords with the highest number of citations. The size of the node represents how many times a keyword was cited.
Scientometric Analysis
CiteSpace software (5.6.R2) was relied upon for the scientometric analysis of the data. This Java-based tool links the theory of discrete and reorganized knowledge units, Price’s scientific frontier theory, Kuhn’s model of scientific revolutions, the top information foraging theory of scientific communication, and the arrangement of ideas.
The H index is used to measure the impact of research groups and productivity. To do this, the number of citations of articles published in a journal is evaluated.
The “degree” represents the number of connections between institutions, countries, or authors through the “knowledge of co-occurrence” graph. The tighter the connection, the higher the grade.
The “intermediary centrality” represents the importance of the nodes in the research cooperation network. For the calculation, the “geodetic distance” is used, the number of times that a node occurs between two other nodes.
The “half-life” is the continuity of research over time. It is represented as the number of years in which a publication receives half of its citations following the years from the date of publication. A low value represents an activity that reaches its maximum and decreases rapidly. Conversely, a high value decreases more gradually once the limit is reached.
Results
The search generated 3,777 publications and 3,887 citation networks in the WOS database.
As shown in Figure 1, the number of publications has increased significantly since 2011 (1957–2010: 21.8%; 2011-December 21: 78.2%). 2019 was the year with the highest number of publications, accounting for 391 publications and 15 citation networks.

Number of publications per year.
Description of the Publications
Amongst all the publications, 55.0% were articles, 40.2% were proceedings papers, 3.8% were reviews and the remaining 1.0% were meeting abstracts, editorial materials, or book chapters.
Language and Countries
English was the main language, with 98.6% of the publications, followed by German with 0.4%. Figure 2 and Table 1 show the countries with the highest number of publications, which were the United States (31.4%), China (16.2%) and Germany (8.3%). The publications increased in the United States and the United Kingdom due to their shared language. The use of English allows for a relationship between different groups of the scientific community. Thus, in this study, the region of the United Kingdom that stands out the most is England.

Collaboration amongst countries.
Characteristics of the Main Countries.

Table 1 shows the main characteristics of the five most important groups in Figure 2.
Research Areas
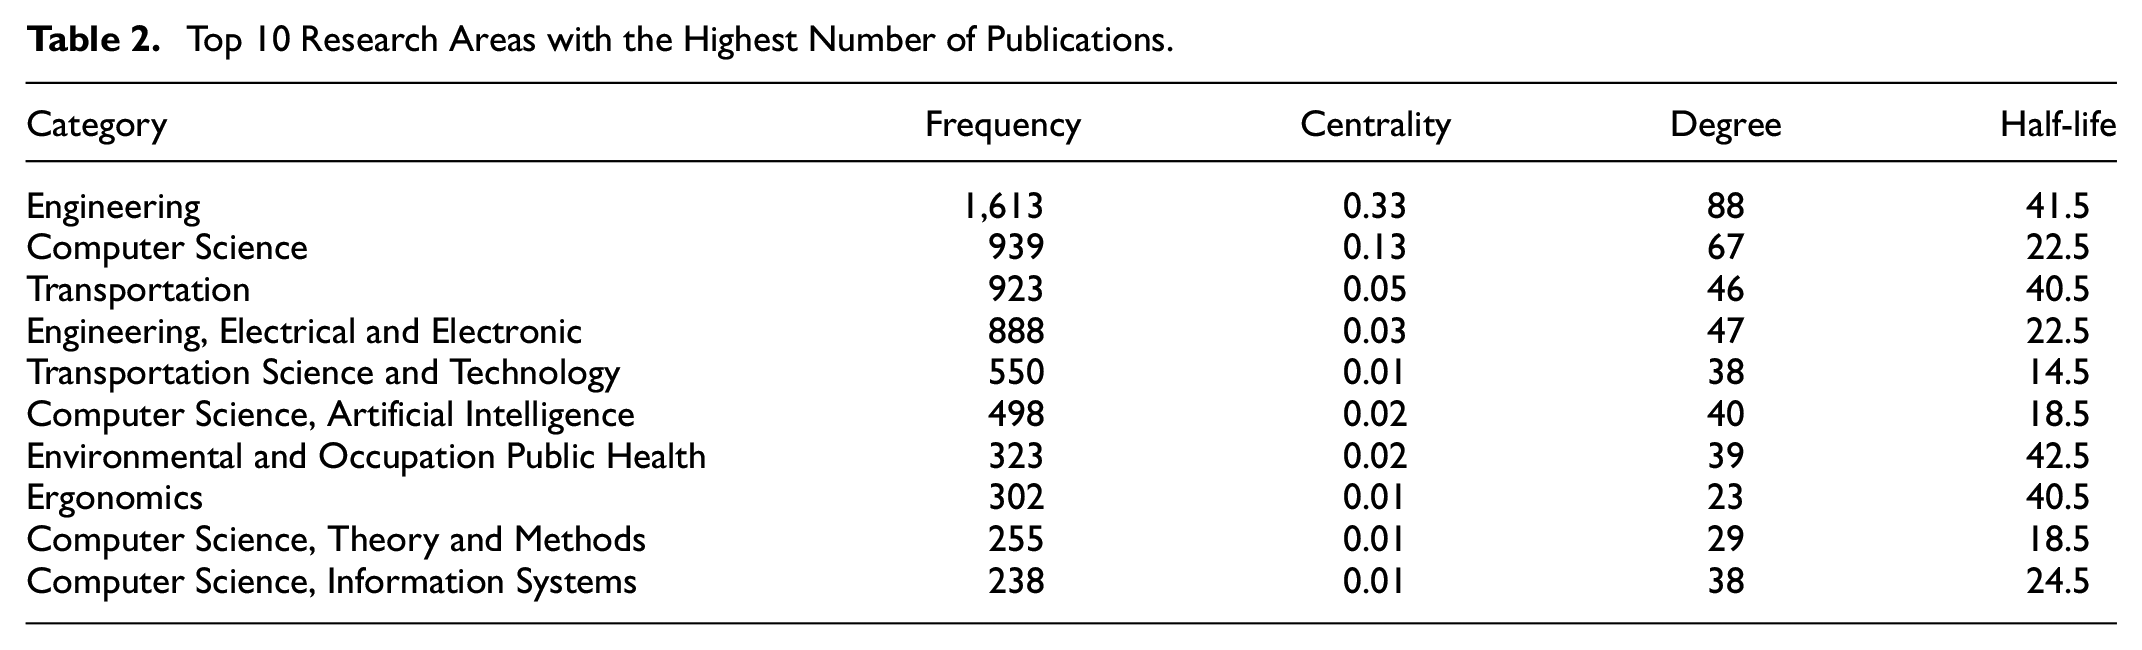
As per the Web of Science database, the research area is multidisciplinary. The fields of Engineering (46.1%) and Computer Sciences (26.8%) are particularly worth noting (Table 2). This further emphasizes the critical nature of visual health in the fields of engineering and computer science, since the 10 primary areas are focused on these fields, within different specializations.
Top 10 Research Areas with the Highest Number of Publications.
Authors and Institutions
Table 3 shows the authors with more publications on vision and safe driving: Joanne M Wood (publications: 1%; affiliations: Queensland University of Technology (QUT) Bombardier Transportat; Categories: Ophthalmology Engineering Transportation Psychology Public, Environmental & Occupational Health), Cynthia Owsley (publications 0.6%; affiliations: University of Alabama Birmingham UAB Heersink Sch Med University of Alabama System; Categories: Ophthalmology Geriatrics & Gerontology Public, Environmental & Occupational Health Engineering Social Sciences—Other subject ) and Bryan Reimer (publications: 0.5%; affiliation: geLab New England Univ New England Univ Transportat Ctr; Categories: engineering Transportation Psychology Computer Science Public, Environmental & Occupational Health).
Top 10 Authors with the Highest Number of Publications.

The institutions with the highest number of publications (Table 4) were Queensland University Technology (1.2%), the University of California San Diego (1.8%), and University of Michigan (1.4%). The University of Queensland presents a particularly high number of publications, as in that Australian state, visual safety is especially critical. Due to this, there is the Centre for Accident Research & Road Safety—Queensland (CARRS-Q). However, it should be noted that there are no connections between the three institutions with the most research in this field.
Top 10 Institutions with the Largest Number of Publications.

Journals
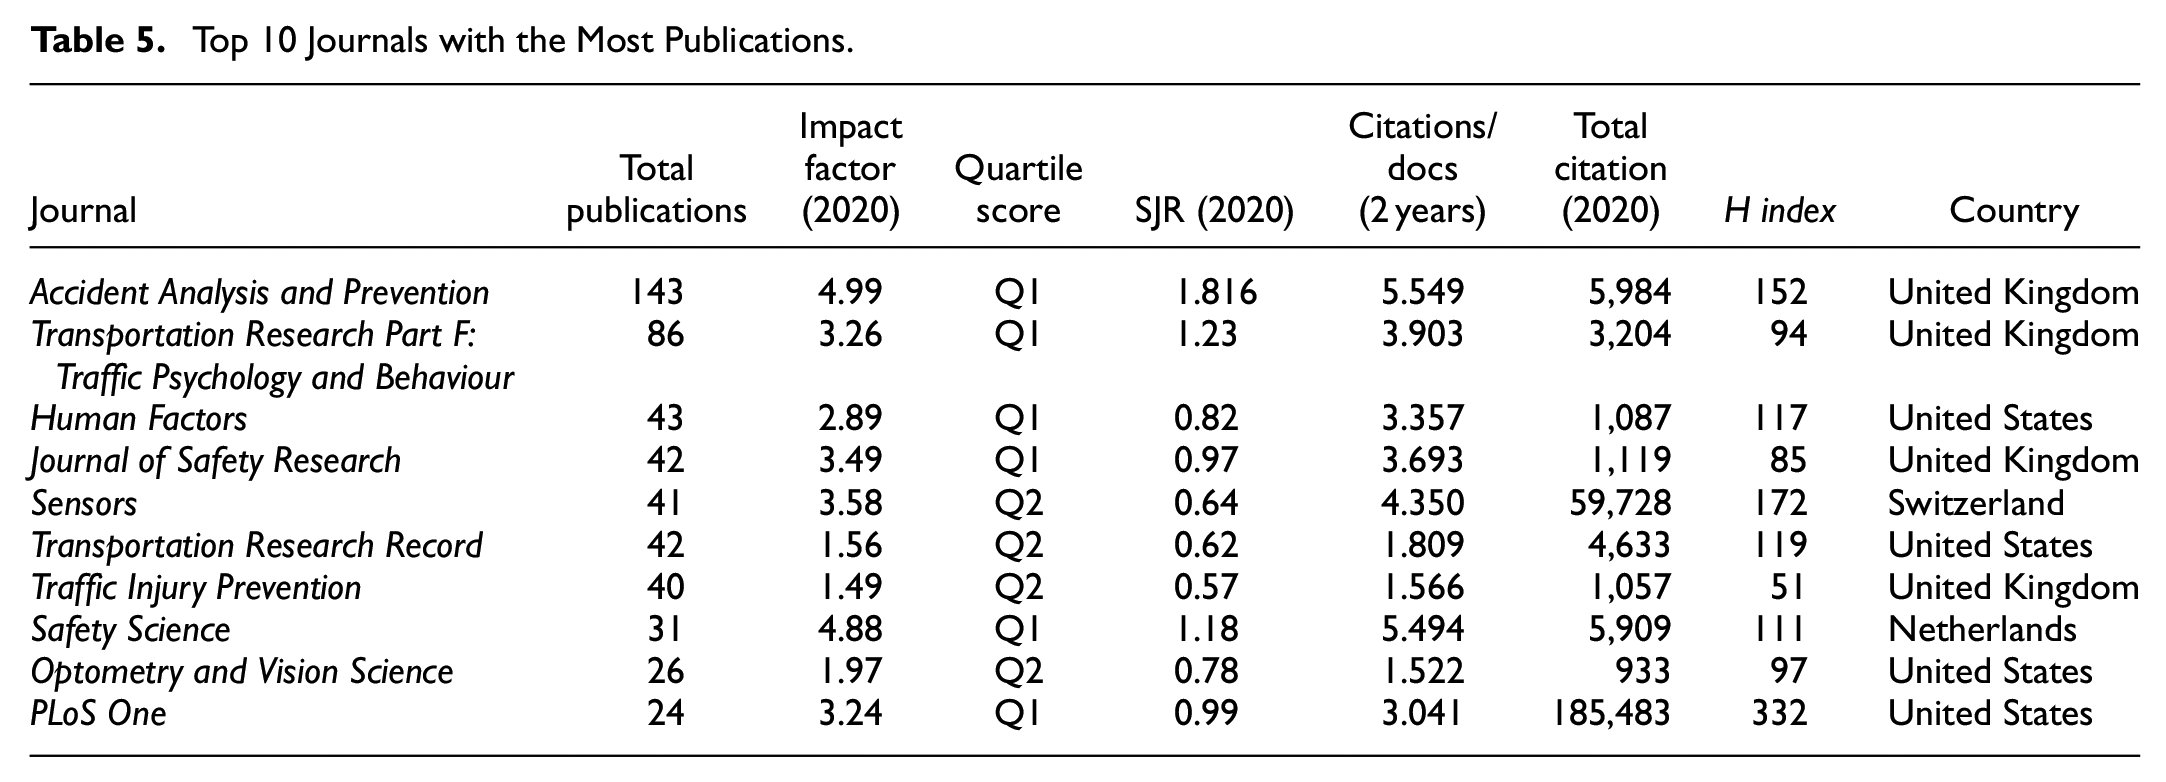
Table 5 shows the main journals and their number of publications according to the WoS database. The journals with the most publications are Accident Analysis and Prevention and Transportation Research Part F: Traffic Psychology and Behaviour, seeing as the main objective of these journals is road safety.
Top 10 Journals with the Most Publications.
Keywords
The most used keywords were “Safety,”“Vision,” and “Performance.” The keywords table was created to establish the main subject of this research field. To do so, the co-occurrence function (all the keywords as a unit of analysis), and the fractional count (as the chosen method of counting) were used. Table 6 and Figure 3 show the most used keywords in the most relevant publications.
Top 20 Most Used Keywords.


Most used keywords in the vision and driving’s citation network.
Most Cited Publications
The most cited publication was the article by Owsley and McGwin (2010), which was published in 1999, and showcased 73 citations. In this study, they examined the role that cataracts play in driving. They compared 279 drivers with cataracts against 105 drivers without cataracts within the 55 to 85 age group, and they analyzed the presence of accidents during the last 5 years. The results showed that drivers with cataracts had more restrictions while driving and higher uncertainty and that drivers with cataracts were 2.5 times more likely to suffer an accident.
When analyzing the 20 most cited articles, 7 analyzed the importance of correct eye movements, 10 analyzed the visual impairment in elderly drivers and 3 analyzed the new video-based detection systems (Table 7).
Top 20 Most Cited Publications.

Clustering
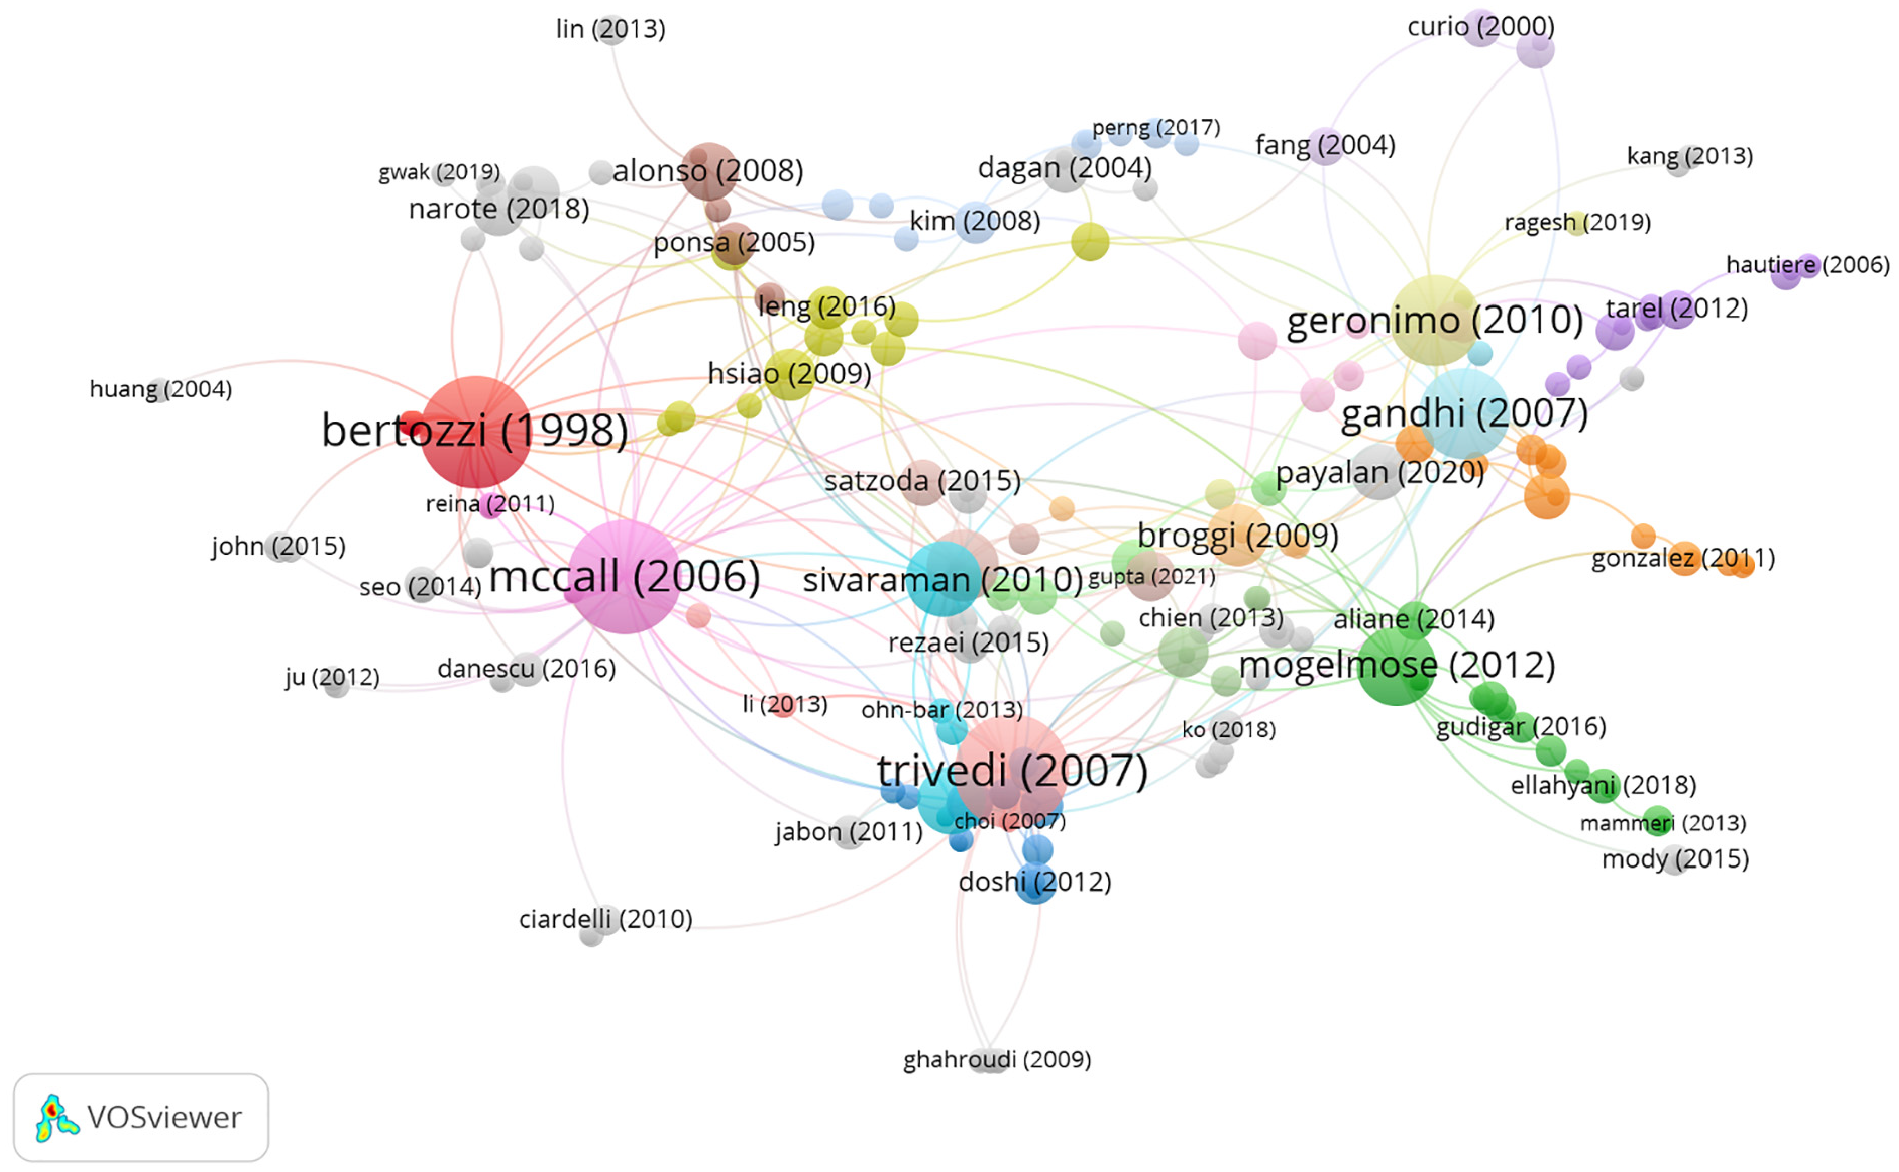
A co-citation network map was created to identify the literature. The co-citation network was selected as the type of analysis, the cited references were selected as the unit of analysis and the fractional count was selected as the counting method.
The clustering function identified eight groups. Five of them presented a significant number of publications. The remaining groups only presented 1.8% of the publications (Figure 4).

Main groups in the citation network.
In group 1, 555 publications and 1,329 citations were found across the whole network. The most cited publication was the article by Victor et al. (2005), which was published in 2005 in the Transportation Research Part F: Traffic Psychology and Behavior. In this study, In-vehicle Information Systems (S-IVIS) was used to discover that eye movements are extremely sensitive to the requests of visual and auditive tasks while driving. Data from 119 subjects on four different roads were retrieved: a motorway with real traffic with an instrumented vehicle, a motorway in a fixed-base simulator, and two rural roads in two different fixed-base simulators.
Overall, the articles in this group highlighted the importance of correct eye movements to perform a good visual search and to reduce distractions while driving (Figure 5).

Citation network in group 1.
In group 2, 346 publications and 1,316 citations were found across the whole network. The most cited publication was the article by Owsley and McGwin (1999), which was published in 1999 in The Journal of Gerontology. Series A, Biological Sciences and Medical Sciences is the top publication within the 20 most cited publications.
In this group, the articles analyzed the visual and cognitive impairment among elderly drivers (Figure 6).

Citation network in group 2.
In group 3, 314 publications and 462 citations were found across the whole network. The most cited publication was the article by McCall and Trivedi (2006), which was published in 2006 in the IEEE Transactions on Intelligent Transportation Systems. This publication analyzed the monitoring system for drivers VioLET (video-based lane estimation and tracking), which warns the drivers when they have a lane deviation and assists in vehicle guidance. The system was designed with steerable filters to obtain precise and robust detection of the lane markings.
In summary, articles in this group analyzed the new video-based detection systems to allow the drivers to know the surroundings of the vehicle, decreasing eye interactions and complex postures in different conditions that could affect their safety (Figure 7).
Citation network in group 3.
In group 4, 83 publications and 110 citations were found across the whole network. The most cited publication was the article by Fletcher and Zelinsky (2009), which was published in 2009 in the International Journal of Robotics Research. This publication looked to analyze a driver assistance system that not only is aware of the surroundings of the road and the actions of the driver, but it is also designed to correlate the sight of the drivers to the events that happen on the road to determine the drivers’ observations. In other words, it warns the drivers of the events that may happen on the road and that they might not have perceived.
In short, the articles in this group analyzed the vision-based systems that can detect obstacles, track the road, and carry out automatic maneuvers such as keeping in the lane, changing lanes, or preventing collisions (Figure 8).

Citation network in group 4.
In group 5, 69 publications and 106 citations were found across the whole network. The most cited publication was the article by Guéguen et al. (2015), which was published in 2015 in the Safety Science. This study looked to analyze how the glance of a pedestrian influenced the behavior of a driver who braked when they were reaching a pedestrian crossing. It was noted that staring at a driver increased the number of detections in a pedestrian crossing. These results suggested that pedestrians could increase their safety by using appropriate non-verbal signs towards drivers.
In this case, the articles in this group described the encounters between pedestrians and drivers, the communication, and the decision strategies in signposted or non-signposted crossings. Moreover, they also described the introduction of automatized vehicles on the public road (Figure 9).

Citation network in group 5.
Core Function
A total of 424 publications with four or more citations were found throughout the network, which is comprised of 1,818 publications: representing 11.2% (Figure 10). This showed that the research area is diverse. However, there was a clear approach in the research that was conducted in this field. In this analysis, the main subject was the importance of eye movements while driving.

Core publications in the citation network on vision and safety while driving.
Discussion
This study has highlighted the importance of vision for safer driving. The subject the researchers were most interested in was the importance of eye movements to make efficient visual searches and reduce distractions while driving. This field of research has a massive number of publications in the United States, and since 2011, the number of publications has increased significantly. The year with the most publications was 2019.
The Web of Science database was used to carry out this research, as it is one of the most extensive databases. Its search range starts as far back as the year 1900. Web of Science only accepts journals with worldwide impact and accessibility which endure a rigorous selection process. It is an interdisciplinary database and contains journals of top quality in every subject area.
The CitNetExplorer and CiteSpace software allowed us to obtain the connection between the fields and the different research groups. Thus, the clustering functionality was used to obtain the groups for each publication depending on the relationship amongst citations; the drilling down functionality allowed for a deeper analysis of the bibliography of the groups. The core publications functionality allowed us to identify the main publications in each group. By using the scientometric analysis, we obtained an important qualitative analysis of the existing bibliography to improve the understanding of this area of rapid growth.
The first publication in this research area was carried out by Danielson (1957), which stated the importance of having a correct visual field, both central and peripheral, to reduce the risk of accidents. Over the years, the number of publications in this field had a significant increase, with 2019 considered the key year. This can be related to the increase in the number of accidents in recent years and a greater concern by the traffic and transport departments. Accordingly, as seen in our study, the number of publications on visual safety has drastically increased from just 10 publications in 1971 to 9,998 in 2021. In 2019, an article was published by Vignali et al. (2019), in which they analyzed the importance of ocular movements amongst drivers to visualize pedestrians in the median strip and the “yield to pedestrians” signpost. After its intervention, the fixation time in the lines of the pedestrian crossings increased; and after adding an intermittent light to the signs, the visibility and the fixation time increased as well. Another study that is worth mentioning from 2019 is the one published by Jeong and Liu (2019), in which they proved that, after using visual stimuli, drivers who did not have a job related to driving presented a lower fixation in comparison with professional drivers. Along with this, in tight curves, these drivers looked at the road more frequently and for a longer duration, but their performance in keeping the car in the lane was worse. These studies proved the importance of vision for safe driving; especially how correct eye movements will allow the driver to have better fixation and higher stability when keeping the car in the lane. With regards to the journal with the largest number of publications on the importance of vision for safe driving, our results agreed with the bibliometric study carried out by Abdullah (2021) and Zou et al. (2018). Accident Analysis and Prevention was not only the journal with the largest number of publications on the importance of vision in driving but also was the largest in other research areas (psychology, education, economics, etc.). This could be because it was the journal with the greatest impact factor both in the Web of Science and the Scopus databases; thus, it was easier to access by readers and researchers. However, in another study carried out in India, the journal with the largest number of publications was the Indian Journal of Forensic Medicine and Toxicology Sharma et al. (2018). This difference could be because the search was exclusively focused on the journals with the largest number of publications written by Indian researchers.
The countries with the largest number of publications in our study agreed with the study carried out by Zou et al. (2018). In the study carried out by Abdullah (2021), the country with the largest number of publications was England, with the United States in third place. This difference was due to the research subject on which each search was focused since our study focused specifically on vision while Abdullah’s study was focused on road safety education. However, despite the differences, both countries were on the list of the most cited publications in both studies.
The three focal keywords, “security,”“vision,” and “performance” are related to the group of greatest focus by researchers. Poor ocular motility causes problems in driving maneuvers, such as changing lanes. In turn, when drivers make mistakes, the likelihood of an accident can increase by at least 18.2 times (Dingus et al., 2016). The direction of saccadic movements while driving influences how speed is perceived. Thus, saccadic movements coinciding with the direction of movement of the pursued objective raise the perceived speed, and saccadic movements in the opposite direction lower the perceived speed (Goettker et al., 2018). Pursuit eye movements can facilitate time-to-arrival estimation, resulting in superior estimation when observers chase the approaching object, as compared to fixating on it (Bennett and Miller, 2010). Nowadays, the importance of eye movements in driving is one of the most researched subjects in this field. We can refer to the study carried out by Babić et al. (2020), in which they examined the level of understanding of the traffic signs in different countries and tracked the eye movements of the participants when they did not know the signs. In doing so, they obtained that in the unknown signs and the ones with more information, the fixation time and the duration of a look were higher, which could negatively impact the behavior of the eyes and increase the risk of accidents. These authors highlighted the need to standardize traffic signs. Another study carried out by Mikula et al. (2020) suggested that the eye and head movements can show relevant information about the visual-cognitive demands associated with complex tasks. Likewise, eye-head coordination and the visual scanning dynamic could be suitable candidates to estimate the workload of drivers and describe high-risk driving behavior more effectively.
Another subject with a great impact was the influence of visual aging on driving. In a study carried out by Ortiz-Peregrina et al. (2020), it was confirmed that elderly drivers had worse results in most of the visual parameters (visual acuity, sensitivity to contrast, halos, etc.), with the straylight parameter being the most relevant. Also, the presence of cataracts led to visual impairment and worse performance while driving. Drivers who suffered from cataracts had an objective scattered index 3.5 times higher than the control group. In elderly drivers, it was also proven that glares reduced their ability to drive at night since their response time increased and the pedestrians’ detection rate was lower (Hwang et al., 2018; Kimlin et al., 2017). Although few studies relate the number of traffic accidents with lighting conditions, we must highlight the disproportionate number of accidents and their consequences that occur in low lighting conditions or night conditions compared to those given and their severity in daytime conditions. According to Murray’s study, poor lighting is the reason for 50% of accidents that occur at night, being one of the most common factors that can stress a driver (Plainis et al., 2006). Given the latest technologies applied in the automotive industry related to increasing visibility during night driving, such as high-intensity lighting (HID/Xenon) and LED headlights which are brighter, they also cause greater perceived glare, especially in those older people who suffer from cataracts due to their high component of blue light (Vignali et al., 2019).
Just as the population is older and, therefore, the impact of glare is greater, the lighting mentioned is the lighting used in the sector, with glare and possible solutions to mitigate it being the subject of research to develop new visual solutions.
In the future, automated vehicles will have external software, which will allow us to communicate relevant information about the road to users. In a study carried out by Eisma et al. (2020), they developed software called “external human-machine interfaces” (eHMIs), which informed when the vehicle was driving or waiting by using projections in different parts (roof, windscreen, on the tires, etc.) to inform the other users if they should cross or wait. However, eye-tracking analyses showed that the projection yielded dispersed eye movements, as participants scanned back and forth between the projection and the vehicle. This was because a projection on the road involves a visual effort for pedestrians since they have the split their attention between the projection and the car. In another study, eye movements were used to detect drowsiness among drivers through a support vector machine (Jin et al., 2013).
Overall, deeper research in this area is needed due to the increase in the elderly population and the higher risk of suffering more accidents because of visual impairment. Citation network analysis will allow us to help researchers find the most relevant publications and their connections with other publications in each field. This could change the way research is being carried out in many different areas.
Conclusions
This study showed a detailed and objective analysis of the importance of vision in driving. Through the citation network analysis, we were able to know that the most cited publication was the article by Owsley et al., which was published in 1999, and we also discovered that 2019 was considered as a key year due to the large number of publications. On top of this, we found that the authors and the journals with the greatest impact on this research area were Joanne M Wood and Accident Analysis and Prevention, respectively. Likewise, the five main groups highlighted the main research subjects in this field. The most relevant one was the importance of vision for safe driving, followed by the negative impact that age and cognitive impairment have on accident rates. Other subjects of interest, which may have a greater impact in the following years, were the new video-based detection systems, which allow us to know what is surrounding our vehicle, and the detection systems in case of finding any obstacle.
Drivers are faced with conflicting requirements that compete for attention. Frontal vision, peripheral vision, the control panel of the car, along with what is observed through the different mirrors. All these tasks require frequent eye and head movements accompanied by changes in direction, fixation, and accommodation. These requirements may be limited to a driver who needs to wear glasses, for example, or who does not have correct visual compensation, and the study of tools or the development of technologies that facilitate the complex task that driving entails for our visual system may be the reason for future developments.
In general, this study ushers the research areas with the most attention and future perspectives on the importance of acceptable vision for safer driving. This study will allow researchers to select journals or collaborators to circulate their results.
Footnotes
Declaration of Conflicting Interests
The author(s) declared no potential conflicts of interest with respect to the research, authorship, and/or publication of this article.
Funding
The author(s) received no financial support for the research, authorship, and/or publication of this article.
Data Availability Statement
Data sharing not applicable to this article as no datasets were generated or analyzed during the current study.